
Foundation November 2022 Paper 3 Q24
24 The scatter diagram shows the number of visitors to a children’s playground and the maximum temperature on fifteen Saturdays in summer.
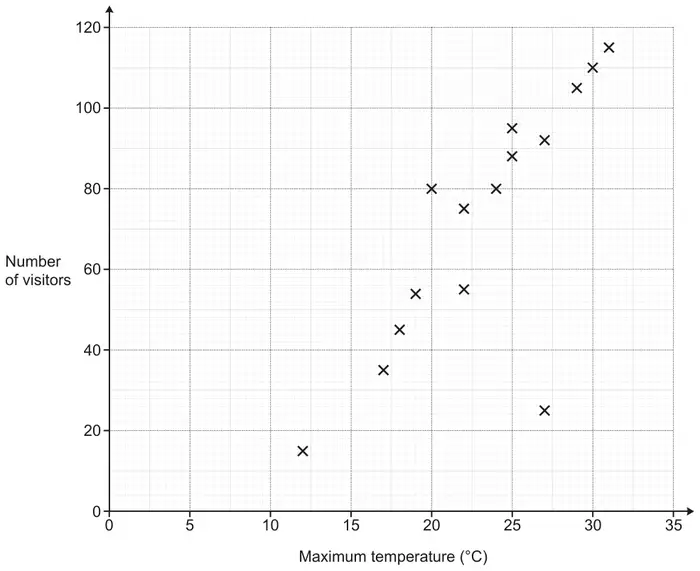
(a) Describe the type of correlation shown in the scatter diagram. [1]
(b) One Saturday was a hot but stormy day.
(i) Circle the most likely point on the scatter diagram for this Saturday. [1]
(ii) Explain why you chose this point. [1]
(c) Use a line of best fit to predict the number of visitors on a Saturday that has a maximum temperature of 21 °C.
.................... visitors [2]
| Answer | Marks | Part marks and guidance | |
|---|---|---|---|
| Positive | 1 | Ignore comments about strength but not that contradict e.g strong positive decrease | |
| Answer | Marks | Part marks and guidance | |
|---|---|---|---|
| (i) Clear indication of the point at (27, 25) | 1 | ||
| (ii) Hot day [with] few visitors or Outlier | 1 | See Appendix | |
Appendix
Appendix Q24(b)(ii)
| Response | Mark | Reason |
|---|---|---|
| There were not many visitors even though it was a warm day | ||
| There were not many visitors because of the storm | 1 | BOD “storm” in place of hot |
| High temperature but less visitors | ||
| It’s 27˚, a hot temperature, yet there are less than 40 visitors | 1 | Implies low number of visitors |
| It’s 27˚ and there were only 25 visitors | 1 | BOD 27 meaning “hot” and 25 implies low number of visitors |
| Because the temperature is high but attendance is lower than normal | 1 | Allow lower than normal for low |
| As there wasn’t alot of people but on other hot days there was alot of people | 1 | Acceptable: high temperature low visitors |
| It was hot but not many people | 1 | Accept hot and implying low people numbers |
| Because it’s hot however as it was stormy I don’t think that many people would have gone | 1 | BOD Hot and not many people and allow “not many would have” |
| Outlier | ||
| Anomaly | 1 | BOD equivalence to “outlier” |
| Not many visitors | 0 | Insufficient. There are other occasions when there are not many visitors does not mention heat |
| Because it was really hot | 0 | Insufficient. No mention of low number of visitors |
| It does not correspond to the correlation | 0 | Does not mention heat or visitor numbers |
| It does not fit with the rest of the points | 0 | Does not mention heat or visitor numbers |
| It is away from the correlation line | 0 | Does not mention heat or visitor numbers |
| It doesn’t follow the increasing trend | 0 | Does not mention heat or visitor numbers |
| Answer | Marks | Part marks and guidance | |
|---|---|---|---|
| Ruled line of best fit | B1 | Overlay is a guide only; their line must be between or through (15, 40) to (17.5, 40) and (22.5, 80) to (25, 80) If more than one line, mark the worst unless one clearly chosen | |
| 52 to 78 | B1 | If B0 scored, FT their ruled line of best fit with positive gradient | e.g. vertical line from 21 to the line ½ square tolerance |