
Higher June 2023 Paper 5 Q5
5 The table shows the ages and heights of 12 children.
| Age (years) | 2 | 4 | 12 | 6 | 10 | 11 | 13 | 11 | 5 | 7 | 9 | 14 |
|---|---|---|---|---|---|---|---|---|---|---|---|---|
| Height (m) | 0.84 | 1.01 | 1.5 | 1.4 | 1.4 | 1.35 | 1.62 | 1.42 | 1.14 | 1.24 | 1.26 | 1.68 |
The points for the first eight children (shaded in the table above) are plotted on the scatter diagram.
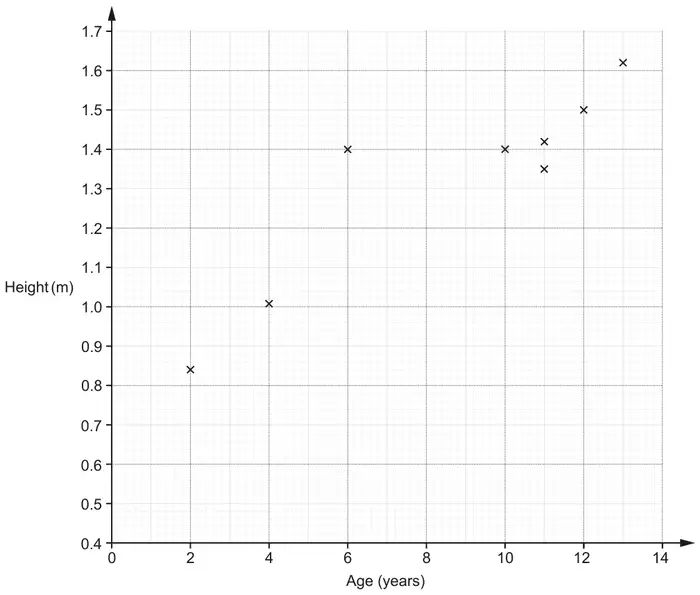
(a) Plot the points for the remaining four children. [2]
(b) Describe the type of correlation shown in the completed scatter diagram. [1]
(c) One of these children is taller than expected for their age.
On the scatter diagram, circle the point representing this child. [1]
(d)
(i) Kai is 8 years old.
By drawing a line of best fit, estimate Kai’s height. [2]
By drawing a line of best fit, estimate Kai’s height. [2]
(ii) Describe an assumption you have made in giving your answer to part (d)(i). [1]
(e) Explain why using this data to estimate the height of a child that is 17 years old may be unreliable. [1]
| Answer | Marks | Part marks and guidance | |
|---|---|---|---|
| Four correctly plotted points | 2 | B1 for 2 or 3 correct plots | Use overlay as a guide, ± half small square radially |
| Answer | Marks | Part marks and guidance | |
|---|---|---|---|
| Positive | 1 | Do not accept description of relationship Condone embellishments e.g. strong moderate, medium etc | |
| Answer | Marks | Part marks and guidance | |
|---|---|---|---|
| Point at (6, 1.4) indicated only | 1 | FT their plots from (a), If they have 2 outliers they must indicate both or just (6, 1.4) | |
| Answer | Marks | Part marks and guidance | |
|---|---|---|---|
| (d)(i) | |||
| Ruled line of best fit and answer FT ± 0.01 their straight ruled line at 8 years | 2 | B1 for ruled line of best fit or answer FT ± 0.01 their straight ruled line with positive gradient | Use overlay for LOBF, ruled line needs to reach both gates set at: (2, 0.8) and (2, 0.94) (13, 1.54) and (13, 1.66) |
| (d)(ii) | |||
| This child will fit the average pattern and will not be too tall or too short for their age oe | 1 | See appendix 2 Ignore incorrect statements | |
Appendix 2: exemplar responses for Question 5dii
| Response | Mark | |
|---|---|---|
| 1 | Kai has average height | 1 |
| 2 | Kai fits in with everyone else (and is not like a child age 6) | 1 |
| 3 | All children are similar/same height[s] at that age | 1 |
| 4 | Kai fits the trend | 1 |
| 5 | His height fits the line of best fit | 1 |
| 6 | That he is not too small/too tall (accept assumptions that imply that the growth is performing as expected for the average) | 1 |
| 7 | He follows the pattern. He could be tall or short for his age (accept the first part ignore incorrect statement) | 1 |
| 8 | That he has not had any growth problems (accept assumptions that imply that the growth has not been different to normal for some reason, reason must be given) | 1 |
| 9 | The sample of children is representative oe | 1 |
| 10 | Kai is the same height as another 8 year old | 0 |
| 11 | Kai grows according to the line on the graph. | 0 |
| 12 | Kai is shorter than expected for their age. (incorrect – should be Kai is not shorter ….. ) | 0 |
| 13 | Assumption: the older you get, the taller you will grow | 0 |
| 14 | He will be in the middle of a 7 and 9 yr old. | 0 |
| 15 | Kai is exactly 8 years old (needs more) | 0 |
| 16 | My line of best fit is accurate | 0 |
| 17 | Between 7 and 8 there is not much growth | 0 |
| 18 | Children age as they grow | 0 |
| Answer | Marks | Part marks and guidance | |
|---|---|---|---|
| Only have data on students up to 14 years old oe | 1 | Accept e.g. The trend may not continue The line of best fit should not extend beyond the data provided Outside range of data provided oe Small sample Do not accept e.g. 17 is not on the graph The graph does not go to 17 (alone) See appendix 3 Ignore incorrect statements | |
Appendix 3: exemplar responses for Question 5e
Reason must refer to or imply no data above 14 and not just refer to the graph not going above 14 alone.
Accept children, plots/points as implying data.
| Response | Mark | |
|---|---|---|
| 1 | It is extrapolated and not in the data provided | 1 |
| 2 | The diagram has no ages/data above 14 (underlined part gets the mark) | 1 |
| 3 | Insufficient data (small sample reference) | 1 |
| 4 | The graph does not go up to 17 as there is no data above 14 (underlined part gets the mark) | 1 |
| 5 | We do not know that the pattern of growth will continue above 14 (implies trend may not continue) | 1 |
| 6 | The graph does not cover that data range (allow for the underlined part) | 1 |
| 7 | There are no children on the graph above 14 (accept children for data) | 1 |
| 8 | There are no plots/points on the graph above 14 (accept plots/points for data) | 1 |
| 9 | Medical deficiencies (not sufficient to describe trend may not continue) | 0 |
| 10 | Doesn’t have a growth disorder (not sufficient to describe trend may not continue) | 0 |
| 11 | Grows normally (not sufficient to describe trend may not continue) | 0 |
| 12 | The graph reaches up to 14 (not referring to data) | 0 |
| 13 | Extrapolated (needs explanation) | 0 |
| 14 | As you may stop growing by 17 (not sufficient to describe trend may not continue) | 0 |
| 15 | The graph only goes up to 14 (not referring to data) | 0 |
| 16 | The graph does not show information for 17 year olds | 0 |
| 17 | By 17 they won’t be growing at the same rate (not referring to data) | 0 |
| 18 | Because it goes beyond the value on the axes | 0 |
| 19 | Because they could grow more or stop growing | 0 |
| 20 | There is no data | 0 |