
Higher November 2023 Paper 1 Q6
6 A music company releases 10 albums.
The scatter graph shows, for each album,
the number of downloads on the first day
and
the number of CDs sold on the first day.
A line of best fit has been drawn on the scatter graph.
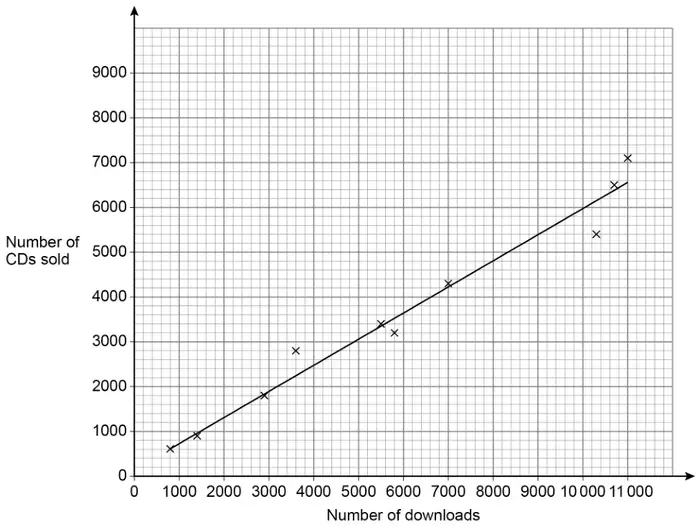
(a) The scatter graph shows positive correlation.
Describe the relationship between number of downloads and number of CDs sold. [1 mark]
(b) The company earns
£2.50 for each download
and
£3 for each CD sold.
The company releases another album.
On the first day it has 9000 downloads.
Estimate the total amount the company earns from downloads and CDs of the album that day. [3 marks]
| Answer | Mark | Comments |
|---|---|---|
| Valid description | B1 | eg as downloads increase, so do CD sales downloads are about \(\left[1\dfrac{1}{3}, 2\right]\) times as many as CDs CDs are about \(\left[\dfrac{1}{2}, \dfrac{3}{4}\right]\) as many as downloads |
Additional guidance
| Ignore ‘Positive correlation’ | |
| Condone references to causality eg an increase in downloads causes an increase in CDs sold | B1 |
| As one goes up the other goes up / Both go up at a similar rate | B1 |
| They both go up | B0 |
| Downloads are always more than CDs | B0 |
| They are in direct proportion | B0 |
| The relationship is linear | B0 |
| Answer | Mark | Comments |
|---|---|---|
| Alternative method 1 – reading from the graph | ||
| \(2.5(0) \times 9000\) or 22 500 or [5300, 5500] | M1 | oe 2.5(0) may be 2 or 3 [5300, 5500] may be 5000 |
| \(2.5(0) \times 9000 + 3 \times [5300, 5500]\) or \(22\,500 + [15\,900, 16\,500]\) | M1dep | oe 2.5(0) may be 2 or 3 [5300, 5500] may be 5000 |
| [38 400, 39 000] | A1ft | ft 2 or 3 for 2.5(0) and/or 5000 for [5300, 5500] |
| Alternative method 2 – using a multiplier | ||
| \(2.5(0) \times 9000\) or 22 500 or \(9000 \times [0.5, 0.75]\) | M1 | oe 2.5(0) may be 2 or 3 |
| \(2.5(0) \times 9000 + 3 \times 9000 \times [0.5, 0.75]\) | M1dep | oe 2.5(0) may be 2 or 3 |
| [36 000, 42 750] with \(9000 \times [0.5, 0.75]\) seen | A1ft | ft 2 or 3 for 2.5(0) |
Additional guidance
Check graph for working
Working may be in pence, units not required for up to M2
Final answer in pence must have units to award A1