
Higher June 2023 Paper 1 Q6
6 The scatter graph shows information about the ages and weights of some babies.
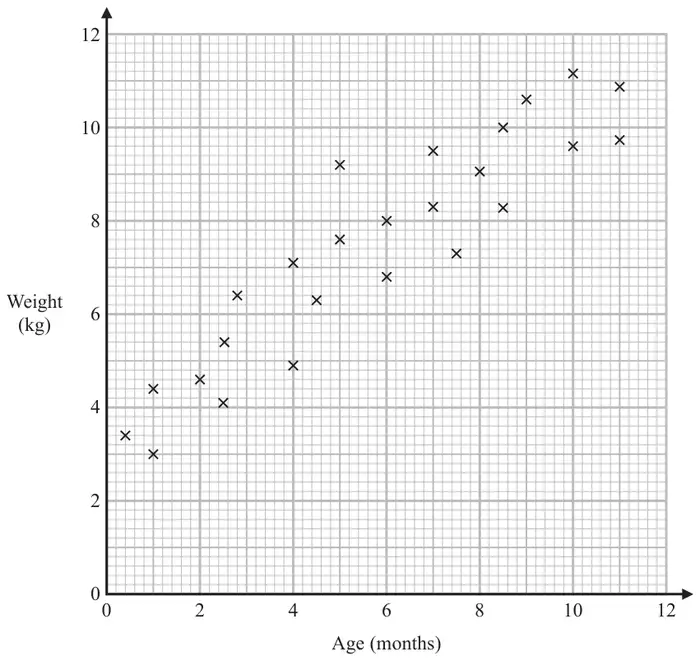
(a) Describe the relationship between the age and the weight of the babies. (1)
Another baby has a weight of 5.8 kg
(b) Using the scatter graph, find an estimate for the age of this baby. (2)
| Answer | Mark | Mark scheme |
|---|---|---|
| Description | C1 | for a valid description of the relationship Acceptable examples As age increases, weight increases The older you are the greater the weight Positive correlation Not acceptable examples Positive (relationship) age and weight are in proportion strong correlation or correlation is increasing as the babies get older the heavier they get, negative correlation they are directly proportional, weight goes up as age goes up |
Additional guidance
Accept positive correlation
Ignore any comment about strength
| Answer | Mark | Mark scheme |
|---|---|---|
| 2.5 to 4.5 | B2 | for an answer in the range 2.5 to 4.5 |
| (B1 | for a suitable line of best fit drawn or for a point on the grid at \((x, 5.8)\) where \(x\) lies between 2.5 and 4.5 or a horizontal line drawn from 5.8 across to \((x, 5.8)\) where \(x\) is in the range 2.5 to 4.5) |