
Higher June 2022 Paper 4 Q5
5 The scatter diagram shows the midday temperature at 13 different heights on a mountain.
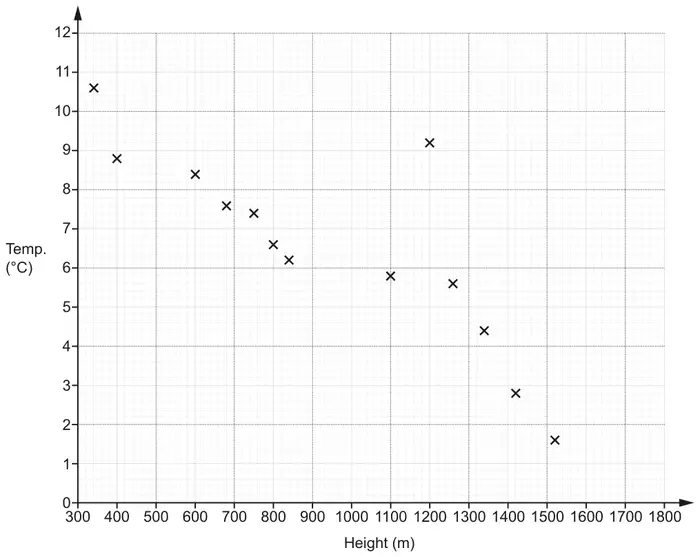
(a) The table has the information for 2 more heights.
Plot these on the scatter diagram.
Plot these on the scatter diagram.
| Height (m) | 500 | 1580 |
|---|---|---|
| Temperature (°C) | 8.8 | 1.2 |
[2]
(b) Describe the type of correlation shown in the scatter diagram. [1]
(c) By drawing a line of best fit, estimate the temperature at 1000 m. [2]
(d) Circle the outlier on the scatter diagram. [1]
(e) Explain why using the scatter diagram to estimate the temperature at 1800 m may be unreliable. [1]
(f) Find the percentage of the 15 temperatures which are below 6 °C. [3]
| Answer | Marks | Part marks and guidance | |
|---|---|---|---|
| 2 points accurately plotted | 2 | B1 for each | tolerance \(\pm \frac{1}{2}\) small square radially and ignore other plotted points |
| Answer | Marks | Part marks and guidance | |
|---|---|---|---|
| Negative | 1 | Ignore embellishments | |
| Answer | Marks | Part marks and guidance | |
|---|---|---|---|
| ruled straight line of best fit | B1 | Overlay is a guide only, their line must be between or through (500, 8) to (500, 10) and (1500, 1) to (1500, 3) and meeting both 500 and 1500 lines | |
| 5 − 6.5 | B1 | If B0 FT their ruled straight line of best fit with negative gradient and meeting both 500 and 1500 | |
| Answer | Marks | Part marks and guidance | |
|---|---|---|---|
| (1200, 9.2) indicated | 1 | Ignore points indicated as answers for parts (a), (c) and (f) | |
| Answer | Marks | Part marks and guidance | |
|---|---|---|---|
| Accept any correct explanation | 1 | see appendix | |
Appendix: exemplar responses for Q5(e)
| Response | Mark |
|---|---|
| It is too far away from the last piece of data | 1 |
| the recordings haven’t been taken since 1580m it would need another recording after 1800 to average | 1 |
| the last temperature recorded near 1800 is 1580 | 1 |
| there isn’t a temperature for 1700 so it suggests the experiment ended at 1580 | 1 |
| it could be below 0 | 1 |
| in the scatter diagram it doesn’t go over 1600 m | 1 |
| the data does not go up to that height | 1 |
| you do not have measurements for surrounding heights | 1 |
| graph only goes up to 1580 | 1 |
| answer would be negative | 1 |
| the reading goes off the graph | 1 |
| extrapolation goes beyond known data/1580 | 1 |
| the line of best fit would be off the graph | 1 |
| no values for temperatures under zero | 1 |
| the LOBF does not reach there | 0 |
| answer is not on the scale | 0 |
| the pattern may change when the temperature goes below zero | 0 |
| there isn’t a temperature for 1700 so it suggests that’s where the experiment ended | 0 |
| there is no information/data at that point | 0 |
| because it’s the last height and where the graph stops | 0 |
| its an estimate | 0 |
| there is no data | 0 |
| no points plotted at 1800 | 0 |
| there are no results of temperature for this given height 1800 | 0 |
| extrapolation (alone) | 0 |
| there isn’t enough evidence | 0 |
| there are no calculations on that day | 0 |
| there is no more temperature decrease after 1580 | 0 |
| Answer | Marks | Part marks and guidance | |
|---|---|---|---|
| 40 | 3 | B1 for 6 if 2 not scored in (a) FT their diagram | for B1 FT their diagram must not include a point for part (c) |
| M1 for \(\dfrac{6 \text{ or } \textit{their } 6}{15 \text{ or } \textit{their } 15}\) [× 100] | for M1 their 6 is their number of points under 6°C their 15 is the total number of plotted points (may include one for (c)) | ||
| M1 for correctly converting their fraction to a percentage (less than 100%) rounded or truncated | e.g. \(\frac{7}{15}\) = 46 or 47 or 46.6 to 46.7 | ||