
1MA0 Higher November 2013 Paper 1 Q2
2 A publisher checks documents for errors.
He records the number of documents that are checked each day.
He also records the total number of errors in the documents each day.
The scatter graph shows this information.
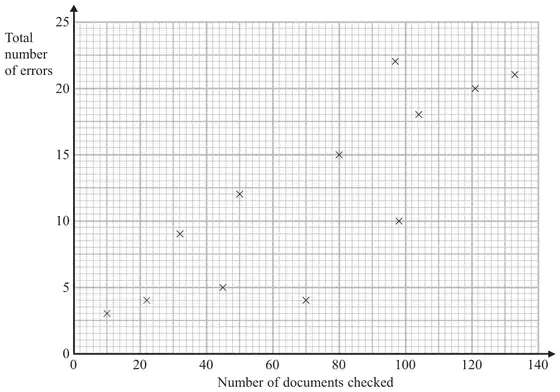
On another day 90 documents are checked.
There is a total of 17 errors.
(a) Show this information on the scatter graph. (1)
(b) Describe the correlation between the number of documents checked and the total number of errors. (1)
One day 110 documents are checked.
(c) Estimate the total number of errors in these documents. (2)
| Answer | Mark | Notes |
|---|---|---|
| Plot (90,17) | 1 | B1 cao |
| Answer | Mark | Notes |
|---|---|---|
| Positive | 1 | B1 Positive |
| Answer | Mark | Notes |
|---|---|---|
| In range 16 to 20 | 2 | M1 for a single straight line segment with positive gradient that could be used as a line of best fit or a vertical line from 110 or a point plotted at (110, \(y\)) where \(y\) is in the range 16 to 20 A1 for an answer in the range 16 to 20 inclusive |