
Foundation June 2018 Paper 3 Q19
19 The scatter diagram shows information about 12 girls.
It shows the age of each girl and the best time she takes to run 100 metres.
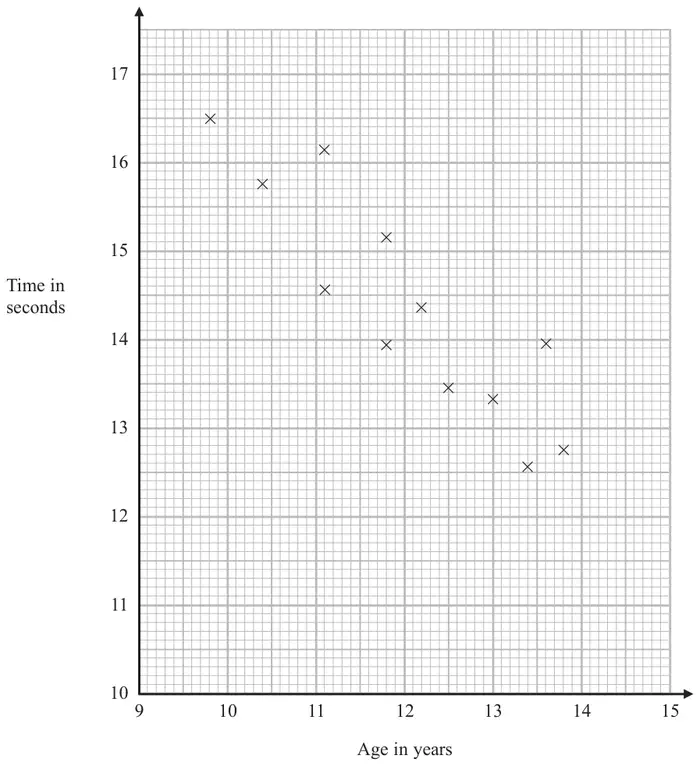
(a) Write down the type of correlation. (1)
Kristina is 11 years old.
Her best time to run 100 metres is 12 seconds.
The point representing this information would be an outlier on the scatter diagram.
(b) Explain why. (1)
Debbie is 15 years old.
Debbie says,
“The scatter diagram shows I should take less than 12 seconds to run 100 metres.”
(c) Comment on what Debbie says. (1)
| Answer | Mark | Mark scheme |
|---|---|---|
| negative | B1 | cao |
Additional guidance
Ignore any description of a relationship and any reference to strength of correlation
| Answer | Mark | Mark scheme |
|---|---|---|
| Explanation | C1 | for a correct explanation, eg “not in line with the trend of the other points” “does not fit in with the correlation” “is far away from the other points or line of best fit” |
| Answer | Mark | Mark scheme |
|---|---|---|
| Comment | C1 | for an explanation eg “point would be outside of the range of the scatter diagram” |