
Higher June 2022 Paper 3 Q3
3 Here are four scatter graphs.
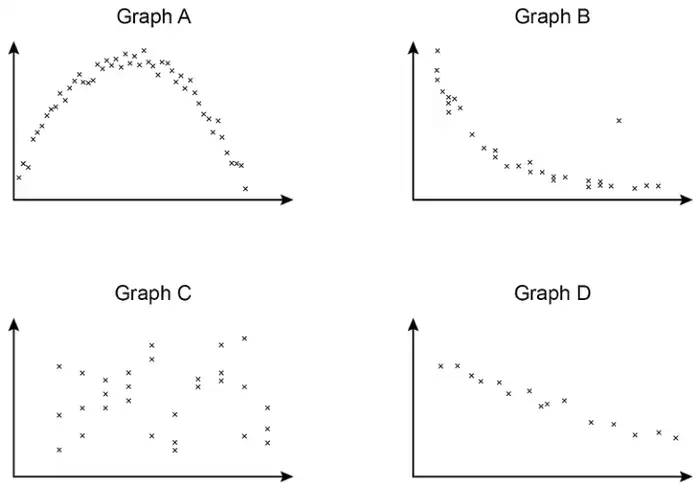
(a) For which graph is a straight line of best fit appropriate?
Circle your answer. [1 mark]
- A
- B
- C
- D
(b) Which graph has one outlier?
Circle your answer. [1 mark]
- A
- B
- C
- D
| Answer | Mark | Comments |
|---|---|---|
| D | B1 |
| Answer | Mark | Comments |
|---|---|---|
| B | B1 |