
1MA0 Foundation June 2017 Paper 2 Q25
25 The scatter graph shows information about ten trees of the same type.
It shows the age and the diameter of the trunk of each tree.
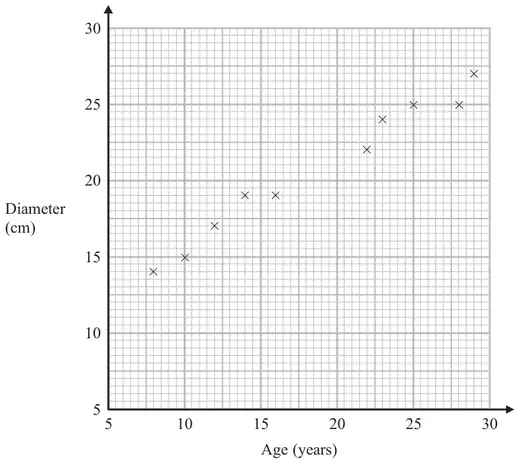
(a) What type of correlation does this scatter graph show? (1)
Another tree of the same type has a trunk with diameter 21 cm.
(b) Estimate the age of this tree. (2)
| Answer | Mark | Notes |
|---|---|---|
| positive | 1 | B1 cao |
| Answer | Mark | Notes |
|---|---|---|
| 17 – 21.5 | 2 | M1 for a single line segment with positive gradient that could be used as a line of best fit or a horizontal line from 21 or a point plotted at \((x, 21)\) where \(x\) is in the range 17 – 21.5 A1 for answer in range 17 – 21.5 |