
Higher November 2017 Paper 4 Q4
4 The scatter diagram shows the results of 17 students in their French test and their German test.
Both tests are out of 100.
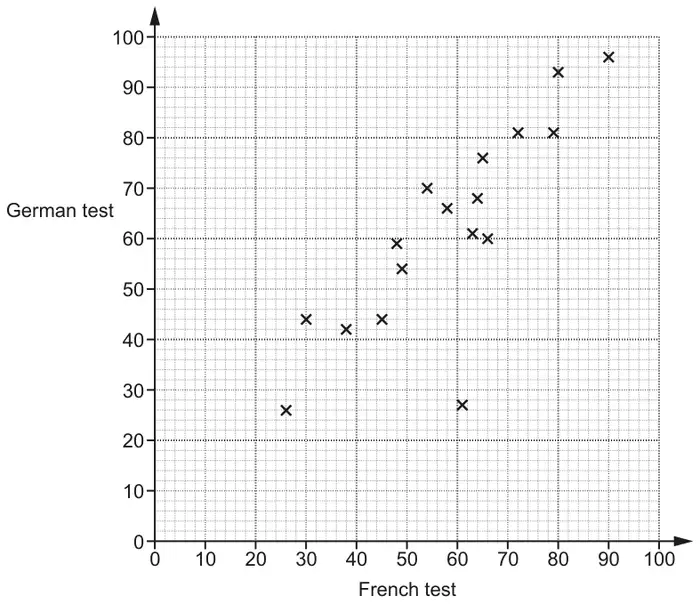
(a) Here are the results of another 4 students.
| French | 21 | 75 | 48 | 53 |
|---|---|---|---|---|
| German | 30 | 78 | 46 | 61 |
Plot these results on the scatter diagram. [2]
(b) Describe the type and strength of the correlation shown in this diagram. [2]
(c) Work out the percentage of the students whose German result was higher than their French result. [4]
| Answer | Marks | Part marks and guidance | |
|---|---|---|---|
| 4 points correctly plotted | 2 | B1 for 2 or 3 points correctly plotted | tolerance ± 1 mm |
| Answer | Marks | Part marks and guidance | |
|---|---|---|---|
| strong/good | 1 | ||
| positive | 1 | ||
| Answer | Marks | Part marks and guidance | |
|---|---|---|---|
| 71[.42…] to 71.4[3] nfww | 4 | B1 for 21 B1 for 15 M1 for (their15)÷21×100 oe If 0 scored SC1 for line ‘\(y = x\)’ drawn or if no points plotted in (a) SC1 for \(\frac{12}{17}\) | 21 from 17 + 4 FT their diagram |