
Foundation November 2020 Paper 1 Q20
20 A and B are scatter graphs.
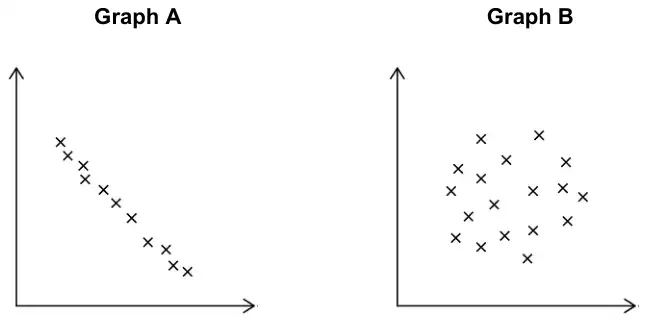
What type of correlation is shown by each graph?
Choose from
| Weak positive Strong positive Weak negative Strong negative No correlation |
[2 marks]
| Answer | Mark | Comments |
|---|---|---|
| Graph A Strong negative | B1 | |
| Graph B No correlation | B1 | allow ‘No’ or ‘None’ |
Additional guidance
Condone incorrect spelling if intention is clear
Allow clear link(s) from the table to the answer line
eg an arrow from ‘Strong negative’ to the Graph A answer line