
Foundation November 2019 Paper 2 Q25
25 The scatter graph shows the best high jump and the best long jump for 15 boys.
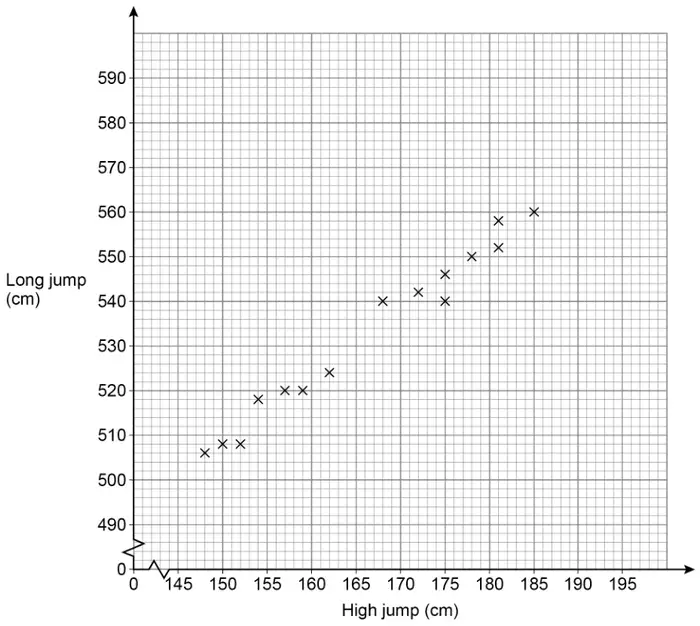
(a) Write down the type of correlation shown. [1 mark]
(b) Liam has a best high jump of 166 cm
Use a line of best fit to estimate his best long jump. [2 marks]
(c) Another boy has a best high jump of 195 cm
Give a reason why you should not use a line of best fit to estimate his best long jump. [1 mark]
| Answer | Mark | Comments |
|---|---|---|
| Positive | B1 | accept +ve or + |
Additional guidance
| Ignore any reference to the strength of the correlation | |
| As one jump increases so does the other so positive | B1 |
| As one jump increases so does the other | B0 |
| Answer | Mark | Comments |
|---|---|---|
| Straight line of best fit passing through (150, [504, 512]) and (180, [550, 558]) | B1 | accept if clear intention to draw a straight line ignore anything either side of the gates |
| Correct reading \(\pm\dfrac{1}{2}\) square for their straight line of best fit | B1ft | ft straight line with positive gradient accept if clear intention to draw a straight line ignore any working lines on the graph |
Additional guidance
| No line of best fit | B0B0ft |
| Short straight line with positive gradient and correct reading \(\pm\dfrac{1}{2}\) square for their line | B0B1ft |
| Two lines of best fit, mark the line that leads to their answer | |
| Two lines of best fit, no answer, apply the usual rules of choice |
| Answer | Mark | Comments |
|---|---|---|
| Valid reason | B1 | eg 195 cm is outside the range of values or cannot extrapolate |
Additional guidance
| Allow ‘195’ or ‘his jump’ or ‘it’ to represent 195 cm | |
| B1 responses - do not allow points/data/plots/results to be replaced by graph or line | |
| 195 exceeds the data | B1 |
| It is beyond/outside the data | B1 |
| 195 is higher than 185 | B1 |
| Nobody else jumped that high | B1 |
| His jump is more than the others | B1 |
| The correlation stops at 560 | B1 |
| All the other points/data/plots/results are less than 195 | B1 |
| The points/data/plots/results don’t reach 195 | B1 |
| The points/data/plots/results don’t reach that far | B1 |
| The points/data/plots/results stop at 185 | B1 |
| The pattern/trend/correlation may change after the points/data/plots/results | B1 |
| The pattern/trend/correlation may change | B0 |
| It doesn’t fit the pattern/trend/correlation | B0 |
| Line is not long enough | B0 |
| No points at/near/around/close to 195 | B0 |
| 195 is anomalous or 195 is an outlier | B0 |
| Not enough data | B0 |
| This data is not on the graph | B0 |
| It is too different to the other points | B0 |
| Ignore extra statements that do not contradict a valid reason |