
Foundation June 2018 Paper 1 Q15
15 Lee wishes to find out if there is a relationship between a person’s age and the time it takes them to complete a puzzle.
Lee decides to conduct an experiment.
She asks 12 people to complete the puzzle.
She records each person’s age and the time taken to complete the puzzle.
(a) Make one criticism of Lee’s method. [1]
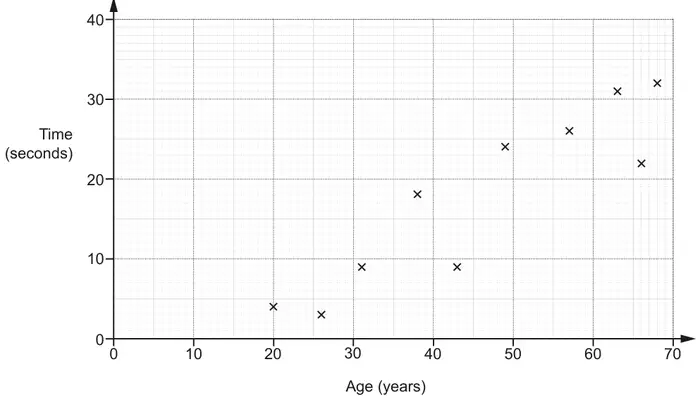
This scatter diagram shows the results for ten of the people in Lee’s experiment.
(b) Here are the other two results.
| Age (years) | 47 | 60 |
| Time (seconds) | 21 | 34 |
Plot these results on the scatter diagram. [2]
(c) What type of correlation is shown in the scatter diagram? [1]
(d) Estimate the time it would take a person aged 35 to complete the puzzle.
Show your working to justify your answer. [2]
Show your working to justify your answer. [2]
(e) Lee says that at least 80% of the 12 people completed the puzzle in under 30 seconds.
Is Lee correct?
Show working to support your answer. [3]
| Answer | Marks | Part marks and guidance | |
|---|---|---|---|
| accept any correct explanation e.g. sample size is small, no mention of subjects being randomly selected | 1 | If more than one choose the best one see list of exemplars | |
| Answer | Marks | Part marks and guidance | |
|---|---|---|---|
| two points accurately plotted | 2 | B1 for each | tolerance \(\pm\frac{1}{2}\) small square and use overlay as a guide |
| Answer | Marks | Part marks and guidance | |
|---|---|---|---|
| positive | 1 | ignore any extras e.g. strong | |
| Answer | Marks | Part marks and guidance | |
|---|---|---|---|
| a line or a mark between (35,9) and (35,15) | 1 | use overlay as a guide, a clear indication of method to find their answer | |
| 9 to 15 | 1 | ||
| Answer | Marks | Part marks and guidance | |
|---|---|---|---|
| 9 soi | B1 | 9 can be implied by 75 | |
| For putting their 9 out of 12 into a percentage oe e.g. 9 in 12 or \(\dfrac{9}{12}\) [=] 75[%] | M1 | Accept any correct reasoning e.g. M1 for 0.80 \(\times\) 12 or 9.6 | Accept fractions or decimals providing the two figures can be compared |
| A correct conclusion from their 9 e.g. “No/She is wrong” | A1FT | A1FT for a correct conclusion from their 9 e.g. “No/She is wrong” If no points plotted in (b) award M1 for 8 [out of 10] = 80[%] and A1 for “Yes” | FT their percentage or figure |