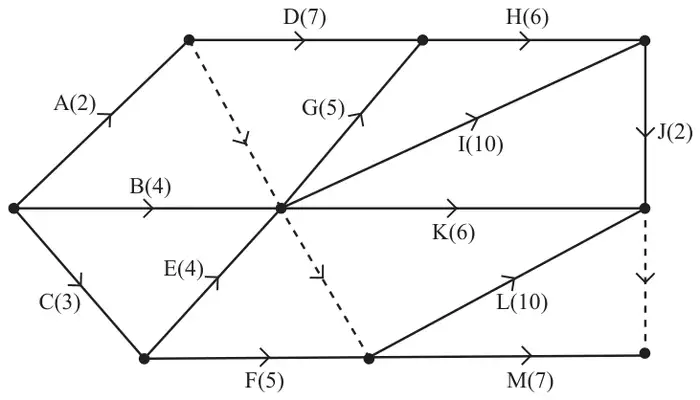
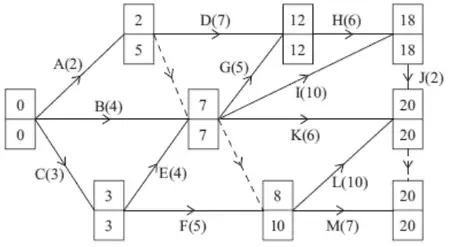
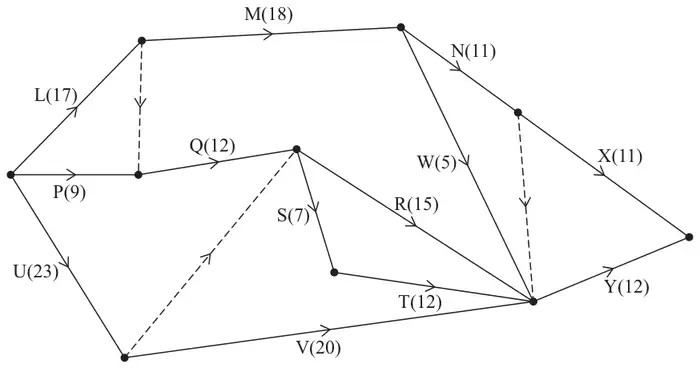
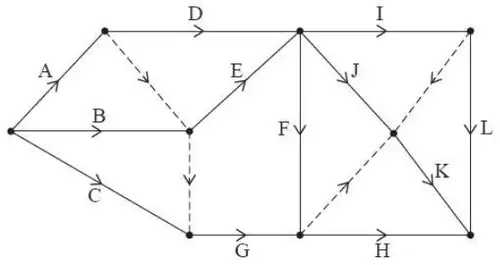
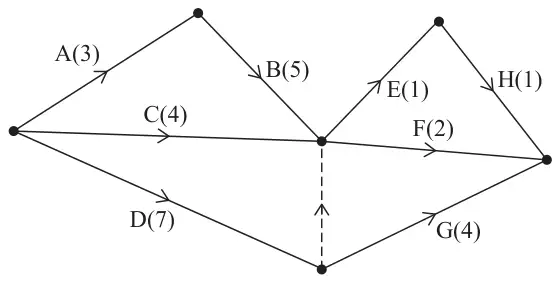
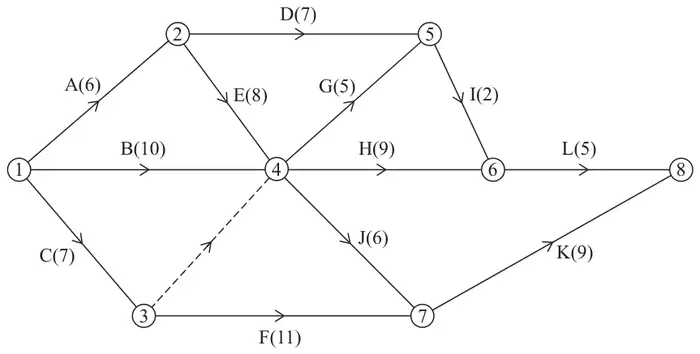
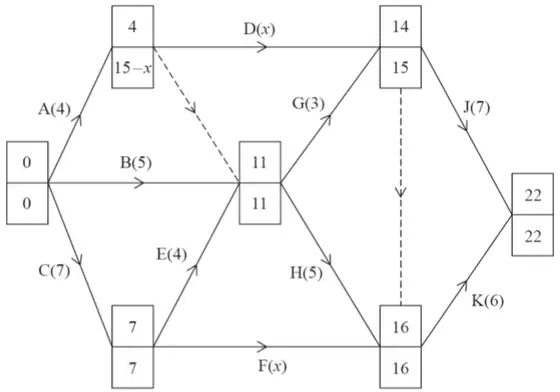
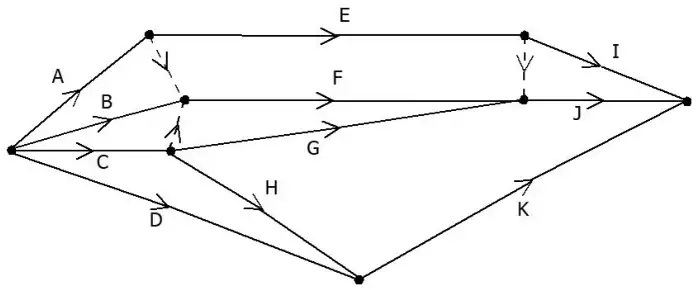
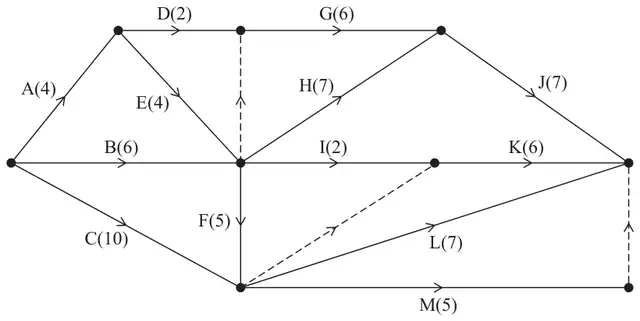
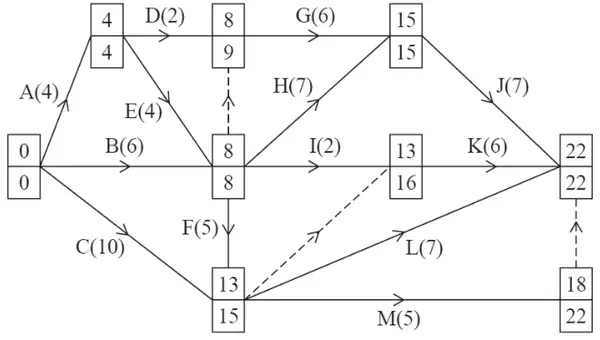
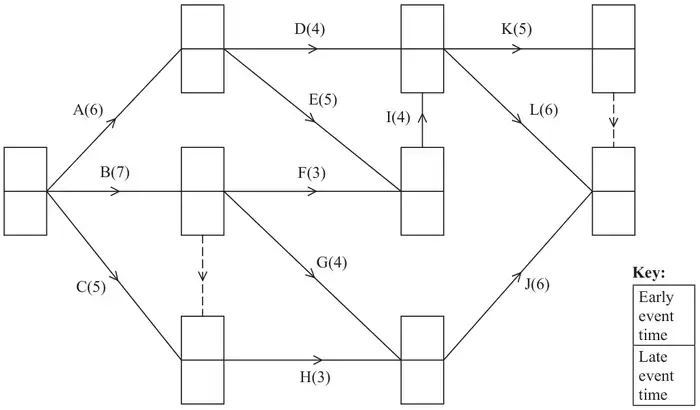
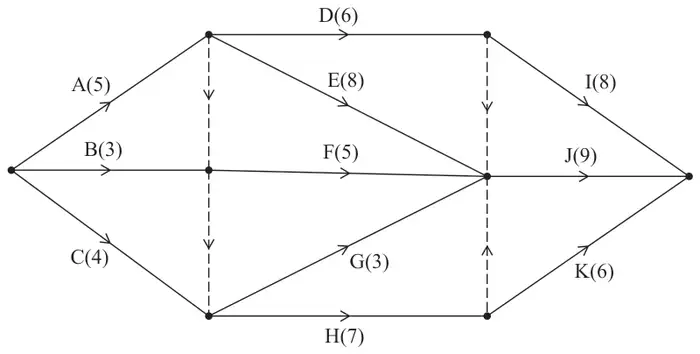
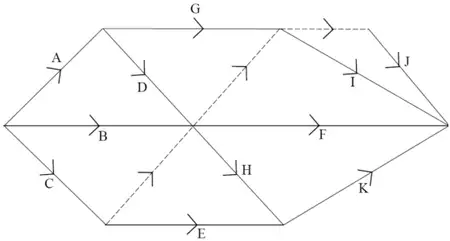
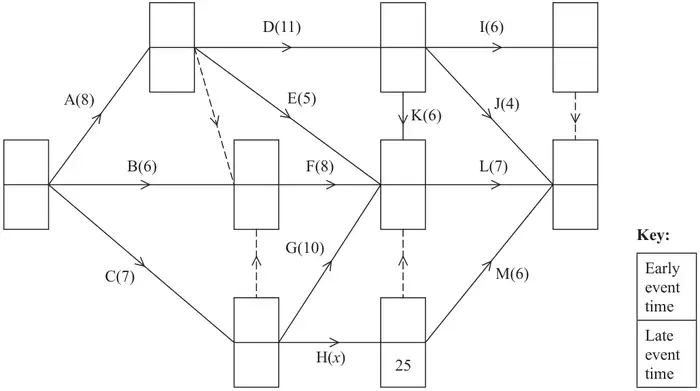
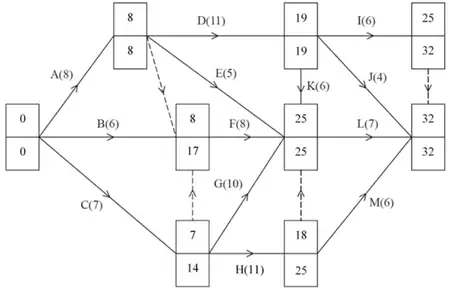
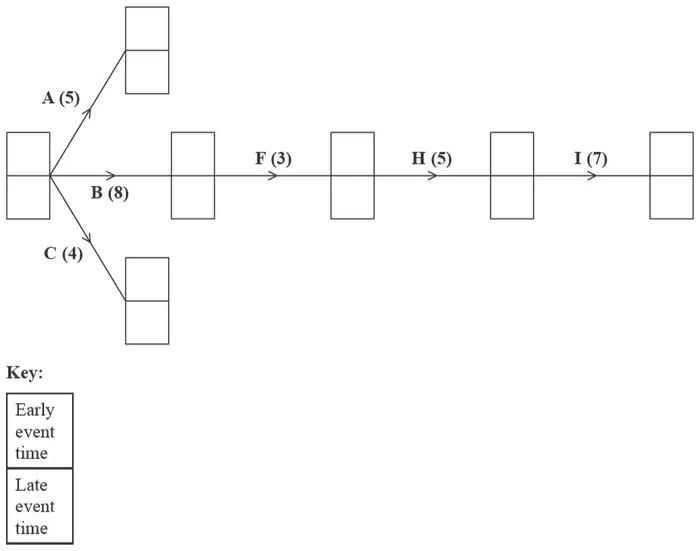
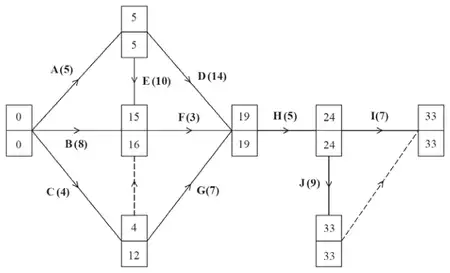
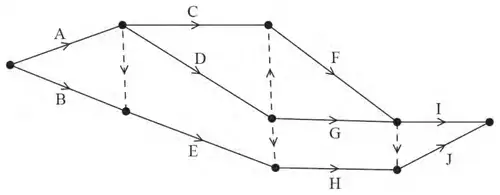
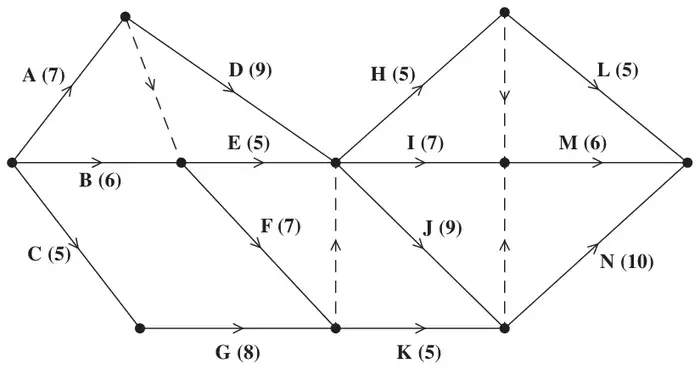
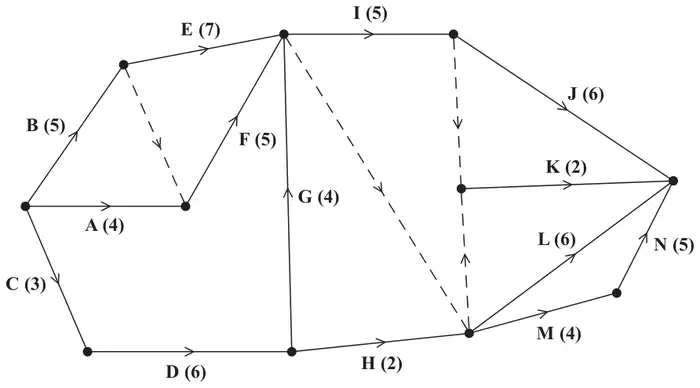
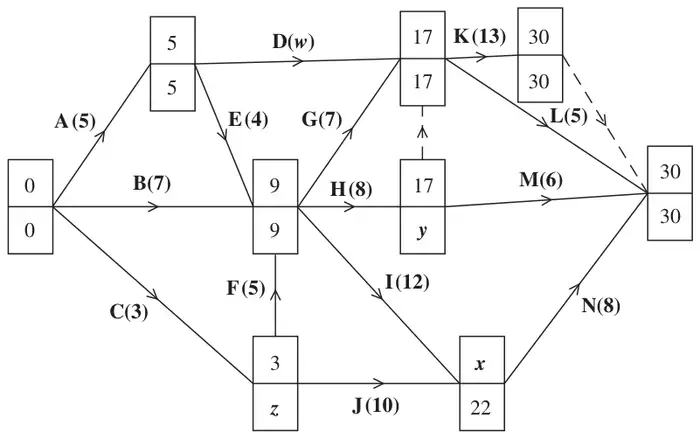
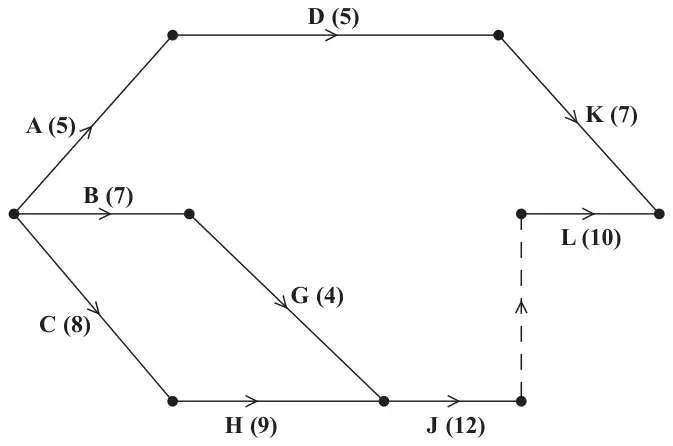
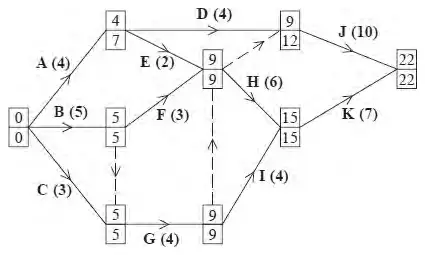
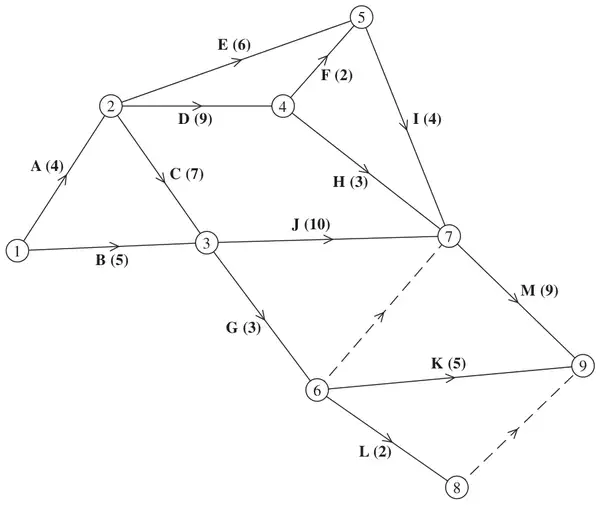
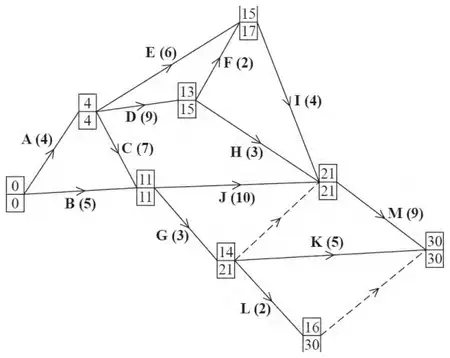
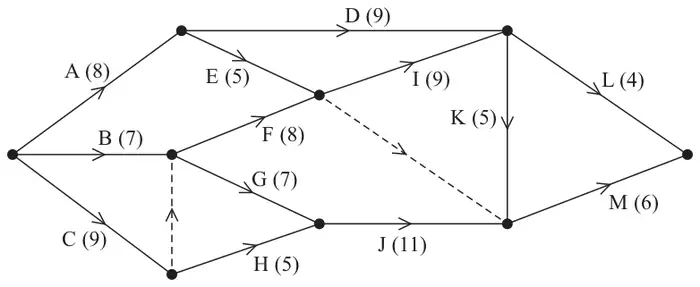
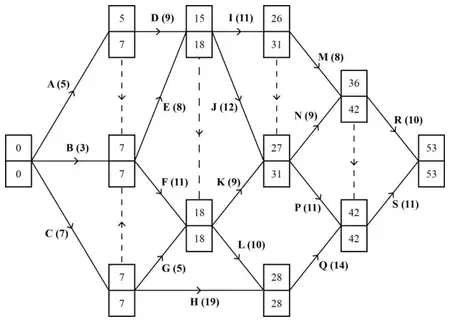
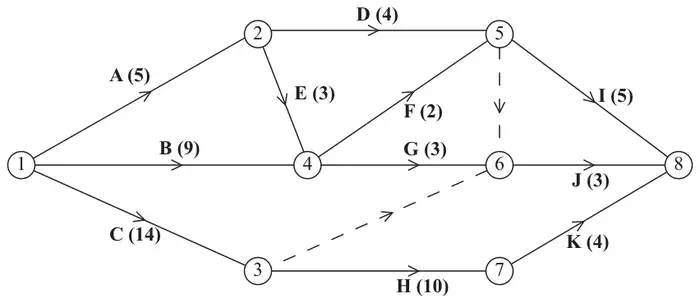
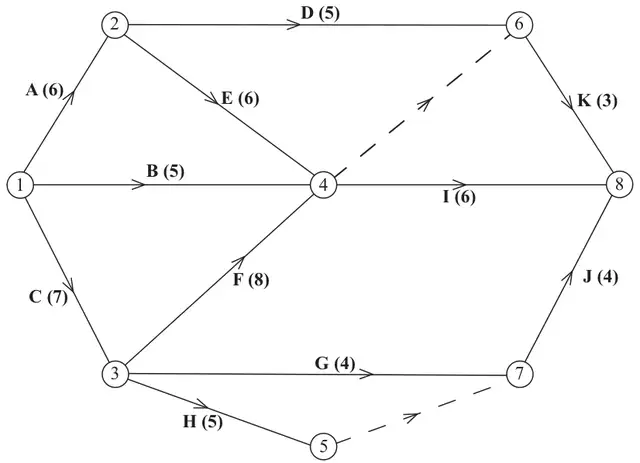
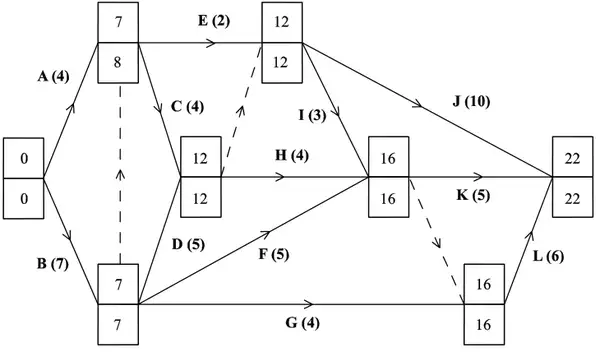
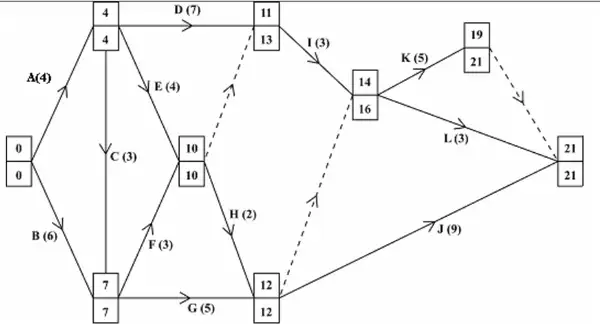
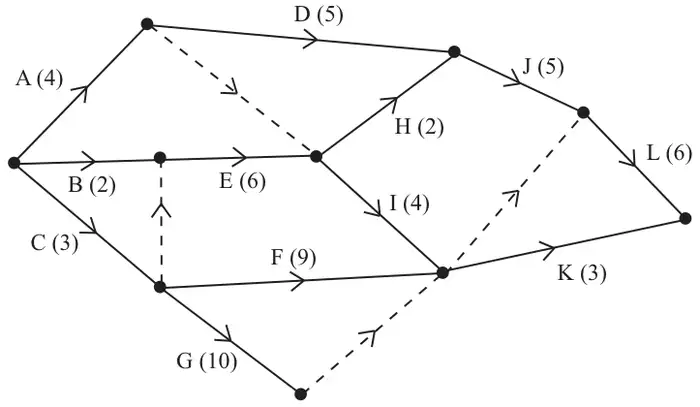
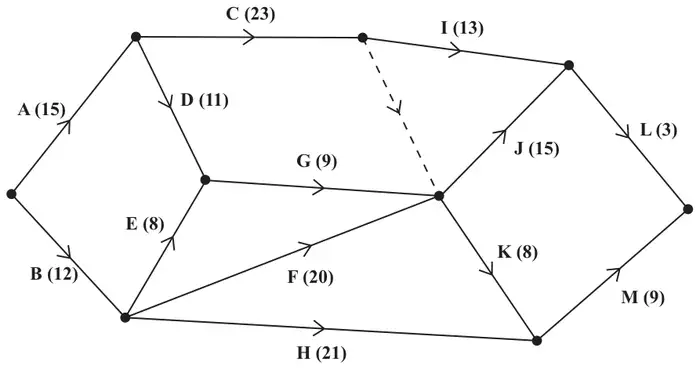
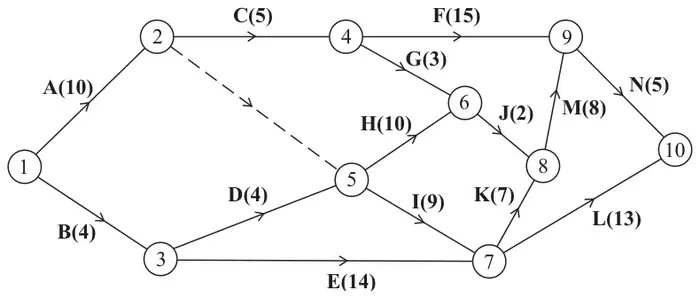
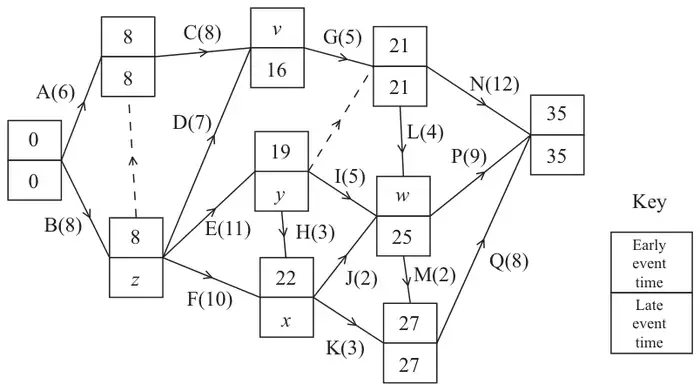
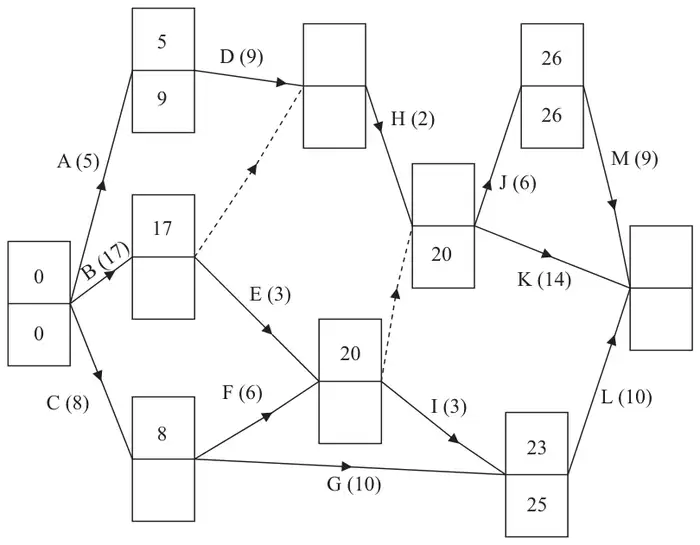
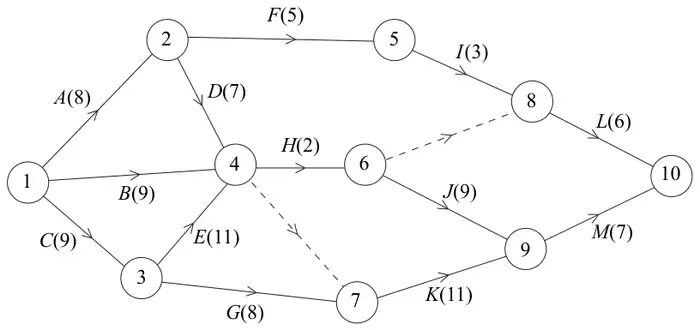
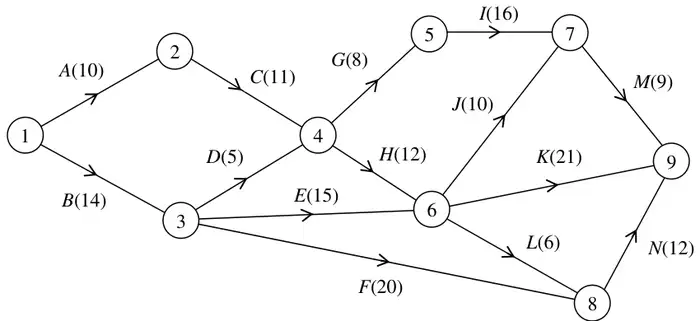
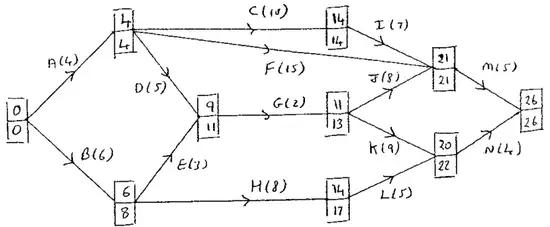
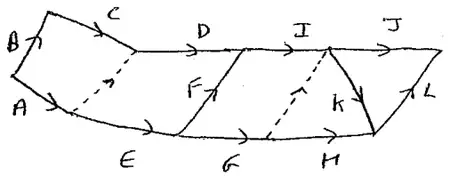
A project is modelled by the activity network shown in Figure 3. The activities are represented by the arcs. The number in brackets on each arc gives the time, in hours, to complete the corresponding activity. The project is to be completed in the shortest possible time.
(a) Complete Table 1 in the answer book to show the immediately preceding activities for each activity. (2)
Activity
Immediately preceding activities
Activity
Immediately preceding activities
A
G
B
H
C
I
D
J
E
K
F
L
M
Table 1
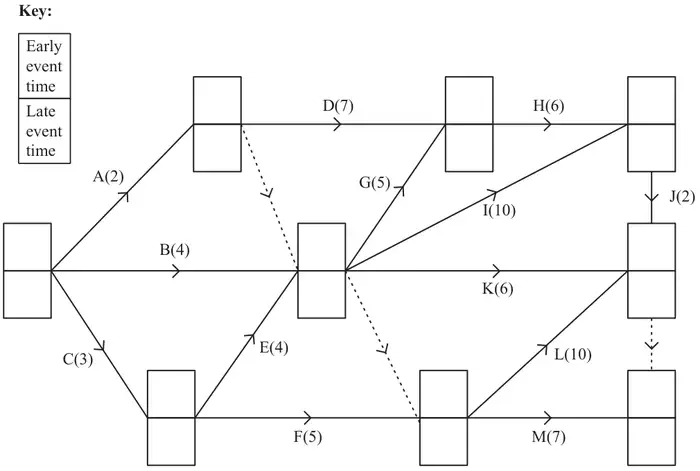
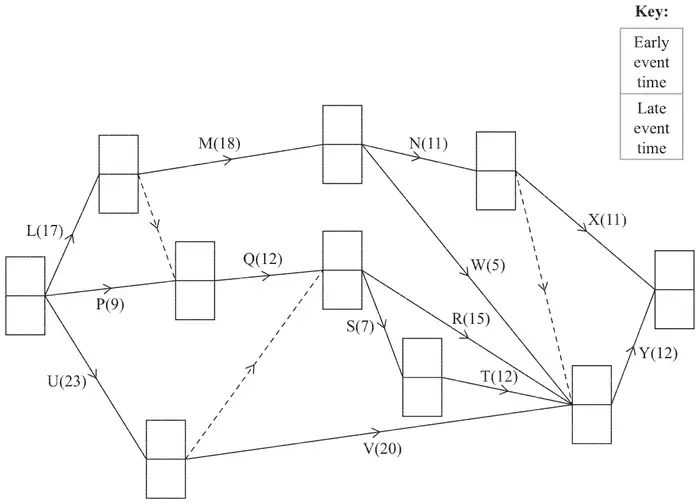
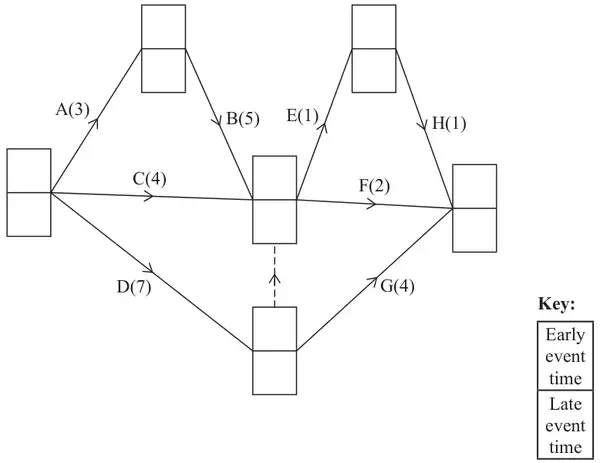
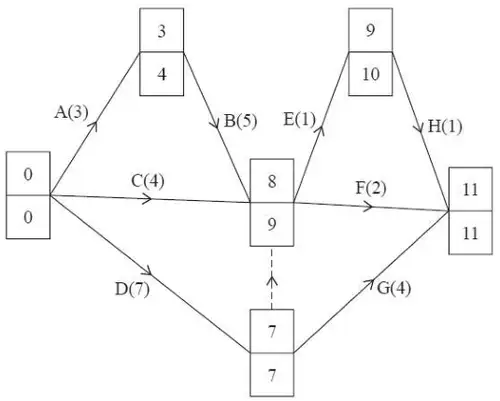
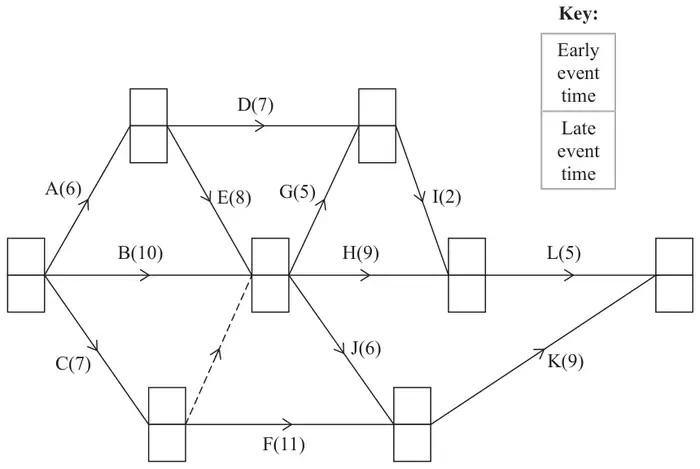
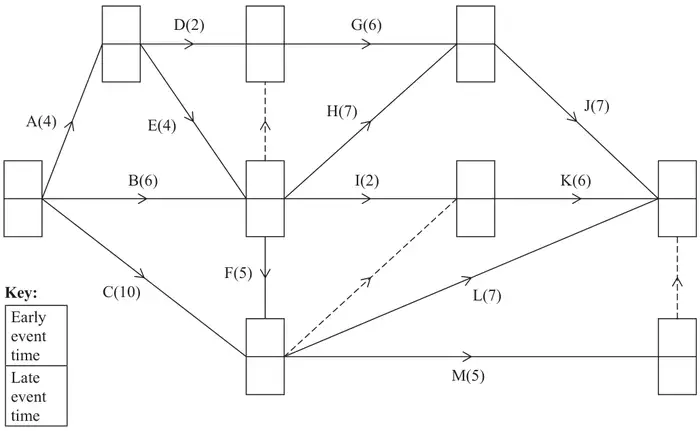
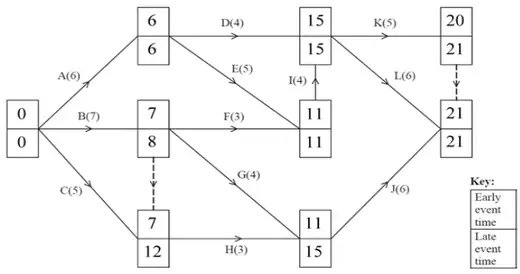
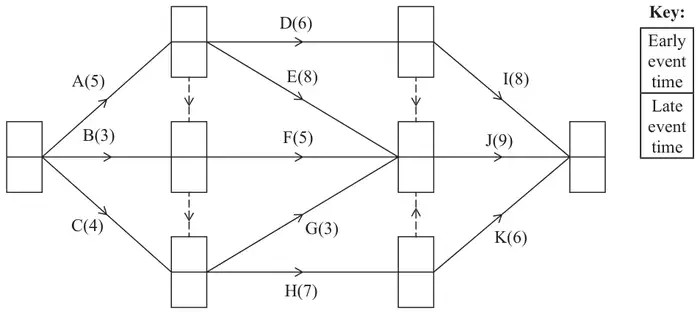
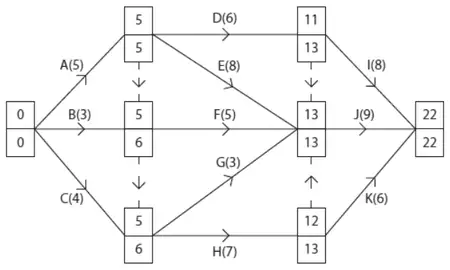
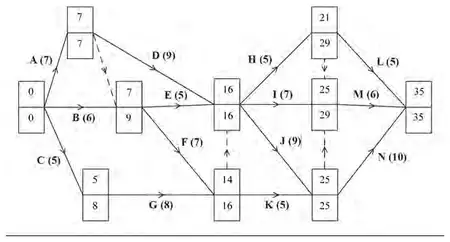
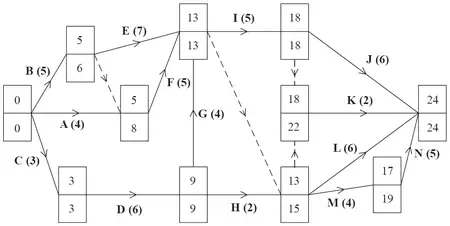
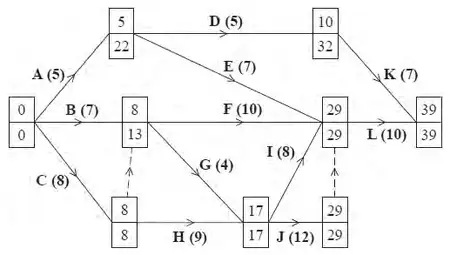
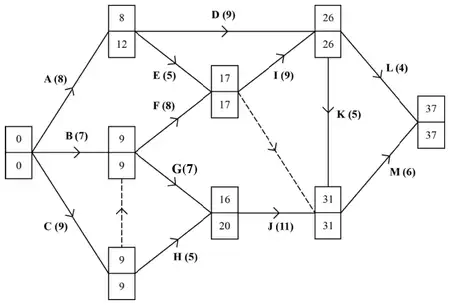
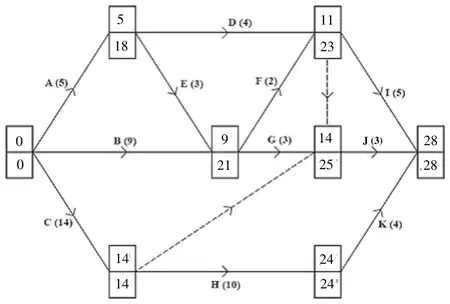
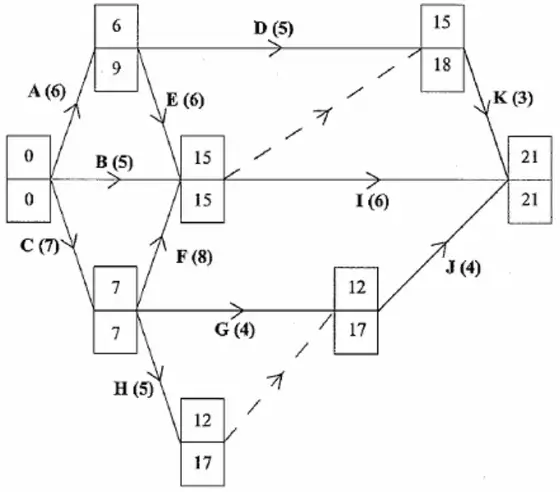
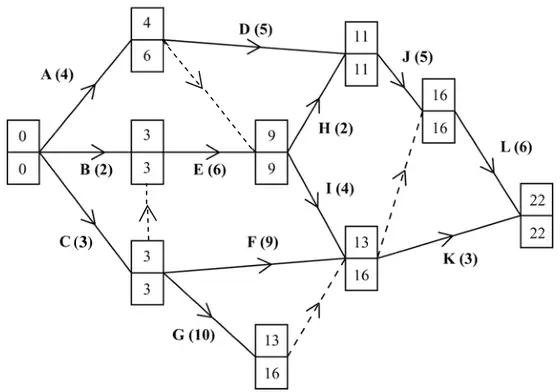
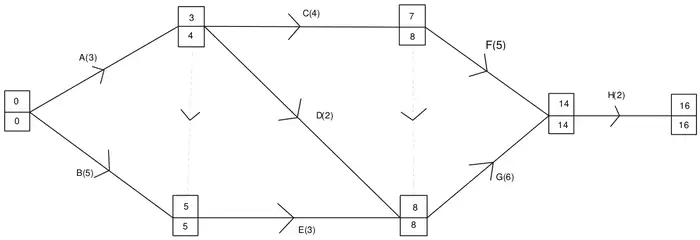
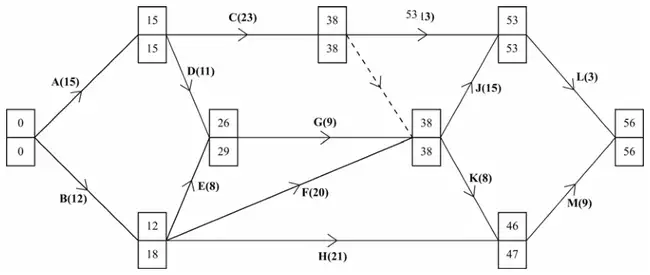
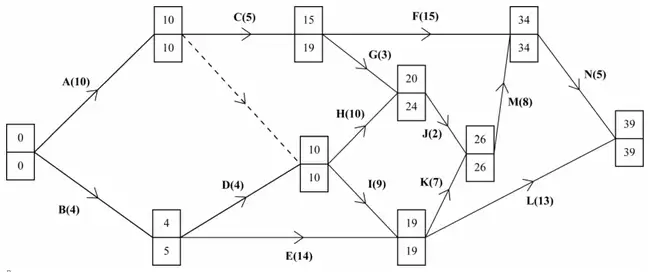
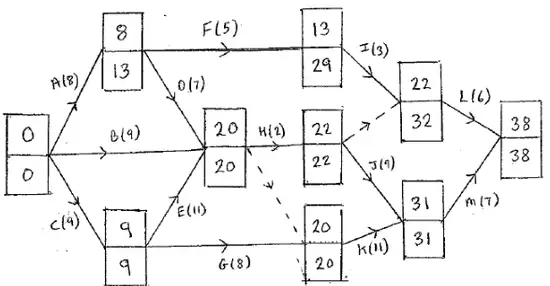
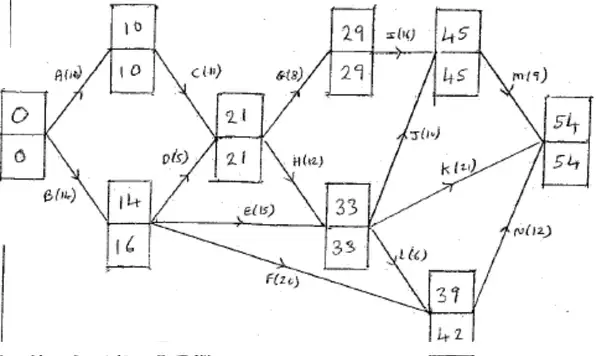
(b) Complete Diagram 1 in the answer book to show the early event times and the late event times. (4)
Diagram 1
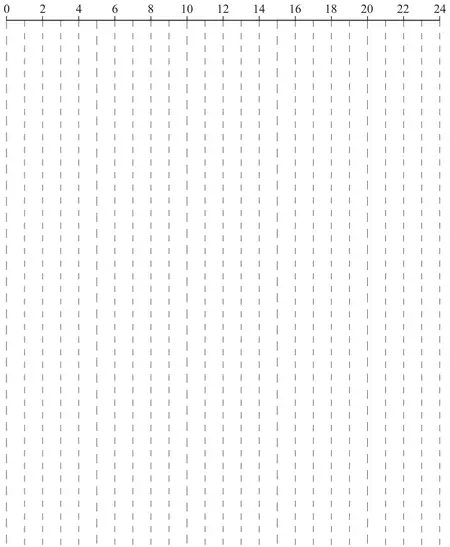
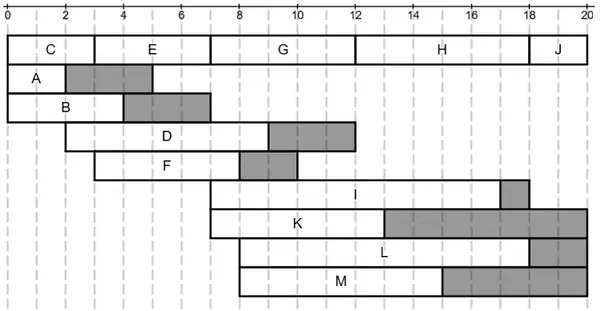
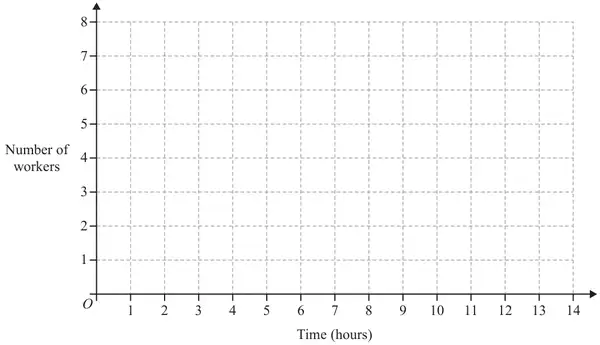
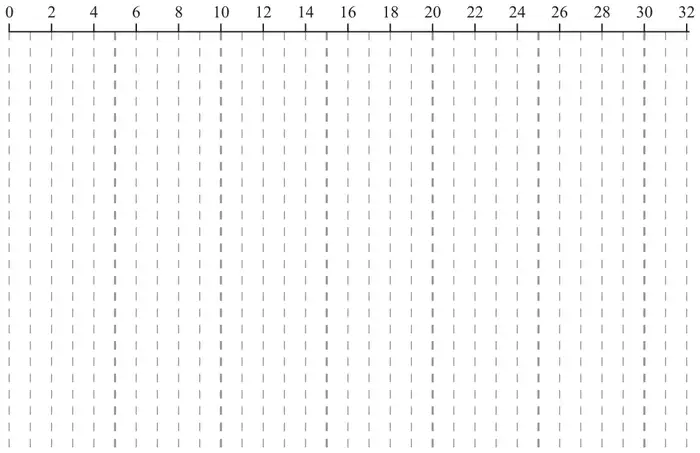
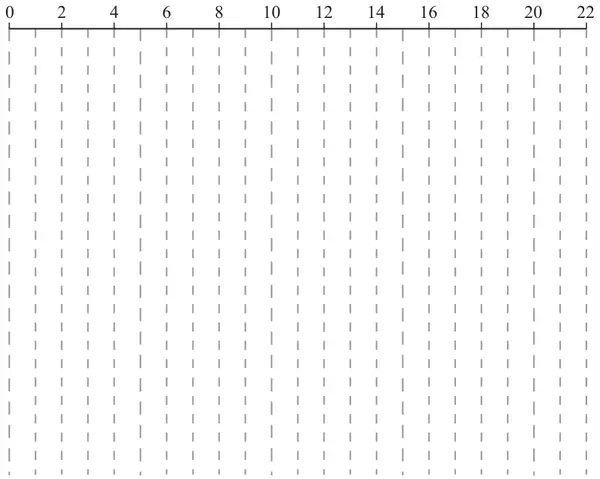
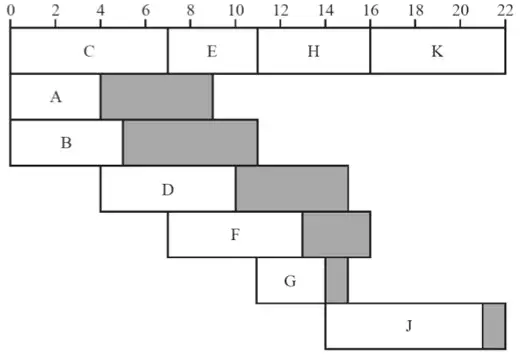
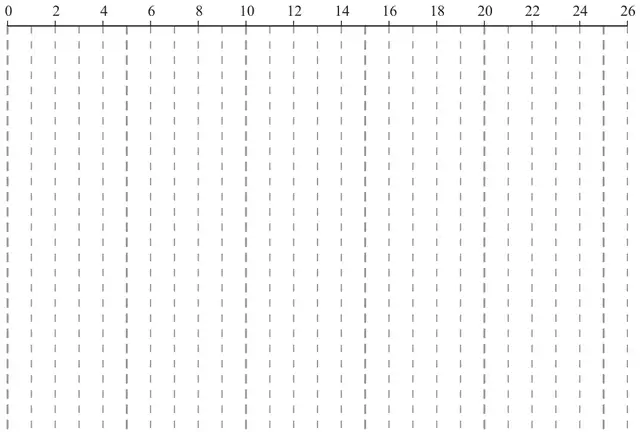
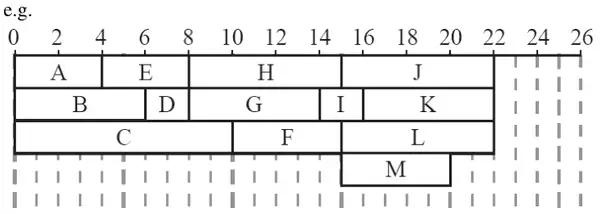
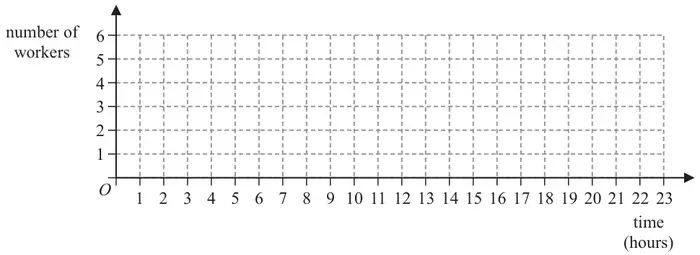
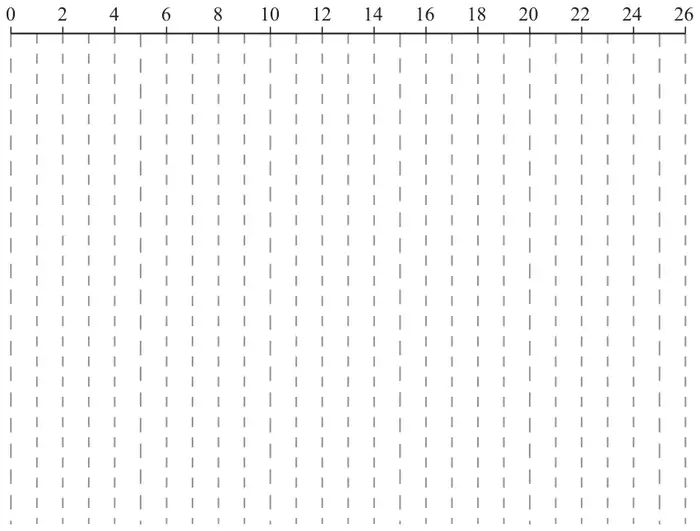
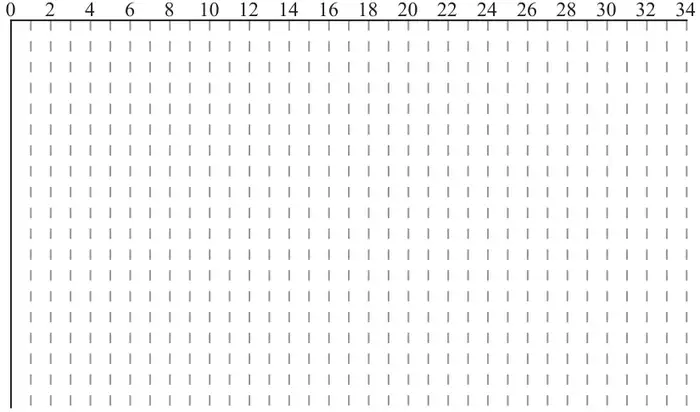
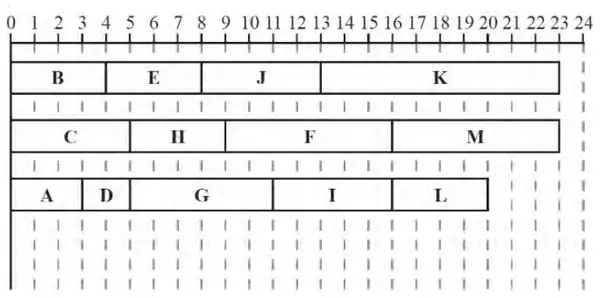
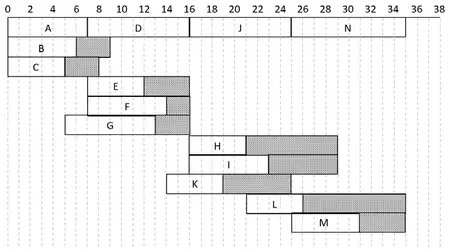
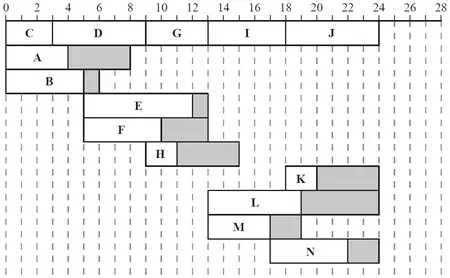
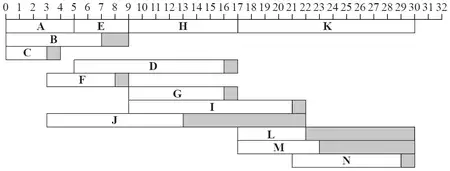
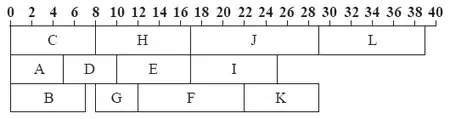
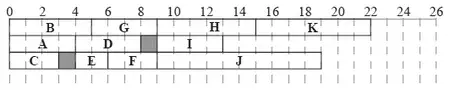
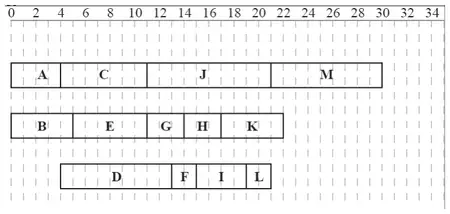
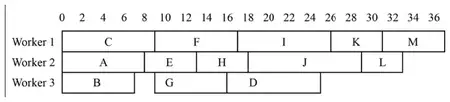
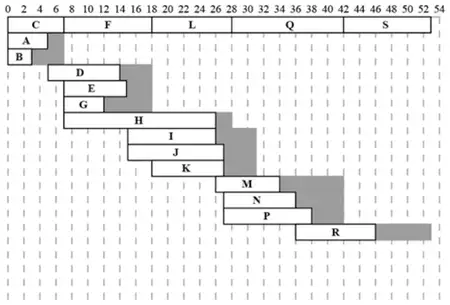
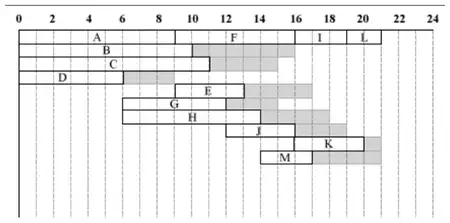
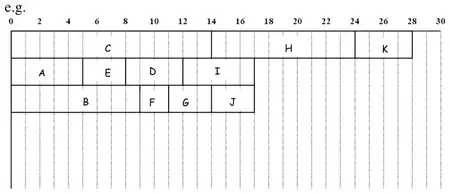
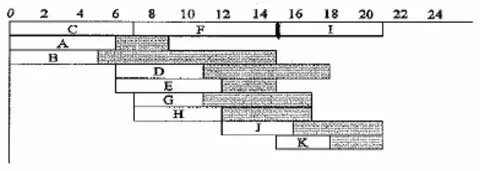
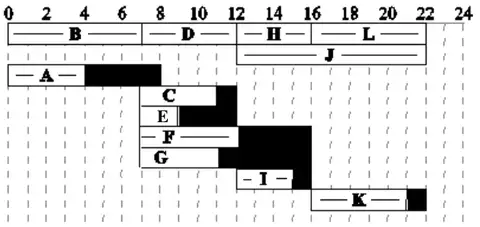
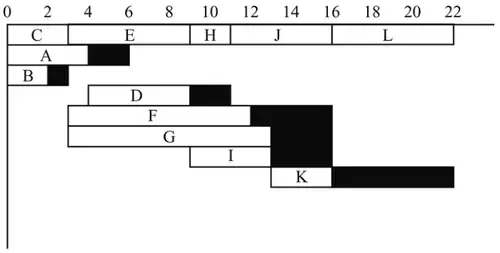
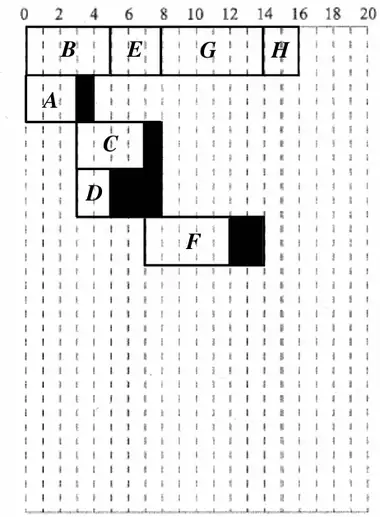
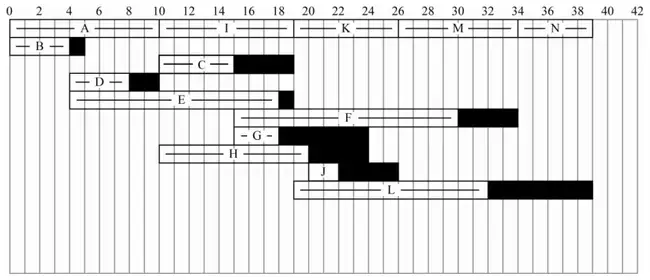
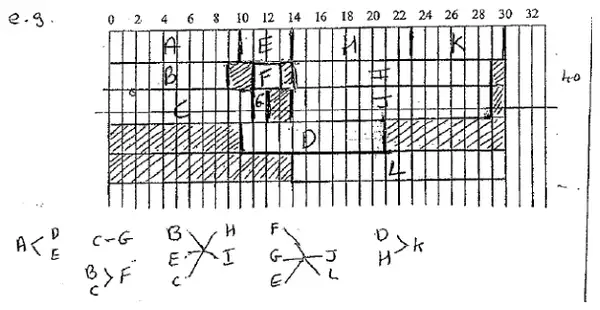
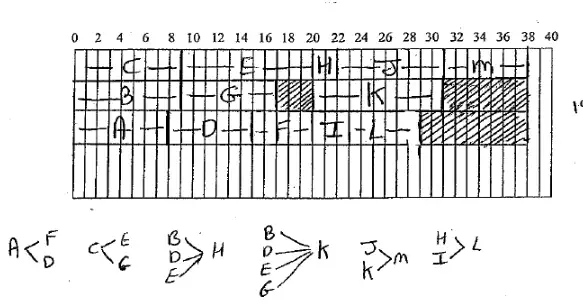
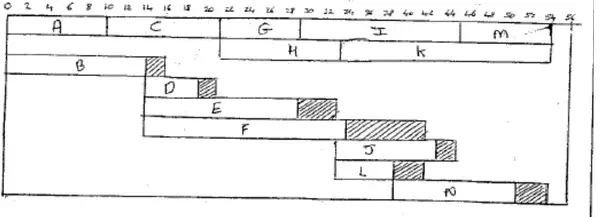
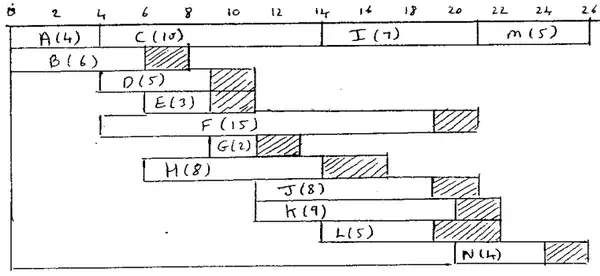
(c) Draw a Gantt chart for this project on Grid 1 in the answer book. (4)
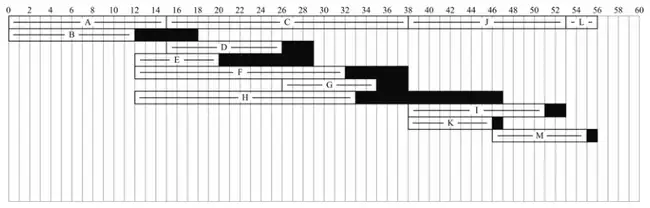
Grid 1Figure 4
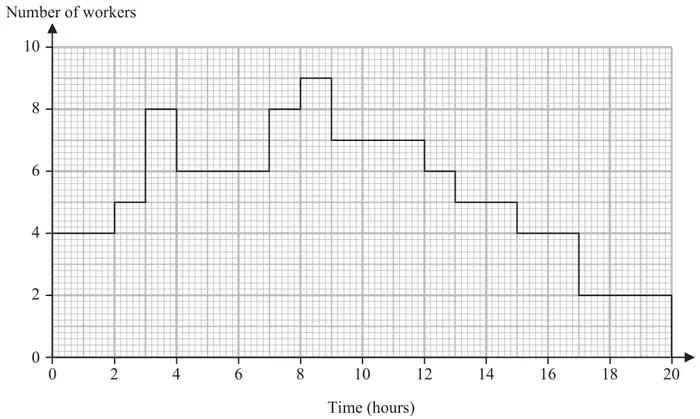
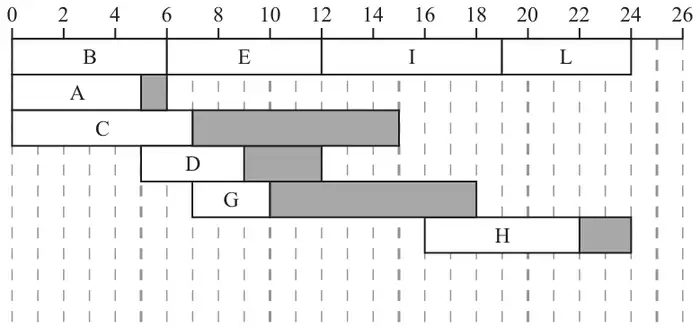
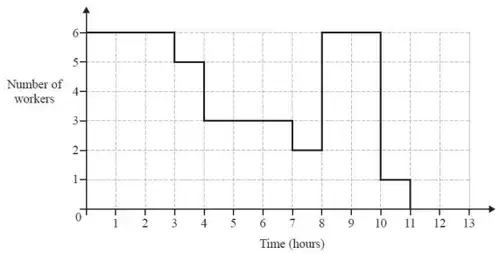
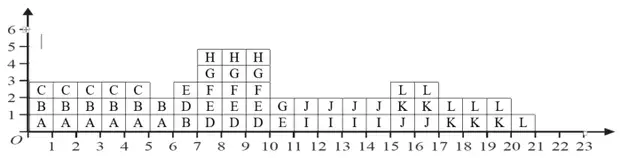
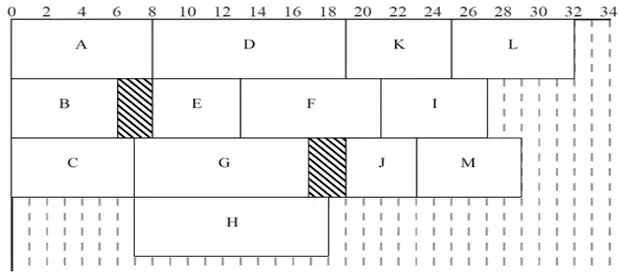
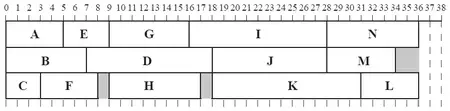
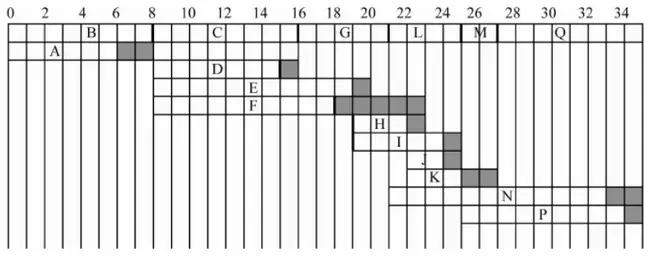
The resource histogram in Figure 4 shows the number of workers required when each activity starts at its earliest possible time. When an activity is started it must be completed without interruption. Each activity requires at least one worker.
(d) By considering which activities are happening each hour, and by working backwards from the minimum project completion time, complete Table 2 in the answer book to show the number of workers needed for each activity. (3)
Activity
Number of Workers
Activity
Number of Workers
A
G
B
H
C
I
D
J
E
K
F
L
M
Table 2
Mark scheme (a)
Scheme
Marks
AO
Activity
IPA
Activity
IPA
A
-
G
A, B, E
B
-
H
D, G
C
-
I
A, B, E
D
A
J
H, I
E
C
K
A, B, E
F
C
L
A, B, E, F
M
A, B, E, F
B1 B1
1.1b 1.1b
(2)
Notes
a1B1: Five correct rows (not including A, B and C)
a2B1: All rows correct (accept blanks for A, B and C)
Mark scheme (b)
Scheme
Marks
AO
M1 A1 M1 A1
1.1b 1.1b 1.1b 1.1b
(4)
Notes
b1M1:All top boxes complete, values generally increasing in the direction of the arrows (‘left to right’), condone one rogue value which is a number in a top box greater than the subsequent value
b1A1: CAO – top boxes
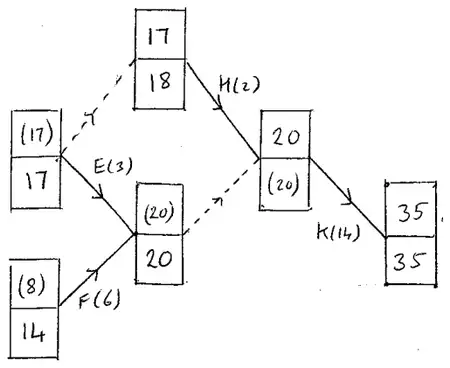
b2M1:All bottom boxes complete, values generally decreasing in the opposite direction of the arrows (‘right to left’), condone one rogue value which is a number in a bottom box greater than the previous value. Condone missing 0 and/or their 20 (at the end event) for the M mark only
b2A1: CAO – bottom boxes
Mark scheme (c)
Scheme
Marks
AO
M1 A1 A1 A1
2.1 1.1b 1.1b 1.1b
(4)
Notes
c1M1: Gantt (cascade) chart with at least 9 activities labelled and at least four activities having non-zero float. A scheduling diagram scores M0
c1A1: Critical activities (C, E, G, H and J) correct (note this may be seen as separate activities listed alphabetically instead of at the top of the chart)
c2A1: At least 4 non-critical activities correct
c3A1: CAO All 13 activities present (just once). No errors.
For reference these are the early start, late end and length of float for the non-critical activities
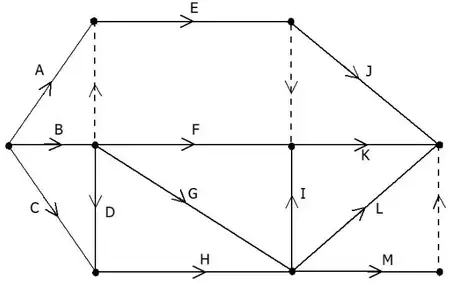
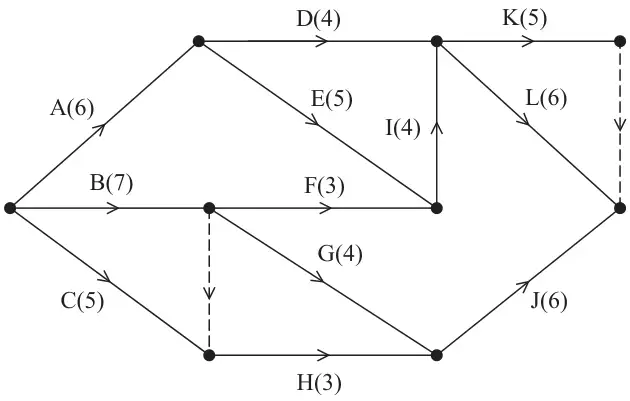
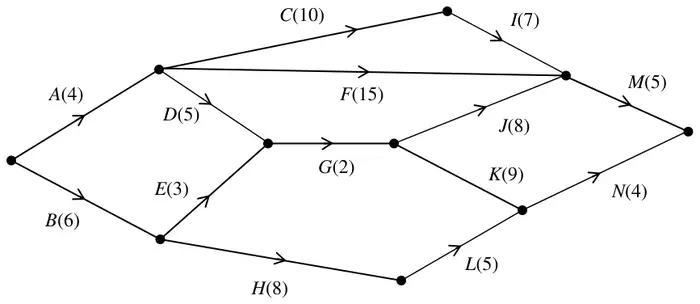
(a) Explain how you can deduce from the precedence table that at least one dummy will be needed when drawing the activity network. Your explanation should refer to specific activities. (1)
(b) Draw the activity network described in the precedence table, using activity on arc. Your activity network must contain the minimum number of dummies only. (5)
Each activity in the precedence table takes 3 hours to complete.
(c) State the minimum completion time. (1)
One of the activities now needs to be chosen to be extended by an hour. When the change is made the minimum completion time must not be affected.
(d) List the activities that could be chosen. (1)
Mark scheme (a)
Scheme
Marks
AO
e.g. Activity D (or F or G) is preceded by activity B only, but activity E is preceded by both activity A and activity B.
B1
2.4
(1)
Notes
a1B1: e.g. Reference to D (or F or G) is preceded by B only, E depends on both A and B (oe). Reference to J is preceded by E only, K depends on E and F and/or I L and M have the same start node and finish node
Mark scheme (b)
Scheme
Marks
AO
M1 A1 (ABCDE) A1 (FGHJ) A1 (IKLM) A1
1.1b 1.1b
1.1b
1.1b
1.1b
(5)
Notes
Condone lack of, or incorrect, numbered events throughout. ‘Dealt with correctly’ means that the activity starts from the correct event but need not necessarily finish at the correct event e.g. ‘K dealt with correctly’ requires the correct precedences for this activity, i.e. E, F and I labelled correctly and leading into the same node and K starting from that node but do not consider the end event for K. Activity on node is M0
If an arc is not labelled, for example, if the arc for activity E is not labelled (but the arc is present) then this will lose the first A mark and the final (CSO) A mark – they can still earn the second A mark on the bod. If two or more arcs are not labelled then mark according to the scheme. Assume that a solid line is an activity which has not been labelled rather than a dummy (even if in the correct place for where a dummy should be). Ignore incorrect or lack of arrows on the activities for the first four marks only
b1M1: At least eight activities labelled on arc, one start and at least two dummies placed.
b1A1: Activities A, B, C, D and E dealt with correctly and first dummy (from end B to end A) and arrow dealt with correctly.
b2A1: Activities F, G, H and J dealt with correctly and “second” dummy (from end E to end F) and arrow dealt with correctly.
b3A1: Activities I, K, L and M and “final” dummy and arrow dealt with correctly.
b4A1: CSO All arrows present and correctly placed with one finish, no additional dummies and no additional activities.
Please check all arcs carefully for arrows – if there are no arrows on any dummies then M1 only.
Note that additional (but unnecessary) ‘correct’ dummies that still maintain precedence for the network should only be penalised with the final A mark if earned. Note that this answer is not unique (e.g. L and M are interchangeable or this dummy could be at the start of M)
6. The precedence table below shows the 12 activities required to complete a project.
Activity
Immediately preceding activities
A
–
B
–
C
–
D
A
E
A, B, C
F
A, B, C
G
C
H
D, E
I
D, E
J
D, E
K
F, G, J
L
F, G
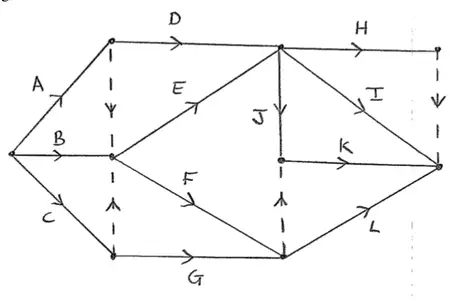
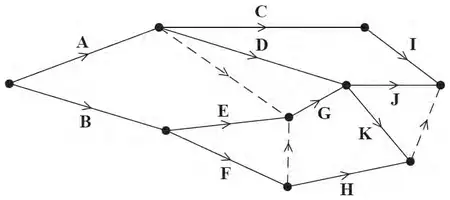
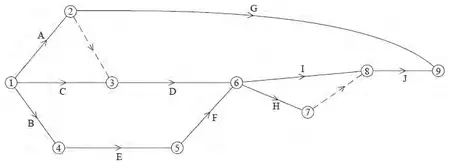
(a) Draw the activity network described in the precedence table, using activity on arc. Your activity network must contain the minimum number of dummies only. (5)
Each of the activities shown in the precedence table requires one worker. The project is to be completed in the minimum possible time.
Figure 3
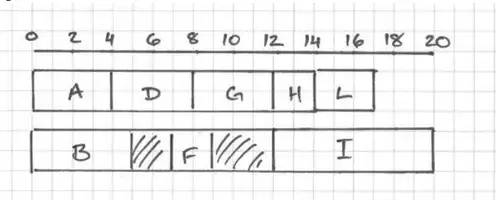
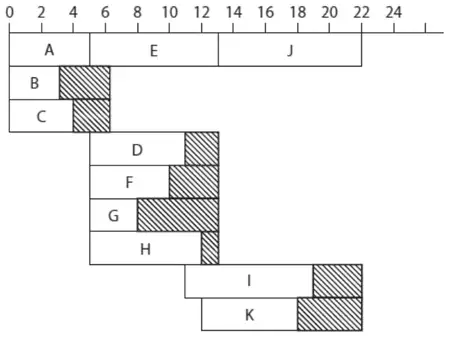
Figure 3 shows a schedule for the project using three workers.
(b)
(i) State the critical path for the network.
(ii) State the minimum completion time for the project.
(iii) Calculate the total float on activity B.
(iv) Calculate the total float on activity G. (4)
Immediately after the start of the project, it is found that the duration of activity I, as shown in Figure 3, is incorrect. In fact, activity I will take 8 hours. The durations of all the other activities remain as shown in Figure 3.
(c) Determine whether the project can still be completed in the minimum completion time using only three workers when the duration of activity I is 8 hours. Your answer must make specific reference to workers, times and activities. (2)
Mark scheme (a)
Scheme
Marks
AO
e.g.
M1 A1 A1 A1 A1
2.1 1.1b 1.1b 1.1b 1.1b
(5)
Notes
Condone lack of, or incorrect, numbered events throughout. ‘Dealt with correctly’ means that the activity starts from the correct event but need not necessarily finishes at the correct event, e.g. ‘H dealt with correctly’ requires the correct precedences for this activity, i.e. D and E labelled correctly and leading into the same node and H starting from that node but do not consider the end event for H. Activity on node is M0
If an arc is not labelled, for example, if the arc for activity C is not labelled (but the arc is present) then this will lose the first A mark and the final (CSO) A mark – they can still earn the second A mark on the bod. If two or more arcs are not labelled then mark according to the scheme. Assume that a solid line is an activity which has not been labelled rather than a dummy (even if in the correct place for where a dummy should be)
Note: if they make multiple attempts which are not clearly replaced mark the one which is best for the candidate Ignore incorrect or lack of arrows on the activities for the first four marks only
M1: At least nine activities (labelled on arc), one start, at least two dummies placed
A1: Activities A, B, C, D and G dealt with correctly
A1: Activities E, F, H, I and J and the first two dummies (+ arrows) at the ends of A and C dealt with correctly (note H and I are interchangeable)
A1: Activities K, L and dummy at the end of F/G (+ arrow) dealt with correctly
A1: CSO – Final dummy (+ arrow) for uniqueness of H/I, all arrows present for every activity with one finish and no additional dummies. (Note direction of arrow on dummy between H and I is interchangeable) (Note the dummy could also be drawn at the start of H and I)
Please check all arcs carefully for arrows – if there are no arrows on dummies then M1A1max Note that additional (but unnecessary) ‘correct’ dummies that still maintain precedence for the network should only be penalised with the final A mark if earned
Mark scheme (b)
Scheme
Marks
AO
(i) Critical path: C – E – J – K
B1
1.1b
(ii) Minimum completion time: 20
B1
1.1b
(iii) Total float on activity B is 2
B1
1.1b
(iv) Total float on activity G is 4
B1
3.1b
(4)
Notes
(i) B1: CAO (critical path CEJK – in this order)
(ii) B1: CAO (20)
(iii) B1: CAO (2 – total float on B)
(iv) B1: CAO (4 – total float on G)
Mark scheme (c)
Scheme
Marks
AO
e.g. (One worker continues to do the critical activities (in time 20)) Second worker completes A, D, G and H as originally planned but now completes activity L in the interval 14 to 20 (but must have started L by time 17 at the latest due to its duration of 3) Third worker completes B and F as planned but now completes activity I exactly in the time interval 12 to 20 so yes, the project can be completed by 3 workers
B2, 1, 0
2.4 2.4
e.g.Yes – can be completed by 3 workers
(2)
(11 marks)
Notes
B1:Award this mark with an indication that either
activities I and L have swapped workers
activity H has swapped worker and I now starts at 12
B1: dependent on first B mark – must have a time reference for both I and either L or H for this mark (L or H may be a range) completely correct reasoning including mention of workers, times and activities (for example, clear indication that (H and) L (in either order) must take place in the interval 12 to 20 and that I must now be done in the interval 12 to 20 or states starts at 12 but not just ends at 20) and either concludes yes or clearly implies that it can be completed on time Note their explanation must not include an incorrect statement
Alternatively redraws the schedule for worker 2 and 3 with one completing H and L (in either order) in the time interval 12 – 20 and the other completing I and concludes that the project can be completed by 3 workers
The table below lists the activities required to set up the room for the evening, and their immediately preceding activities. Each activity requires exactly one person.
Activity
Immediately preceding activities
A
-
B
A
C
A
D
C
E
C
F
B, D, E
G
E
H
B
J
H, F, G
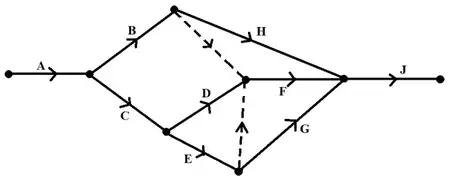
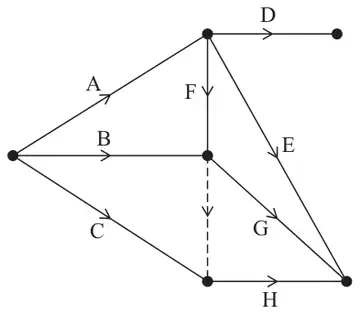
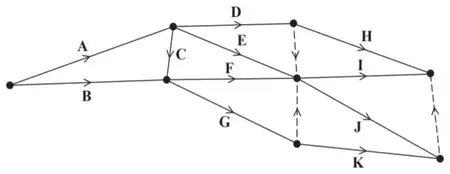
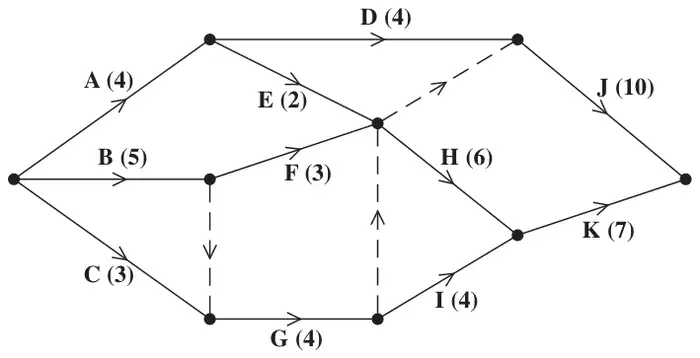
Figure 1 shows a partially completed activity network used to model the project. Each activity is represented by an arc.
Figure 1
(a) Add the remaining five activities to Diagram 1 in the answer book to complete the activity network, using exactly two dummies. (3)
[Diagram 1 in the answer book is a copy of Figure 1.]
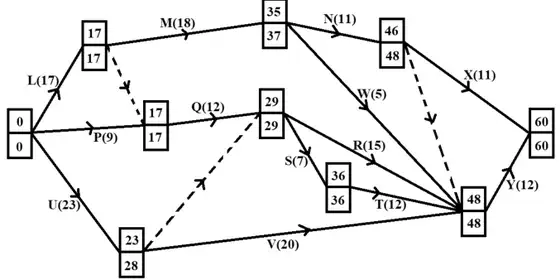
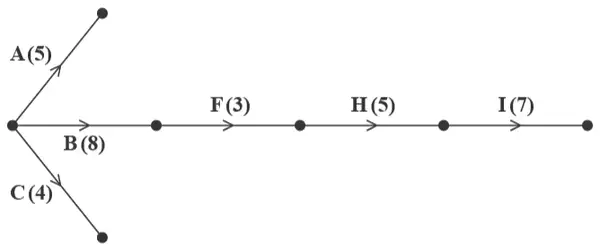
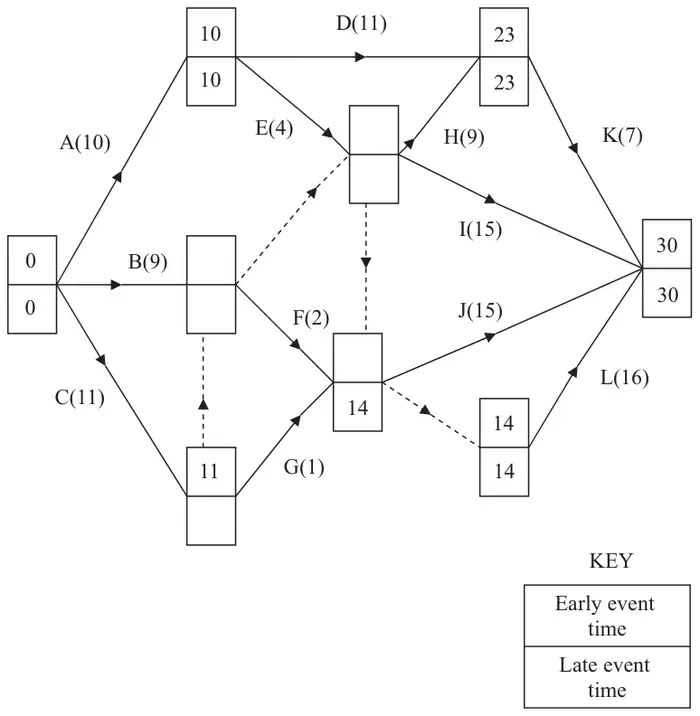
In addition to setting up the room, the company must prepare the meals for the guests. Figure 2 shows the activity network for preparing the main courses. The numbers in brackets represent the time, in minutes, to complete each task.
Figure 2
(b) Complete Diagram 2 in the answer book to show the early event times and the late event times for the activity network shown in Figure 2. (3)
Diagram 2
(c) State the critical activities. (1)
(d) Given that the main courses need to be ready to be served (with all activities completed) at 8 pm, state the latest time that activity R can start. (1)
Mark scheme (a)
Scheme
Marks
AO
M1 A1 (E,F,H) A1
1.1b 1.1b
1.1b
(3)
Notes
‘Dealt with correctly’ means that the activity starts from the correct event but need not necessarily finishes at the correct event, e.g. ‘F dealt with correctly’ requires the correct precedences for this activity, i.e. B, D and E labelled correctly and leading into the same node and F starting from that node but do not consider the end event for F.
M1: Any four activities of E, F, G, H, J added (labelled) (condone missing arrows).
A1: Activities E, F and H (labelled) and one dummy (including correct arrow) dealt with correctly (Ignore lack of or incorrect arrows on E/F/H for this mark only)
A1: CAO Completely correct diagram with all labels and arrows placed correctly on activities and dummies, one finish and exactly two dummies (no additional nodes or activities)
Mark scheme (b)
Scheme
Marks
AO
M1 A1 A1
2.1 1.1b 1.1b
(3)
Notes
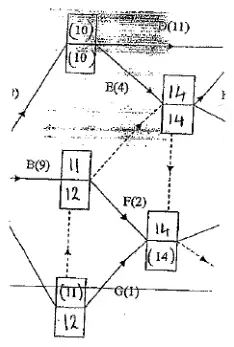
M1: All boxes completed, number generally increasing L to R (condone one “rogue”) and decreasing R to L (condone one “rogue” or missing 0 in first box).
A1: CAO (all top boxes correct)
A1: CAO (all bottom boxes correct)
Mark scheme (c)
Scheme
Marks
AO
The critical activities are L, Q, S, T and Y
B1
1.1b
(1)
Notes
B1: CAO (L, Q, S, T and Y)
Mark scheme (d)
Scheme
Marks
AO
7:33pm
B1
3.2a
(1)
(8 marks)
Notes
B1: CAO, can also say 19:33. Do NOT accept 7:33 (without the pm)
6. The precedence table below shows the twelve activities required to complete a project.
Activity
Immediately preceding activities
A
–
B
–
C
–
D
A
E
A, B
F
D, E
G
A, B, C
H
F, G
I
D, E
J
D, E
K
F, G, I, J
L
I
(a) Draw the activity network described in the precedence table, using activity on arc. Your activity network must contain the minimum number of dummies only. (5)
Figure 6
Figure 6 shows a partially completed cascade chart for the project. The non-critical activities F, J and K are not shown in Figure 6.
The time taken to complete each activity is given in hours and the project is to be completed in the minimum possible time.
(b) State the critical activities. (1)
Given that the total float of activity F is 2 hours,
(c) state the duration of activity F. (1)
The duration of activity J is \(x\) hours, and the duration of activity K is \(y\) hours, where \(x \gt 0\) and \(y \gt 0\)
(d)
(i) State, in terms of \(y\), the maximum possible total float for activity K.
(ii) State, in terms of \(x\) and \(y\), the total float for activity J. (2)
Mark scheme (a)
Scheme
Marks
AO
M1 A1 A1 A1 A1
2.1 1.1b 1.1b 1.1b 1.1b
(5)
Notes
Condone lack of, or incorrect, numbered events throughout. ‘Dealt with correctly’ means that the activity starts from the correct event but need not necessarily finishes at the correct event, e.g. ‘F dealt with correctly’ requires the correct precedences for this activity, i.e. D and E labelled correctly and leading into the same node and F starting from that node but do not consider the end event for F so use the table below for checking as there a number of acceptable answers. Activity on node is M0
If an arc is not labelled, for example, if the arc for activity C is not labelled (but the arc is present) then this will lose the first A mark and the final (CSO) A mark – they can still earn the second A mark on the bod. If two or more arcs are not labelled then mark according to the scheme. Assume that a solid line is an activity which has not been labelled rather than a dummy (even if in the correct place for where a dummy should be)
Ignore lack of arrows on the activities for the first four marks only (but assume that they are in the ‘correct’ direction for checking purposes)
M1: At least nine activities (labelled on arc), one start, at least two dummies placed
A1: Activities A, B, C, D, E and the dummy (+ arrow) at the end of A dealt with correctly
A1: Activities G, F, I and J and the dummy (+ arrow) at the beginning of G dealt with correctly
A1: Activities H and L dealt with correctly
A1: CSO – Final two dummies + arrows and activity K dealt with correctly, all arrows present for every activity with one finish and no additional dummies
Please check all arcs carefully for arrows – if there are no arrows on dummies then M1max Note that additional (but unnecessary) ‘correct’ dummies that still maintain precedence for the network should only be penalised with the final A mark if earned
Activity
A
B
C
D
E
F
G
H
I
J
K
L
IPA
-
-
-
A
A, B
D, E
A, B, C
F, G
D, E
D, E
F, G, I, J
I
Mark scheme (b)
Scheme
Marks
AO
Critical activities: B, E, I and L
B1
2.2a
(1)
Notes
B1: CAO (B, E, I and L only)
Mark scheme (c)
Scheme
Marks
AO
(Earliest start for F is 12 and latest finish is 18 therefore if the total float is 2) the duration of F is 4 (hours)
B1
2.2a
(1)
Notes
B1: CAO (4)
Mark scheme (d)
Scheme
Marks
AO
(i) Maximum possible total float for activity K is \(5 - y\)
The network in Figure 3 shows the activities that need to be undertaken to complete a project. Each activity is represented by an arc and the duration, in hours, of the corresponding activity is shown in brackets.
(a)
(i) Complete Diagram 1 in the answer book to show the early event times and the late event times.
(ii) State the minimum completion time of the project. (3)
Diagram 1
The table below lists the number of workers required for each activity in the project.
Activity
Number of workers
A
2
B
1
C
2
D
2
E
3
F
2
G
1
H
3
Each worker is able to do any of the activities. Once an activity is started it must be completed without interruption. It is given that each activity begins at its earliest possible start time.
(b)
(i) On Grid 1 in the answer book, draw a resource histogram to show the number of workers required at each time.
(ii) Hence state the time interval(s) when six workers are required. (4)
Grid 1
Mark scheme (a)
Scheme
Marks
AO
(i)
M1 A1
1.1b 1.1b
(ii) 11 (hours)
A1ft
2.2a
(3)
Notes
(a)(i)
M1: All top boxes and all bottom boxes completed. Values generally increasing left to right (for top boxes) and values generally decreasing from right to left (for bottom boxes). Condone missing 0s at the source node and/or their 11 in the bottom box at the sink node for M only. Condone one rogue value in top boxes and one rogue value in bottom boxes. For a rogue in the top boxes if values do not increase in the direction of the arrows then if one value is ignored and then the values do increase in the direction of the arrows then this is considered to be only one rogue value (with a similar definition for bottom boxes but in reverse)
A1: CAO - Top boxes and Bottom boxes (all completed)
(ii)
A1ft: Follow through their final early event time (the final late event time does not need to be the same as the final early event time to award this mark) – units not required and ignore incorrect units (just mark the value stated)
Mark scheme (b)
Scheme
Marks
AO
(i)
M1 A1 A1
1.1b 1.1b 1.1b
(ii) Six workers are required in the time intervals 0 – 3 and 8 – 10
A1
2.2a
(4)
(7 marks)
Notes
(b)(i) Do not consider the placement of the activities (if shown) in the histogram – consider only the placement of each vertical bar
M1: Plausible histogram (correct up to time 4) with no holes or overhangs (must go to at least 10 on the time axis)
A1: Histogram correct to time 8
A1: Histogram correct from time 8 to time 11 with no activities taking place after time 11
(b)(ii)
A1: CAO (0 to 3 and 8 to 10) – allow any indication of an interval from 0 to 3 and 8 to 10 (so accept any use of \(\lt, \leqslant\) or just a dash but not, for example, 0 to 2.999…)
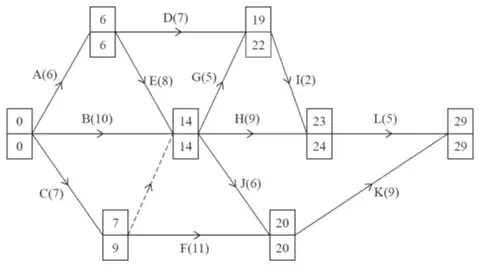
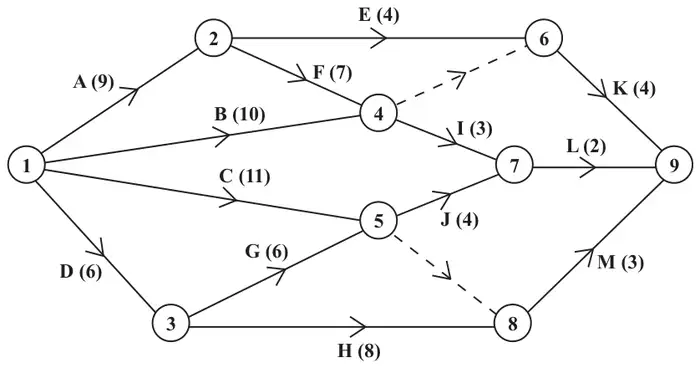
A project is modelled by the activity network shown in Figure 1. The activities are represented by the arcs. The number in brackets on each arc gives the time required, in hours, to complete the corresponding activity. The numbers in circles are the event numbers. Each activity requires one worker, and the project is to be completed in the shortest possible time.
(a) Explain the significance of the dummy activity from event 3 to event 4 (1)
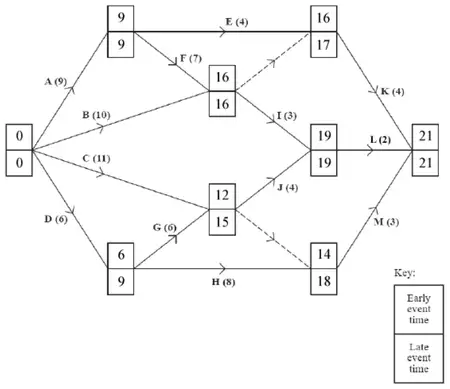
(b) Complete Diagram 1 in the answer book to show the early event times and the late event times. (3)
Diagram 1
(c) State the critical activities. (1)
(d) Calculate a lower bound for the number of workers needed to complete the project in the minimum time. You must show your working. (1)
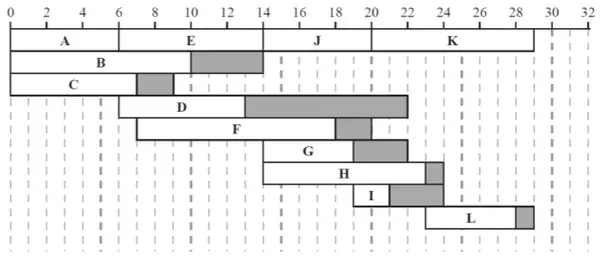
(e) Draw a Gantt chart for this project on Grid 1 in the answer book. (4)
Grid 1
Mark scheme (a)
Scheme
Marks
AO
The dummy from event 3 to event 4 is required as activity F depends only on activity C, but activities G, H and J depend on activities C, B and E
B1
2.4
(1)
Notes
B1: Correct reasoning for the dummy activity – must mention activities F and C (twice or clearly implied twice), at least one of B/E, and at least one of G/H/J (for example, ‘F relies on C, but G relies on C and E’)
Mark scheme (b)
Scheme
Marks
AO
M1 A1 A1
1.1b 1.1b 1.1b
(3)
Notes
M1: All top boxes and all bottom boxes completed. Values generally increasing left to right (for top boxes) and values generally decreasing from right to left (for bottom boxes). Condone missing 0s at the source node or the 29 in the bottom box at the sink node for the M mark only. Condone one rogue value in top boxes and one rogue value in bottom boxes. For a rogue in the top boxes if values do not increase in the direction of the arrows, then if one value is ignored and then the values do increase in the direction of the arrows then this is considered to be only one rogue value (with a similar definition for bottom boxes but in reverse)
A1: cao - Top boxes (including zero at the source node)
A1: cao - Bottom boxes (including zero at the source node and 29 at the sink node)
Mark scheme (c)
Scheme
Marks
AO
Critical activities are A, E, J and K
B1
1.1b
(1)
Notes
B1: cao (the correct four critical activities A, E, J and K and no others)
Mark scheme (d)
Scheme
Marks
AO
\(\dfrac{6+10+7+7+8+11+5+9+2+6+9+5}{29} = \dfrac{85}{29} = 2.931\ldots\) so a lower bound of 3 workers
B1ft
2.2a
(1)
Notes
B1ft: Correct deduction of lower bound from a correct calculation for their minimum project completion time from (b) (so if correct in (b), must be 85/29). The follow through is on their 29 only (so no follow through for incorrectly adding up the duration of all the activities). An answer of 3 with no working scores no marks. All working seen must be correct. As a minimum must either see \(\dfrac{6+10+7+7+8+11+5+9+2+6+9+5}{29}\) or \(\dfrac{85}{29}\) or an awrt 2.9 (not from incorrect working) followed by 3
Mark scheme (e)
Scheme
Marks
AO
M1 A1 A1 A1
2.1 1.1b 1.1b 1.1b
(4)
(10 marks)
Notes
M1: At least nine different activities labelled including at least five floats. A scheduling diagram (so a diagram in which no floats are evident) scores M0
A1: The critical activities dealt with correctly and appearing just once (A, E, J and K) and three non-critical activities dealt with correctly (both duration and total float correct)
A1: Any six non-critical activities correct (this mark is not dependent on the previous A mark)
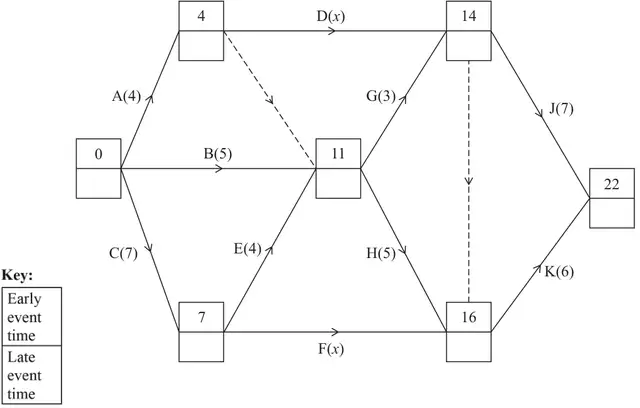
The network in Figure 2 shows the activities that need to be completed for a project. Each activity is represented by an arc and the duration of the activity, in days, is shown in brackets. The early event times are shown in Figure 2.
(a) Complete Table 1 in the answer book to show the immediately preceding activities for each activity. (2)
Activity
Immediately preceding activity
Activity
Immediately preceding activity
A
F
B
G
C
H
D
J
E
K
Table 1
It is given that \(4 \lt x \leqslant m\)
(b) State the largest possible integer value of \(m\). (1)
(c)
(i) Complete Diagram 1 in the answer book to show the late event times.
(ii) State the activities that must be critical. (3)
[Diagram 1 in the answer book is a copy of Figure 2.]
(d) Calculate the total float for activity G. (1)
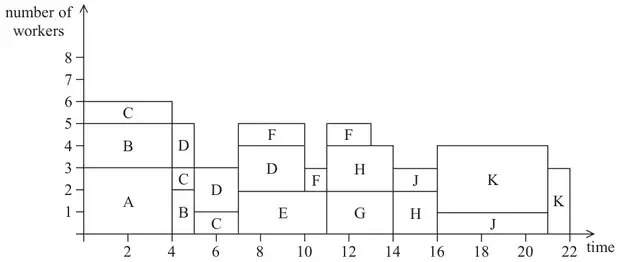
The resource histogram in Figure 3 shows the number of workers required when each activity starts at its earliest possible time. The histogram also shows which activities happen at each time.
Figure 3
(e) Complete Table 2 in the answer book to show the number of workers required for each activity of the project. (2)
Activity
Number of workers
Activity
Number of workers
A
F
B
G
C
H
D
J
E
K
Table 2
(f) Draw a Gantt chart on Grid 1 in the answer book to represent the activity network. (5)
Grid 1
Mark scheme (a)
Scheme
Marks
AO
Activity
IPA
Activity
IPA
A
-
F
C
B
-
G
A, B, E
C
-
H
A, B, E
D
A
J
D, G
E
C
K
D, F, G, H
B1 B1
1.1b 1.1b
(2)
Notes
(a) B1: Four correct rows (not including the rows for A, B and C)
B1: All rows correct (accept blanks or dashes (etc.) for A, B and C but any letters placed in these three rows scores B0)
Mark scheme (b)
Scheme
Marks
AO
\((m =)\ 9\)
B1
2.2a
(1)
Notes
(b) B1: cao for the value of \(m\) – allow \(4 \lt x \leqslant 9\) or \(x \leqslant 9\) but not \(x = 9\) or \(m \leqslant 9\) unless stating the correct value too
Mark scheme (c)
Scheme
Marks
AO
(i)
M1 A1
1.1b 1.1b
(ii) C, E, H and K must be critical
B1
2.2a
(3)
Notes
(c)(i) M1:Any four of the bottom boxes completed correctly
A1: cao – all bottom boxes completed correctly. The \(15 - x\) must be seen to award this mark (but may be crossed out). Condone this correct expression being replaced with their value of \(15 - x\) ONLY if their value of \(x\) is explicitly stated either here or later in their solution
(c)(ii) B1: cao (C, E, H and K only)
Mark scheme (d)
Scheme
Marks
AO
Total float for activity G is 15 – 11 – 3 = 1
B1
2.2a
(1)
Notes
(d) B1: cao – a correct answer with no working (or no incorrect working) can imply this mark
Mark scheme (e)
Scheme
Marks
AO
Activity
Workers
Activity
Workers
A
3
F
1
B
2
G
2
C
1
H
2
D
2
J
1
E
2
K
3
B1 B1
1.1b 1.1b
(2)
Notes
(e) B1: Any six values correct
B1: cao
Mark scheme (f)
Scheme
Marks
AO
\(x = 6\)
B1
3.1b
M1 A1 A1 A1
2.1 1.1b 1.1b 1.1b
(5)
(14 marks)
Notes
(f) B1: cao for the value of \(x\) (seen or implied, e.g., duration of D and F both correct so therefore must be consistent)
M1: Cascade chart with at least 8 activities labelled and at least four activities having non-zero float. A scheduling diagram (so a diagram in which no floats are evident) scores M0
A1: Critical activities (C, E, H and K) correct
A1: Activities B, G and J correct
A1: Activities A, D and F correct
For (f) the following may be useful in checking their cascade chart provided the float is shown after the corresponding activity:
(a) Draw the activity network described in the precedence table above, using activity on arc. Your activity network must contain the minimum number of dummies only. (5)
(b) Explain why it is necessary to draw a dummy from the end of activity A. (1)
Every activity shown in the precedence table has the same duration.
(c) State which activity cannot be critical, justifying your answer. (2)
Mark scheme (a)
Scheme
Marks
AO
M1 A1 A1 A1 A1
1.1b 1.1b 1.1b 1.1b 1.1b
(5)
Notes
Condone lack of, or incorrect, numbered events throughout. ‘Dealt with correctly’ means that the activity starts from the correct event but need not necessarily finish at the correct event, e.g. ‘K dealt with correctly’ requires the correct precedences for this activity, i.e. D and H labelled correctly and leading into the same node and K starting from that node but do not consider the end event for K. Activity on node is M0
If an arc is not labelled, for example, if the arc for activity D is not labelled (but the arc is present) then this will lose the first A mark and the final (CSO) A mark – they can still earn the third A mark on the bod. If two or more arcs are not labelled then mark according to the scheme. Assume that a solid line is an activity which has not been labelled rather than a dummy (even if in the correct place for where a dummy should be)
Ignore incorrect or lack of arrows on the activities for the first four marks only
M1: At least eight activities (labelled on arc), one start and at least two dummies placed
A1: Activities A, B, C, D, E, G and H dealt with correctly
A1: Activity F dealt with correctly and first two dummies & correct arrows dealt with correctly
A1: Activities I, J, K and final dummy dealt with correctly.
A1: cso All arrows present and correctly placed with one finish and no additional dummies
Please check all arcs carefully for arrows – if there are no arrows on any dummies then M1 only. Note that additional (but unnecessary) ‘correct’ dummies that still maintain precedence for the network should only be penalised with the final A mark if earned
Mark scheme (b)
Scheme
Marks
AO
e.g. Activity E is preceded by activity A only, but activity F is preceded by activity B (and/or C) as well as activity A
B1
2.4
(1)
Notes
B1: Reference to E depends on A only, while F depends on A and B (and/or C). So must mention activities A, E, F and at least one of B and C
Mark scheme (c)
Scheme
Marks
AO
Activity D as this is the only activity on a path from start to finish of which contains only two activities. All other activities appear on at least one longer path
M1 A1
3.1b 3.4
(2)
(8 marks)
Notes
M1: cao - Activity D only – if more than one activity stated then M0
A1: Correct reasoning. Explain that the path/route through D is the only one containing two activities or that all other routes/paths have 3 activities. Or mention activities C, H and K and that C and H together take ‘longer’ to finish than D
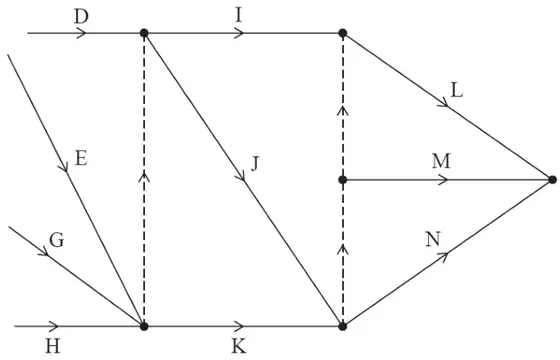
Figure 5 shows a partially completed activity network for a project that consists of 14 activities.
(a) Complete the precedence table in the answer book for the 8 activities in Figure 5. (2)
Activity
Immediately preceding activities
Activity
Immediately preceding activities
A
E
B
F
C
G
D
H
The precedence table for the remaining 6 activities is given below.
Activity
Immediately preceding activities
I
D, E, G, H
J
D, E, G, H
K
E, G, H
L
I, J, K
M
J, K
N
J, K
(b) Complete the activity network in the answer book for the project. Your completed activity network must contain only the minimum number of dummies. (4)
[The activity network in the answer book is a copy of Figure 5.]
Given that all 14 activities have the same duration,
(c) explain why activity D cannot be critical. (2)
Mark scheme (a)
Scheme
Marks
AO
Activity
Immediately preceding activities
A
-
B
-
C
-
D
A
E
A
F
A
G
B, F
H
B, C, F
B1 B1
1.1b 1.1b
(2)
Notes
(a) B1: Either row G or H correct
B1: All rows correct (condone blanks in A, B and C rows)
Mark scheme (b)
Scheme
Marks
AO
e.g.
M1 A1 A1 A1
2.1 1.1b 1.1b 1.1b
(4)
Notes
Condone lack of, or incorrect, numbered events throughout. ‘Dealt with correctly’ means that the activity starts from the correct event but need not necessarily finishes at the correct event, e.g. ‘K dealt with correctly’ requires the correct precedences for this activity, i.e. E, G and H labelled correctly and leading into the same node and K starting from that node but do not consider the end event for K. Activity on node is M0
Assume that a solid line is an activity which has not been labelled rather than a dummy (even if in the correct place for where a dummy should be)
Ignore incorrect or lack of arrows on the activities for the first three marks only
(b) M1: At least five activities (labelled on arc), at least two dummies placed
A1: Activities I, J, K and first dummy + arrow dealt with correctly
A1: Activities L, M, N and a second dummy + arrows dealt with correctly
A1: cso – all arrows present for every activity with one finish and exactly three dummies. Note that this is not a unique solution e.g. M and N could be interchanged so please check these carefully. Please check all arcs carefully for arrows – if there are no arrows on any dummies then M1 only
Note that additional (but unnecessary) ‘correct’ dummies that still maintain precedence for the network should only be penalised with the final A mark if earned
Mark scheme (c)
Scheme
Marks
AO
If all activities have the same duration then any critical path must contain 5 activities. All paths that pass-through D have only 4 activities and so therefore D cannot be critical.
B1 B1
2.4 2.4
(2)
(8 marks)
Notes
(c) B1: Explains that all critical paths must contain 5 activities (oe method e.g., attempting a forward and backward pass with each activity having the same duration)
B1: cao that D cannot be critical with mention of all paths through D only contain 4 activities (oe method e.g., showing that the total float on activity D is not zero)
SCB1: stating or implying that D has a float of 1 (oe) by considering a forward pass (which may or may not be done mathematically) up to at least activity D
A project is modelled by the activity network shown in Figure 2. The activities are represented by the arcs. The number in brackets on each arc gives the time, in hours, to complete the corresponding activity.
(a) Complete Diagram 1 in the answer book to show the early event times and the late event times. (4)
Diagram 1
Each activity requires one worker and the project must be completed in the shortest possible time using as few workers as possible.
(b) Calculate a lower bound for the number of workers needed to complete the project in the shortest possible time. You must show your working. (2)
(c) Schedule the activities using Grid 1 in the answer book. (3)
Grid 1
Mark scheme (a)
Scheme
Marks
AO
M1 A1 M1 A1
2.1 1.1b 1.1b 1.1b
(4)
Notes
(a) M1: All top boxes completed, number generally increasing L to R (condone one “rogue”)
A1: cao - top boxes (including zero at the source node)
M1: All bottom boxes completed, numbers generally decreasing R to L (condone one “rogue”)
A1: cao - bottom boxes (including zero at the sink node)
Mark scheme (b)
Scheme
Marks
AO
\(\dfrac{71}{22} = \ldots\)
M1
1.1b
…= 3.22… therefore 4 workers
A1
2.2a
(2)
Notes
(b) M1: Attempt to find the lower bound (71 \(\pm\) 10) / their completion time (a value of 3.2… seen with no working can imply this mark)
A1: cso - correct calculation seen or 3.2 followed by 4. An answer of 4 with no working scores M0A0
Mark scheme (c)
Scheme
Marks
AO
M1 A1 A1
2.1 1.1b 1.1b
(3)
(9 marks)
Notes
(c) M1: Not a cascade chart, 4 ‘workers’ used at most and at least 9 different activities placed
A1: 4 workers. All 13 activities present (just once – so if an activity appears for two different workers and is happening at the same time this is A0). Condone at most two errors. An activity can give rise to at most three errors; one on duration, one on time interval and only one on IPA
A1: 4 workers. All 13 activities present (just once). No errors
The network in Figure 1 shows the activities that need to be undertaken to complete a project. Each activity is represented by an arc and the duration, in hours, of the corresponding activity is shown in brackets.
(a) Explain why each of the dummy activities is required. (2)
(b) Complete the table in the answer book to show the immediately preceding activities for each activity. (2)
Activity
Immediately preceding activities
A
B
C
D
E
F
G
H
I
J
K
L
(c)
(i) Complete Diagram 1 in the answer book to show the early event times and the late event times.
(ii) State the minimum completion time for the project.
(iii) State the critical activities. (6)
Diagram 1
Each activity requires one worker. Each worker is able to do any of the activities. Once an activity is started it must be completed without interruption.
(d) On Grid 1 in the answer book, draw a resource histogram to show the number of workers required at each time when each activity begins at its earliest possible start time. (3)
Grid 1
(e) Determine whether or not the project can be completed in the minimum possible time using fewer workers than the number indicated by the resource histogram in (d). You must justify your answer with reference to the resource histogram and the completed Diagram 1. (2)
Mark scheme (a)
Scheme
Marks
AO
The dummy at the end of activity B is required as F (and G) are dependent on activity B only, but activity H is dependent on both activities B and C
B1
2.4
The dummy at the end of activity K is required as two activities cannot start at the same event and finish at the same event
B1
2.4
(2)
Notes
(a) B1: Correct explanation for precedence dummy (must mention B, C, H and one of F or G)
B1: Correct explanation for uniqueness dummy
Mark scheme (b)
Scheme
Marks
AO
Activity
IPA
Activity
IPA
Activity
IPA
A
-
E
A
I
E, F
B
-
F
B
J
G, H
C
-
G
B
K
D, I
D
A
H
B, C
L
D, I
B1 B1
1.1b 1.1b
(2)
Notes
(b) B1: Six correct rows (not including A, B and C)
B1: All rows correct (accept blanks for A, B and C)
Mark scheme (c)
Scheme
Marks
AO
(i)
M1 A1 M1 A1
1.1b 1.1b 1.1b 1.1b
(ii) Minimum completion time: 21 hours
A1ft
1.1b
(iii) Critical activities: A, E, I, L
A1
1.1b
(6)
Notes
(c)(i) M1: All top boxes completed, number generally increasing L to R (condone one “rogue”)
A1: CAO - Top boxes
M1: All bottom boxes completed, numbers generally decreasing R to L (condone one “rogue”) – condone lack of 0 or 21 for the M mark only
A1: CAO - Bottom boxes
(c)(ii) A1ft: Correct follow through from their completed top boxes
(c)(iii) A1: Correct critical activities (A, E, I and L only)
Mark scheme (d)
Scheme
Marks
AO
e.g.
M1 A1 A1
1.1b 1.1b 1.1b
(3)
Notes
(d) M1: Plausible histogram (correct up to time 6) with no holes or overhangs (must go to at least 20 on the time axis)
A1: Histogram correct to time 10
A1: Histogram correct from time 10 to time 21
Mark scheme (e)
Scheme
Marks
AO
Currently five workers are required between time 7 and 10 and so one of the non-critical activities D, F, G or H would have to be delayed and start after time 10
M1
2.4
e.g. Activity H could be delayed and start at time 10 (as it has sufficient total float and can finish as late as time 15) and so the project can be completed with fewer workers than the number indicated by the resource histogram as J could be delayed too and start at time 15
A1
2.2a
(2)
(15 marks)
Notes
(e) M1: Explanation involving the need to delay just one of the non-critical activities (must mention one of D, F, G or H) to start after time 10 (oe) – follow through their histogram
A1: Dependent on a correct histogram and correct answer to (c)(i). Correct deduction that it is possible to complete with fewer workers e.g. delay H to start at 10 therefore delay J to start at its late time (or 15) – A0 if mention of delaying activity F
A project is modelled by the activity network shown in Figure 1. The activities are represented by the arcs. The number in brackets on each arc gives the time, in hours, to complete the corresponding activity. Each activity requires one worker. The project is to be completed in the shortest possible time.
(a) Complete the precedence table in the answer book. (2)
Activity
Immediately preceding activities
A
B
C
D
E
F
G
H
I
J
K
(b) Complete Diagram 1 in the answer book to show the early event times and the late event times. (3)
Diagram 1
(c)
(i) State the minimum project completion time.
(ii) List the critical activities. (2)
(d) Calculate the maximum number of hours by which activity H could be delayed without affecting the shortest possible completion time of the project. You must make the numbers used in your calculation clear. (1)
(e) Calculate a lower bound for the number of workers needed to complete the project in the minimum time. You must show your working. (2)
(f) Draw a cascade chart for this project on Grid 1 in the answer book. (3)
Grid 1
(g) Using the answer to (f), explain why it is not possible to complete the project in the shortest possible time using the number of workers found in (e). (1)
Mark scheme (a)
Scheme
Marks
AO
Activity
Immediately preceding activity
A
-
B
-
C
-
D
A
E
A
F
A, B
G
A, B, C
H
A, B, C
I
D
J
D, E, F, G, H
K
H
B1 B1
1.1b 1.1b
(2)
Notes
B1: 5 non-empty rows correct (so any 5 of the rows for activities D to K correct)
B1: All 11 rows correct
Mark scheme (b)
Scheme
Marks
AO
M1 A1 A1
2.1 1.1b 1.1b
(3)
Notes
M1: All boxes completed, number generally increasing L to R (condone one “rogue”) and decreasing R to L (condone one “rogue”)
A1: CAO (all top boxes correct)
A1: CAO (all bottom boxes correct)
Mark scheme (c)
Scheme
Marks
AO
(i) Minimum project completion time is 22 hours
B1ft
1.1b
(ii) Critical activities are A, E and J
B1
1.1b
(2)
Notes
(c)(i) B1ft: CAO following through their completed top boxes from (b)
(c)(ii) B1: CAO (A, E and J only)
Mark scheme (d)
Scheme
Marks
AO
H could be delayed by 13 – 5 – 7 = 1 hour
B1ft
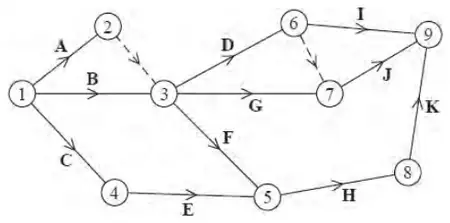
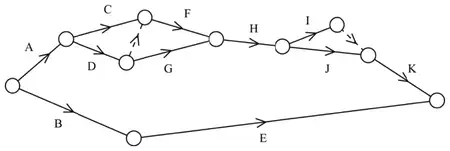
3.4
(1)
Notes
B1ft: Correct calculation for their activity H (from (b)) – must see all 3 numbers (so just 13 – 12 = 1 is B0)
Mark scheme (e)
Scheme
Marks
AO
\(\dfrac{5 + 3 + 4 + \ldots + 8 + 9 + 6}{22}\)
M1
1.1b
= 2.909... so a lower bound of 3 workers
A1
2.2a
(2)
Notes
M1: (55 to 73 inclusive) / their duration (their answers to (b) and (c)(i) must be consistent)
A1: Correct deduction of lower bound from a correct calculation – answer of 3 with no working scores no marks in this part
Mark scheme (f)
Scheme
Marks
AO
M1 A1 A1
2.1 1.1b 1.1b
(3)
Notes
M1: At least 9 activities including at least 6 floats
A1: All correct critical activities present and 5 non-critical activities correct
A1: All non-critical activities correct
Mark scheme (g)
Scheme
Marks
AO
e.g. between times 5 and 13 activities E, D, F, G and H must all be happening. The total time to complete these five activities is 29 hours and 29/8 > 3 so it is not possible to complete with the lower bound of 3 workers e.g. at time 8.5 activities E, D, F and H must be happening so not possible to complete with only 3 workers
B1
3.4
(1)
(14 marks)
Notes
B1: Correct reasoning that it is not possible to complete the project with only 3 workers – candidates must refer to both times and activities for this mark (as an indication that they have used (f))
(a) Draw the activity network described in the precedence table above, using activity on arc. Your activity network must contain only the minimum number of dummies. (5)
Given that all the activities shown in the precedence table have the same duration,
(b) state the critical path for the network. (1)
Mark scheme (a)
Scheme
Marks
AO
e.g.
M1 A1 A1 A1 A1
1.1b 1.1b 1.1b 1.1b 1.1b
(5)
Notes
Condone lack of, or incorrect, numbered events throughout. ‘Dealt with correctly’ means that the activity starts from the correct event but need not necessarily finishes at the correct event, e.g. ‘F dealt with correctly’ requires the correct precedences for this activity, i.e. B, C and D labelled correctly and leading into the same node and F starting from that node but do not consider the end event for F. Activity on node is M0
If an arc is not labelled, for example, if the arc for activity G is not labelled (but the arc is present) then this will lose the first A mark and the final (CSO) A mark – they can still earn the second A mark on the bod. If two or more arcs are not labelled then mark according to the scheme. Assume that a solid line is an activity which has not been labelled rather than a dummy (even if in the correct place for where a dummy should be)
Ignore incorrect or lack of arrows on the activities for the first four marks only
(a) M1: At least nine activities (labelled on arc), one start, at least two dummies placed
A1: Activities A, B, C, D, E, G dealt with correctly
A1: Activities F, H and first two dummies + arrows dealt with correctly (the first two dummies are those that are required at the event at the end of activity B)
A1: Activities I, J and K dealt with correctly (note that I and J can start directly after the end of G)
A1: CSO – Final dummy + arrow, all arrows present for every activity with one finish and no additional dummies. Note that this is not a unique solution e.g. I, J could be interchanged, or the dummy could come after I or J, F and K could lead into the dummy etc. so please check these carefully. Please check all arcs carefully for arrows – if there are no arrows on dummies then M1A1max
Note that additional (but unnecessary) ‘correct’ dummies that still maintain precedence for the network should only be penalised with the final A mark if earned
The network in Figure 3 shows the activities that need to be undertaken to complete a project. Each activity is represented by an arc and the duration of the activity, in days, is shown in brackets. The early event times and late event times are to be shown at each vertex and one late event time has been completed for you.
The total float of activity H is 7 days.
(a) Explain, with detailed reasoning, why \(x = 11\) (2)
(b) Determine the missing early event times and late event times, and hence complete Diagram 1 in your answer book. (3)
[Diagram 1 in the answer book is a copy of Figure 3.]
Each activity requires one worker and the project must be completed in the shortest possible time using as few workers as possible.
(c) Calculate a lower bound for the number of workers needed to complete the project in the shortest possible time. (1)
(d) Schedule the activities using Grid 1 in the answer book. (3)
Grid 1
Mark scheme (a)
Scheme
Marks
AO
The early event time at the end of activity C is 7 (as no other activity leads into this event). Therefore the float on activity H is \(25 - 7 - x\)
B1
3.1a
The float on activity H is given as 7 and so therefore \(25 - 7 - x = 7\) implies that the value of \(x\) is equal to \(25 - 7 - 7 = 11\)
dB1
2.4
(2)
Notes
(a) B1: correct reasoning for why the float on activity H is given by \(25 - 7 - x\), must mention that the early event time at the end of activity C is 7 or the early event time at the start of H is 7 and that the total float for H is therefore \(\underline{25 - 7 - x}\) (or \(25 - x - 7\) but not just \(18 - x\)) (no reason for why the early event time at the end of C is 7 is required)
dB1: correct explanation for why \(x = 11\) (dependent on previous B mark) – as a minimum must equate \(\underline{25 - 7 - x}\) to \(\underline{7}\) (allow \(18 - x = 7\) as they must have shown where the 18 comes from to get the first B mark) and hence \(\underline{x = 11}\)
SC B1B0: – for those who write or imply \(25 - 7 - x = 7\) (but not just \(18 - x = 7\)) and state \(x = 11\) without any mention of the early event time at the end of C or the total float of activity H. However, \(25 - 7 - 7 = 11\) only is no marks in this part
Mark scheme (b)
Scheme
Marks
AO
M1 A1 A1
2.1 1.1b 1.1b
(3)
Notes
(b) M1: All top boxes and all bottom boxes completed. Values generally increasing left to right (for top boxes) and values generally decreasing from right to left (for bottom boxes). Condone missing 0s at the source node or the 32 in the bottom box at the sink node for M only. Condone one rogue value in top boxes and one rogue value in bottom boxes. For a rogue in the top boxes if values do not increase in the direction of the arrows then if one value is ignored and then the values do increase in the direction of the arrows then this is considered to be only one rogue value (with a similar definition for bottom boxes but in reverse)
A1: CAO - Top boxes (including zero at the source node)
A1: CAO - Bottom boxes (including zero at the sink node)
Mark scheme (c)
Scheme
Marks
AO
\(\dfrac{95}{32} = 2.968\ldots = 3\) workers
B1
2.2a
(1)
Notes
(c) B1: Correct calculation seen then 3 – an answer of 3 with no working scores B0
Mark scheme (d)
Scheme
Marks
AO
e.g.
M1 A1 A1
2.1 1.1b 1.1b
(3)
(9 marks)
Notes
(d) M1: Not a cascade chart. 4 ‘workers’ used at most and at least 10 different activities placed
A1: 4 workers. All 13 activities present (just once – so if an activity appears for two different workers and is happening at the same time this is A0). Condone at most two errors. An activity can give rise to at most three errors; one on duration, one on time interval and only one on IPA
A1: 4 workers. All 13 activities present (just once). No errors
(a) Draw the activity network described in the precedence table above, using activity on arc. Your activity network must contain the minimum number of dummies. (5)
Every activity shown in the precedence table has the same duration.
(b) Explain why activity B cannot be critical. (1)
(c) State which other activities are not critical. (1)
Mark scheme (a)
Scheme
Marks
AO
M1 A1 A1 A1 A1
1.1b 1.1b 1.1b 1.1b 1.1b
(5)
Notes
In (a) condone lack of, or incorrect, numbered events throughout. ‘Dealt with correctly’ means that the activity starts from the correct event but need not necessarily finishes at the correct event, e.g. ‘G dealt with correctly’ requires the correct precedences for this activity, i.e. B and C labelled correctly and leading into the same node and G starting from that node but do not consider the end node for G. Activity on node is M0
If an arc is not labelled, for example, if the arc for activity G is not labelled (but the arc is present) then this will lose the first A mark and the final (CSO) A mark – they can still earn the second A mark on the bod. If two or more arcs are not labelled then mark according to the scheme. Assume that a solid line is an activity which has not been labelled rather than a dummy (even if in the corrct place for where a dummy should be)
M1: At least eight activities (labelled on arc), one start, and at least two dummies placed
A1: Activities A – G dealt with correctly (bod if no arrow on activity C)
A1: First two required dummies + arrows dealt with correctly
A1: Activities H – K dealt with correctly (A0 if no arrows on preceding dummies (oe))
A1: CSO – Final required dummy + all arrows present and correctly placed with one finish and no additional dummies. Note that the arrow for the final dummy could be reversed. Note that there are several correct viable positions for the final dummy
Note that additional (but unecessary) ‘correct’ dummies that still maintain precedence for the network should only be penalised with the final A mark if earned
Mark scheme (b)
Scheme
Marks
AO
Activity F (and/or G) requires activity B and the two activities A and C to be completed before F (and/or G) can begin. The time to complete A and C is double that of B and so B can be delayed waiting for A and C to be completed and so B is therefore not critical.
B1
2.4
(1)
Notes
B1: CAO - some mention of the time required to complete A + C compared with B (for the next activity to begin (either F and/or G)) oe e.g. paths through B have a maximum length of 3 (non-dummy) activities and there is at least one path of length 4 which does not include B so B cannot be critical OR the late time for B must be the same as the late time for A + C which is twice the duration of B and therefore B is not critical. Give bod to responses that imply that B and C meet at the same event, but C is also dependent on A (the key point for awarding this mark is that activities A and C imply that B is not critical)
Mark scheme (c)
Scheme
Marks
AO
Activities D, E and H
B1
2.2a
(1)
(7 marks)
Notes
B1: All three correct with no extras (ignore any mention of activity B)
The table above shows the activities required for the completion of a building project. For each activity, the table shows the time it takes, in days, and the immediately preceding activities. Each activity requires one worker. The project is to be completed in the shortest possible time.
Figure 2
Figure 2 shows a partially completed activity network used to model the project. The activities are represented by the arcs and the number in brackets on each arc is the time taken, in days, to complete the corresponding activity.
(a) Add the missing activities and necessary dummies to Diagram 1 in the answer book. (3)
(b) Complete Diagram 1 in the answer book to show the early event times and the late event times. (3)
Diagram 1
(c) State the critical activities. (1)
At the beginning of the project it is decided that activity G is no longer required.
(d) Explain what effect, if any, this will have on
(i) the shortest completion time of the project if activity G is no longer required,
(ii) the timing of the remaining activities. (3)
Mark scheme (a)
Scheme
Marks
AO
M1 A1 A1
1.1b 1.1b 1.1b
(3)
Notes
M1: Any three activities of D, E, G, J added together with at least one dummy
A1: D, E, G and first dummy added correctly (with arrows) i.e. first part of the network correct
A1: J and second dummy added correctly (with arrows) i.e. second part of the network correct
SC: If M1A0A0 but only error is any missing arrows then award M1A1A0
SC: Award M1A1A0 for a ‘correct’ diagram with more than two dummies
Mark scheme (b)
Scheme
Marks
AO
M1 M1 A1
1.1b 1.1b 1.1b
(3)
Notes
(The mark scheme gives one diagram for (a) and (b) together.)
M1: All top boxes complete, numbers increasing in the direction of the arrows – dependent on all four activities D, E, G, J added (bod if not labelled) – condone lack of additional event node for J
M1: All bottom boxes complete, numbers decreasing in the opposite direction of the arrows – dependent on all four activities D, E, G, J added (bod if not labelled) – condone lack of additional event node for J
A1: Cso (including diagram) - must contain exactly 8 early and late event times and only two correct dummies placed with one finish – note that some candidates may start with e.g. a dummy at the event before the start of activity I which will affect their early and late event times at this node (both values should be 24))
Mark scheme (c)
Scheme
Marks
AO
The critical activities are A, D, H and J
B1
1.1b
(1)
Notes
B1: Cao (A, D, H and J)
Mark scheme (d)
Scheme
Marks
AO
(i) No effect (as G is not one of the critical activities)
B1
2.4
(ii) Activity C is the only affected activity and it can now start 4 days later at time 12 (rather than at time 8) or finish as late as time 16
M1 A1
3.4 1.1b
(3)
(10 marks)
Notes
(d)(i) B1: Explanation that there is no effect on the completion time (as G is not critical)
(d)(ii) M1: Use their model to deduce that C is the (only) activity that is affected
A1: Correct answer that activity C (only – maybe implicit) can e.g. finish at time 16 or start at time 12 – for this mark the explanation must give a relevant time
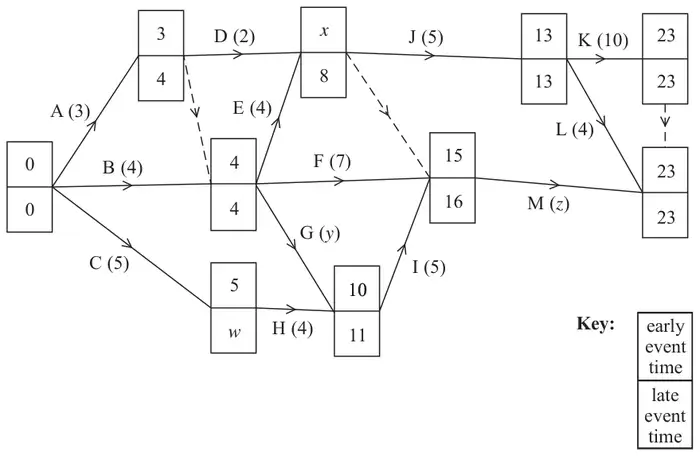
The network in Figure 5 shows the activities that need to be undertaken in order to complete a project. Each activity is represented by an arc. The number in brackets is the duration of the activity in hours. The early event times and late event times are shown at each node. The project can be completed in 23 hours.
Given that the total float on activity G is 1 hour,
(a) find the values of \(w\), \(x\), \(y\) and \(z\). (4)
(b) Explain the purpose of the dummy activity that has a late event time of 16 (1)
(c) List the critical activities. (1)
This project is being completed by a company that has only two permanent workers available. The project must be completed in 23 hours and, in order to achieve this, the company is prepared to hire additional workers at a cost of £35 per hour payable only for the time that the workers are engaged in activities. The company wishes to minimise the money spent on additional workers. Any worker can undertake any activity and each activity requires only one worker. Once an activity has been started it must be completed without interruption and by the same worker.
(d) Explain why the company cannot complete the project in 23 hours using only their permanent workers. (1)
(e) Schedule the activities to workers on Grid 1 in the answer book so that the project is completed in 23 hours using the minimum number of workers and at minimum cost to the company. (3)
(f) Calculate the minimum extra cost to the company. You must make your working clear. (2)
Due to bad weather, activity H may take 7 hours to complete.
(g) Explain what affect this would have on the minimum time taken to complete the whole project. (You do not need to reschedule the project.) (2)
Mark scheme (a)
Scheme
Marks
\(w = 7,\ x = 8,\ y = 6,\ z = 7\)
B4,3,2,1,0
(4)
Notes
a1B1: One value correct
a2B1: Two values correct
a3B1: Three values correct
a4B1: All four values correct (check carefully for answers written on the diagram rather than on the given answer lines)
Mark scheme (b)
Scheme
Marks
The dummy is required as J relies on D and E but M relies on D, E, F and I
B1
(1)
Notes
b1B1: Correct answer regarding precedence – must mention J, M and one of D and E and one of F and I
Mark scheme (c)
Scheme
Marks
Critical activities: B, E, J and K
B1
(1)
Notes
c1B1: CAO (B, E, J, K)
Mark scheme (d)
Scheme
Marks
e.g. \(\dfrac{53 + y + z}{23} = \dfrac{66}{23} = 2.869\ldots\) so at least three workers are required
B1
(1)
Notes
d1B1: Correct calculation or argument with the correct values of \(y\) and \(z\). Other equivalent answers with regards to scheduling are acceptable (e.g. with only two workers the minimum completion time for the project is 33 hours or at time 2.5 activities A, B and C must be taking place (in situations like this detail of both activities and time must be given))
Mark scheme (e)
Scheme
Marks
e.g.
M1 A1 A1
(3)
Notes
e1M1: Not a cascade chart. 4 ‘workers’ used at most and at least 9 activities placed
e1A1: 3 workers. All 13 activities present (just once). Condone at most two errors. An activity can give rise to at most three errors; one on duration, one on time interval and only one on IPA
e2A1: 3 workers. All 13 activities present (just once). No errors
Activity
Duration
Time interval
IPA
A
3
0 - 4
-
B
4
0 – 4
-
C
5
0 – 7
-
D
2
3 – 8
A
E
4
4 – 8
A, B
F
7
4 – 16
A, B
G
6
4 – 11
A, B
H
4
5 – 11
C
I
5
10 – 16
G, H
J
5
8 – 13
D, E
K
10
13 – 23
J
L
4
13 – 23
J
M
7
15 – 23
D, E, F, I
Mark scheme (f)
Scheme
Marks
\(35 \times \left(\sum \text{activities completed by additional worker(s)}\right)\)
M1
£700
A1
(2)
Notes
f1M1: Correct calculation (so cost of one or more additional workers only) for their schedule – dependent on scheduling at least 12 activities in (e) – M0 if attempted cost of the two permanent workers is included
f1A1: CAO (their schedule must have had two workers working continuously from 0 to 23) – condone lack of units (but not incorrect units)
Mark scheme (g)
Scheme
Marks
H requiring 7 hours will delay the completion of the project because the total float on activity H is 2 hours and so the project will be delayed by 1 hour
M1 A1
(2)
14 marks
Notes
g1M1: Delayed together with some mention of time and/or float for activity H
g1A1: Project delayed by 1 hour (oe e.g. minimum completion time is now 24) - just mentioning that the total float for activity H is 2 (or that H cannot be completed on time) is A0. Give bod that ‘a delay of 1 hour’ is considering the entire project but A0 if clearly only talking about activities
(a) Draw the activity network described in the precedence table above, using activity on arc and exactly 4 dummies. (5)
(b) Explain why one of the activities I or J must be critical. (1)
It is given that activity C is a critical activity.
(c) State the activities that are therefore guaranteed to be critical. (1)
Mark scheme (a)
Scheme
Marks
M1 A1 A1 A1 A1
(5)
Notes
In (a) condone lack of, or incorrect, numbered events throughout. ‘Dealt with correctly’ means that the activity starts from the correct event but need not necessarily finishes at the correct event, e.g. ‘F dealt with correctly’ requires the correct precedences for this activity, i.e. C and D labelled correctly and leading into the same node and F starting from that node but do not consider the end node for F. Activity on node is M0
If an arc is not labelled, for example, if the arc for activity G is not labelled (but the arc is present) then this will lose the second A mark and the final (CSO) A mark – they can still earn the third A mark on the bod. If two or more arcs are not labelled then mark according to the scheme. Assume that a solid line is an activity which has not been labelled rather than a dummy (even if in the corrct place for where a dummy should be)
Ignore incorrect or lack of arrows on the activities for the first four marks only
a1M1: Eight activities (labelled on arc), one start and at least two dummies placed
a1A1: Activities A, B, 1st dummy (+ arrow) and C, D and E dealt with correctly
a2A1: 2nd and 3rd dummies (+ arrow) and F, G and H dealt with correctly
a3A1: Activities I, J and 4th dummy (+ arrow) dealt with correctly
a4A1: CSO – all arrows present and correctly placed with one finish – please check all arcs carefully for arrows
Note that additional (but unnecessary) ‘correct’ dummies that still maintain precedence for the network should only be penalised with the final A mark if earned
Mark scheme (b)
Scheme
Marks
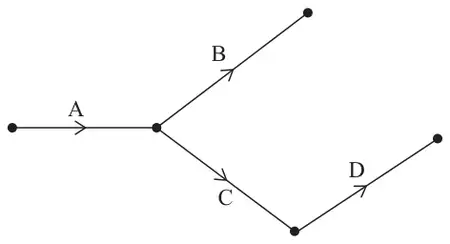
In the network there must be at least one critical path from the start node to the end node and as all paths must pass through either I or J (as these are the only two activities that go into the end node) so one of these must be critical
B1
(1)
Notes
b1B1: CAO (must either mention that any critical path for the network would need to pass through either I or J
Mark scheme (c)
Scheme
Marks
A and F must be critical
B1
(1)
7 marks
Notes
c1B1: CAO (with no additional activities – so accept A, F or A, C, F only but not A, (C), F, I or J)
A project is modelled by the activity network shown in Figure 4. The activities are represented by the arcs. The number in brackets on each arc gives the time, in days, to complete the corresponding activity. Each activity requires one worker. The project is to be completed in the shortest possible time.
(a) Complete Diagram 1 in the answer book to show the early event times and the late event times. (4)
(b) State the critical activities. (1)
(c) Draw a cascade (Gantt) chart for this project on the grid in the answer book. (4)
(d) Use your cascade chart to determine the minimum number of workers needed to complete the project in the shortest possible time. You must make specific reference to times and activities. (You do not need to provide a schedule of the activities.) (2)
Mark scheme (a)
Scheme
Marks
M1
A1
M1
A1
(4)
Notes
a1M1: All top boxes complete, values in the top boxes generally increasing in the direction of the arrows (‘left to right’), condone one ‘rogue’ value (if values do not increase in the direction of the arrows then if one value is ignored and then the values do increase in the direction of the arrows then this is considered to be only one rogue value)
a1A1: CAO for the top boxes
a2M1: All bottom boxes complete, values generally decreasing in the opposite direction of the arrows (‘right to left’), condone one rogue. Condone missing 0 and/or 35 for the M only
a2A1: CAO for the bottom boxes
Mark scheme (b)
Scheme
Marks
Critical activities: A, D, J and N
B1
(1)
Notes
b1B1: CAO (A, D, J and N)
Mark scheme (c)
Scheme
Marks
M1
A1
A1
A1
(4)
Notes
c1M1: At least twelve activities including at least six floats. A scheduling diagram only scores M0 – however, if a scheduling diagram appears after a Gantt chart then mark Gantt chart and isw their scheduling
c1A1: The critical activities dealt with correctly and appearing just once (A, D, J and N) and three non-critical activities dealt with correctly
c2A1: Any seven non-critical activities correct (this mark is not dependent on the previous A mark)
d1M1: Either a statement with the correct number of workers (4) and the correct activities (D, E, F and G) with any numerical time stated or the correct number of workers (4) and a correct time
d1A1: A completely correct statement with details of both time and activities. Candidates only need to give a time within the correct interval of \(11 \lt \text{time} \lt 12\). Please note the strict inequalities for the time interval (e.g. implying a time of 11 is incorrect). Answers given as an interval of time are acceptable provided the time interval stated is correct for all its possible values (e.g. ‘time 11 – 12’ is A0, ‘in the interval 11 – 12’ is A0 but ‘betweeen 11 and 12’ is A1). Allow for example, ‘on day 12’ as equivalent to \(11 \lt \text{time} \lt 12\)
(a) Draw the activity network described in the precedence table below, using activity on arc and exactly four dummies. (5)
Activity
Immediately preceding activities
A
–
B
–
C
–
D
A
E
D
F
A, B
G
A, B, C
H
A, B, C
I
E, F, G
J
E, F, G
K
E, F, G, H
Given that D is a critical activity,
(b) state which other activities must also be critical. (2)
Mark scheme (a)
Scheme
Marks
M1 (7 activities, 1 start + 2 dummies)
A1 (ABCD+1st 2 dummies)
A1 (EFGH)
A1 (IJK+3 dummy)
A1 (CSO)
(5)
Notes
Condone lack of, or incorrect, numbered events throughout. ‘Dealt with correctly’ means that the activity starts from the correct event but need not necessarily finish at the correct event, e.g. ‘G dealt with correctly’ requires the correct precedences for this activity, i.e. A, B and C labelled correctly and leading into the same node and G starting from that node but do not consider the end event for G. Activity on node is M0. Note that additional/unnecessary dummies that do not break the precedence condition can earn the first three A marks but will lose the final A mark (the CSO mark). However, additional unlabelled activities will lose the corresponding A marks if they effect the ‘dealt with correctly’ condition for other activities
If an activity, say C is not labelled (but the arc is present) then this will lose the first A mark and the final (CSO) A mark – they can still earn the second and third A marks on the bod.
Ignore lack of arrows on the activities for the first four marks only. If no arrows on any dummies then maximum mark in (a) is M1 only
a1M1: Seven activities (labelled on arc), one start and at least two dummies placed
a1A1: Activities A, B, C, 1st two dummies (including arrows on these two dummies) and D dealt with correctly. The first two dummies are those at the end of activities A and B
a2A1: Activities E, F, G and H dealt with correctly
a3A1: 3rd dummy (including arrow on this dummy at the end of activity F) and activities I, J and K dealt with correctly
a4A1: CSO (all previous marks must have been awarded) – final dummy correctly placed (+arrow), all arrows present, exactly four dummies correctly placed with one finish. Please check all arcs carefully for arrows
Note additional valid solutions:
the arrow on the final dummy between I and J reversed so that activity I will now end at the finish node
Activities I and J interchanged
A combination of both points above (i.e. I and J interchanged and the arrow on the dummy reversed)
Therefore it is vital that the diagram is checked carefully for these other equally acceptable/valid solutions
Mark scheme (b)
Scheme
Marks
Given that D is critical this implies that A and E are guaranteed to be critical
M1 A1
(2)
(7 marks)
Notes
b1M1: One correct activity with at most 4 activities stated (ignore any mention of D in this part)
A project is modelled by the activity network shown in Figure 6. The activities are represented by the arcs. The number in brackets on each arc gives the time, in days, to complete the corresponding activity. Each activity requires exactly one worker. The project is to be completed in the shortest possible time.
(a) Complete Diagram 1 in the answer book to show the early event times and the late event times. (4)
(b) Draw a Gantt chart for the project on the grid provided in the answer book. (4)
(c) State the activities that must be happening at time 18.5 (1)
An additional activity, P, is now included in the activity network shown in Figure 6. Activity P is immediately preceded only by activity D. No activity is dependent on the completion of activity P.
Each activity still requires exactly one worker and the revised project is to be completed in the shortest possible time.
(d) Explain, briefly, whether or not the revised project can be completed in the same time as the original project if the duration of activity P is
(i) 10 days
(ii) 17 days (2)
Mark scheme (a)
Scheme
Marks
M1
A1
M1
A1
(4)
Notes
a1M1: All top boxes complete, values in the top boxes generally increasing in the direction of the arrows (‘left to right’), condone one ‘rogue’ value (if values do not increase in the direction of the arrows then if one value is ignored and then the values do increase in the direction of the arrows then this is considered to be only one rogue value)
a1A1: CAO for the top boxes
a2M1: All bottom boxes complete, values generally decreasing in the opposite direction of the arrows (‘right to left’), condone one rogue. Condone missing 0 and/or 24 for the M only
a2A1: CAO for the bottom boxes
Mark scheme (b)
Scheme
Marks
M1
A1
A1
A1
(4)
Notes
Note that it is acceptable for the critical activities to appear on separate lines or for several activities to appear on the same line as long as their length and floats are clear and do not overlap
b1M1: At least ten activities including at least five floats. A scheduling diagram scores M0
b1A1: The critical activities dealt with correctly and appearing just once (C, D, G, I and J) and three non-critical activities dealt with correctly
b2A1: Any six non-critical activities correct (this mark is not dependent on the previous A mark)
b3A1: CSO – completely correct Gantt chart (exactly fourteen activities appearing just once – ignore any inclusion of activity P)
Mark scheme (c)
Scheme
Marks
(Activities) J and L (must be happening at time 18.5)
B1
(1)
Notes
c1B1: CAO (with no additional activities)
Mark scheme (d)
Scheme
Marks
The earliest that P can start is at time 9 (the time that the critical activity D must be finished by) – if the duration of P is 10 then the earliest P can finish is 19 < 24 and so the second project can be completed on time. If the duration of P is 17 days then the earliest P can finish is 26 > 24 and so the second project cannot be completed on time
B1 B1
(2)
(11 marks)
Notes
Both marks in (d) are dependent on the correct early event time (of 9) at the end of D and the correct late event time (of 24) at the end of N
d1B1: ‘yes’ (or clearly implied) and mention of 9 and 10 or 19 or a float (oe) of 5 - but not simply ‘it will finish before the end of the project’ (their answer must contain some form of mathematical argument)
d2B1: ‘no’ (or clearly implied) and mention of 9 and 17 or 26 or a delay (oe) of 2 – but not simply ‘it will finish late’ (their answer must contain some form of mathematical argument)
The network in Figure 6 shows the activities that need to be undertaken by a company to complete a project. Each activity is represented by an arc and the duration, in days, is shown in brackets. Each activity requires exactly one worker. The early event times and late event times are shown at each vertex.
Given that the total float on activity D is 1 day,
(a) find the values of \(w\), \(x\), \(y\) and \(z\). (3)
(b) On Diagram 1 in the answer book, draw a cascade (Gantt) chart for the project. (4)
(c) Use your cascade chart to determine a lower bound for the minimum number of workers needed to complete the project in the shortest possible time. You must make specific reference to times and activities. (2)
It is decided that the company may use up to 36 days to complete the project.
(d) On Diagram 2 in the answer book, construct a scheduling diagram to show how the project can be completed within 36 days using as few workers as possible. (3)
Mark scheme (a)
Scheme
Marks
\(w = 11,\ x = 21,\ y = 17,\ z = 4\)
B3, 2, 1, 0
(3)
Notes
a1B1: Any two values correct (it must be clear which value corresponds to which letter)
a2B1: Any three values correct
a3B1: All four values correct
Mark scheme (b)
Scheme
Marks
M1
A1
M1
A1
(4)
Notes
b1M1: At least 10 activities including 6 floats. A scheduling diagram scores M0
b1A1: Critical activities dealt with correctly and five other non-critical activities dealt with correctly
b2M1: Exactly 14 activities (just once) including all 10 floats (on the correct non-critical activities) – this mark is not dependent on the previous A mark
b2A1: CAO
Mark scheme (c)
Scheme
Marks
At time 12.5, activities H, D, G, I and J must all be happening so 5 workers
M1 A1
(2)
Notes
c1M1: A statement with the correct number of workers (5) and the correct activities (H, D, G, I and J) with any mention of time (need not be correct)
c1A1: A correct, complete statement with details of both time (\(12 \lt \text{time} \lt 13\)) and activities. Allow ‘on day 13’ or ‘during day 13’ as equivalent to this time interval but not ‘at day 13’ – note strict inequality for the time, for example, at time 12 is A0. Accept the time interval ‘\(12 \lt \text{time} \lt 13\)’ for this mark or a time that implies a time strictly between \(t = 12\) and \(t = 13\)
Mark scheme (d)
e.g.
Scheme
Marks
M1
A1
A1
(3)
(12 marks)
Notes
d1M1: Not a cascade chart. At most 4 workers used and at least 12 activities placed. The completion time must be no greater than 36
d1A1: 3 workers. All 14 activities present (just once). Condone two errors either precedence or activity duration. The completion time must be no greater than 36 – see table below for IPA and duration for each activity. One activity can give rise to at most two errors; one on duration and one on IPA
d2A1: 3 workers. All 14 activities present (just once). No errors. The completion time must be 36
2. Draw the activity network described in the precedence table below, using activity on arc and exactly three dummies. (5)
Activity
Immediately preceding activities
A
–
B
–
C
A
D
A
E
B
F
B
G
A, E, F
H
F
I
C
J
D, G
K
D, G
Mark scheme
Scheme
Marks
M1 (7 activities, 1 start and 2 dummies)
A1 (ABCDEF)
A1 (GH + first two dummies)
A1 (IJK)
A1 CSO
(5 marks)
Notes
Condone lack of, or incorrect, numbered events throughout and arcs which cross one another. ‘Dealt with correctly’ means that the activity starts from the correct event but need not necessarily finish at the correct event, e.g. ‘J dealt with correctly’ requires the correct precedences for this activity, i.e. D and G labelled correctly and leading into the same node and J starting from that node but not necessarily J leading into the end node. Activity on node is M0
Ignore incorrect or lack of arrows on the activities for the first four marks only
1M1: 7 activities (labelled on arc), one start and two dummies placed
1A1: Activities A, B, C, D, E and F dealt with correctly
2A1: Activities G, H and the first two dummies (including arrows on these two dummies) dealt with correctly. By ‘first two dummies’ these are the ones leading into the event at the end of E
3A1: Activities I, J and K dealt with correctly
4A1: CSO (all four previous marks must have been awarded) – final dummy correctly placed, all arrows present and correctly placed with one finish and no additional dummies. Please check all arcs carefully for arrows
Note that there are a number of additional valid solutions in which the candidate may finish their network diagram which are different (but are equivalent) to the example given above:
e.g.
the arrow on the final dummy between J and K reversed so that activity H will now end at the finish node
Activities J and K interchanged
A combination of both points above (i.e. J and K interchanged and the arrow on the dummy reversed)
Activity H leading directly into the finish node
Therefore it is vital that the diagram is checked carefully for these other equally acceptable/valid solutions
The table shows the activities required for the completion of a building project. For each activity the table shows the time taken, in days, and the immediately preceding activities. Each activity requires one worker. The project is to be completed in the shortest possible time.
Figure 6
Figure 6 shows a partially completed activity network used to model the project. The activities are represented by the arcs and the numbers in brackets on the arcs are the times taken, in days, to complete each activity.
(a) Add activities, E, F and I, and exactly one dummy to Diagram 1 in the answer book. (3)
(b) Complete Diagram 1 in the answer book to show the early event times and late event times. (4)
(c) Calculate a lower bound for the number of workers needed to complete the project in the shortest possible time. You must show your working. (2)
(d) Schedule the activities, using the minimum number of workers, so that the project is completed in the minimum time. (4)
Mark scheme (a)
Scheme
Marks
B1
B1
B1
(3)
Notes
a1B1: Any two of the four arcs (E, F, I or the dummy) drawn correctly (from correct vertex to correct vertex) – activities must be labelled with the correct letter (but condone no weights or arrows) and the dummy must be shown as a dashed line (but condone no arrow)
a2B1: All four arcs (E, F, I and the dummy) drawn correctly – must be labelled with the correct letter (but condone no weight or arrows) and the dummy must be shown as a dashed line (but condone no arrow)
a3B1: CAO – all three activities (E, F and I) and the one dummy drawn correctly – activities must be labelled with the correct letter and the activities and dummy must have the correct arrows (do check carefully that all arrows are present) but condone lack of (or incorrect) weights on the activity arcs
Mark scheme (b)
Scheme
Marks
M1
A1
M1
A1
(4)
Notes
In (b) the M marks are dependent on scoring at least the first mark in (a)In (b) the A marks are dependent on scoring at least the first two marks in (a)
b1M1: All top boxes complete (condone lack of 0 for the M mark only), values generally increasing in the direction of the arrows (‘left to right’), condone one ‘rogue’ value (if values do not increase in the direction of the arrows then if one value is ignored and the remaining values do increase in the direction of the arrows then this is considered to be a single rogue value). Note that all values in the top boxes could be incorrect but it can still score the M mark if the values are increasing in the way stated above – this mark is dependent on the first mark having being awarded in (a)
b1A1: CAO – all values correct in the top boxes – this mark is dependent on the first two marks having being awarded in (a)
b2M1: All bottom boxes complete (condone lack of 39 and/or 0 for the M mark only), values generally decreasing in the opposite direction of the arrows (‘right to left’), condone one ‘rogue’ – this mark is dependent on the first mark having being awarded in (a)
b2A1: CAO – all values correct in the bottom boxes – this mark is dependent on the first two marks having being awarded in (a)
Mark scheme (c)
Scheme
Marks
Lower bound = \(\frac{92}{39}\) =2.35… so 3 workers
M1 A1
(2)
Notes
c1M1: Attempt to find lower bound: (a value in the interval [80 – 104] / their finish time) or (sum of the activities / their finish time) or (as a minimum) an awrt 2.4
c1A1: CSO – either a correct calculation seen or awrt 2.4 then 3. An answer of 3 with no working scores M0A0
Mark scheme (d)
e.g.
Scheme
Marks
M1
A1
A1
A1
(4)
(13 marks)
Notes
d1M1: Not a cascade (Gantt) chart. 4 ‘workers’ used at most and at least 8 activities placed
d1A1: The critical (C, H, J, L) activities and A, B and D correct. A must be completed by its late finish time (22), B must be completed by its late finish time (13) and D must start after A and finish before its late finish time (32)
Activity
Duration
Time interval
IPA
C
8
0 – 8
-
H
9
8 – 17
C
J
12
17 – 29
H
L
10
29 – 39
J
A
5
0 – 22
-
B
7
0 – 13
-
D
5
5 – 32
A
Now check the last 5 activities – the last two marks are for E, F, G, I and K only
First check that there are only three workers and that all 12 activities are present (just once)
Then check precedences (see table below) – each row of the table could give rise to 1 error only in precedences
Finally check the length of each activity and the time interval in which the activity must take place (interval is inclusive)
Activity
Duration
Time interval
IPA
E
7
5 – 29
A
F
10
8 – 29
B, C
G
4
8 – 17
B, C
I
8
17 – 29
G, H
K
7
10 – 39
D
d2A1: 3 workers. All 12 activities present (just once). Condone one error either precedence or time interval or activity length, on activities E, F, G, I and K only (note: one activity could have more than one error, for example, activity G could have an error in duration and an error in IPA – this is two errors not one)
d3A1: 3 workers. All 12 activities present (just once). No errors on activities E, F, G, I and K
A project is modelled by the activity network shown in Figure 5. The activities are represented by the arcs. The number in brackets on each arc gives the time, in days, to complete the activity. Each activity requires one worker. The project is to be completed in the shortest possible time.
(a) Complete Diagram 1 in the answer book to show the early event times and late event times. (4)
(b) Calculate the total float for activity D. You must make the numbers you use in your calculation clear. (2)
(c) Calculate a lower bound for the number of workers needed to complete the project in the minimum time. You must show your working. (2)
The project is to be completed in the minimum time using as few workers as possible.
(d) Schedule the activities using Grid 1 in the answer book. (3)
Mark scheme (a)
Scheme
Marks
M1 A1
M1 A1
(4)
Notes
a1M1: All top boxes complete, values generally increasing left to right, condone one rogue.
a1A1: CAO
a2M1: All bottom boxes complete, values generally decreasing right to left, condone one rogue. Condone missing 0 or 22 for the M only.
a2A1: CAO
Mark scheme (b)
Scheme
Marks
Total float for D = 12 – 4 – 4 = 4
M1 A1
(2)
Notes
b1M1: Correct calculation for their activity D seen – their three numbers correct. Final value must be non-negative.
b1A1: CAO – no ft on this mark. The answer of 4 (with no working) scores no marks.
Mark scheme (c)
Scheme
Marks
\(\dfrac{52}{22} \approx 2.36\) so 3 workers
M1 A1
(2)
Notes
c1M1: Attempt to find lower bound: [42-62 / their finish time].
c1A1: CAO – correct calculation seen then 3. No working scores M0 A0.
Mark scheme (d)
e.g.
Scheme
Marks
M1
A1
A1
(3)
(11 marks)
Notes
d1M1: Not a cascade chart. 3 ‘workers’ used at most and at least 7 activities placed.
d2A1: 3 workers. All 11 activities present (just once). Condone one error either precedence, time interval or activity length.
d3A1: 3 workers. All 11 activities present (just once). No errors.
In (i) condone lack of, or incorrect, numbered events throughout – also ‘dealt with correctly’ means that the activity starts from the correct event but not necessarily finishes at the correct event. Activity on node is M0.
Ignore incorrect or lack of arrows for the first four marks in (i) only.
1M1: 7 activities (labelled on arc) and one dummy placed.
1A1: One start + activities A, B, C and E dealt with correctly.
2A1: Activities D, F and G and the 1st dummy dealt with correctly.
3A1: Activities I, H and J and the 2nd dummy dealt with correctly.
4A1: CSO – all arrows present and correctly placed with one finish.
Mark scheme (ii)
Scheme
Marks
1st dummy – G depends on A only, but D depends on A and C.
B1
2nd dummy – This is so that H and I will not share the same start and end events or so that H and I can be uniquely described in terms of their end events.
B1
(7 marks)
Notes
1B1: CAO - all relevant activities must be referred to – so activities D, G, A and C must all be mentioned for this mark
2B1: CAO – please note that e.g. ‘so that activities can be defined uniquely’ is not sufficient to earn this mark. There must be mention of describing activities uniquely in terms of the event at each end. However, give bod on statements that imply that an activity begins at ends at the same event.
(a) In the context of critical path analysis, define the term ‘total float’. (2)
Figure 3
Figure 3 is the activity network for a building project. The activities are represented by the arcs. The number in brackets on each arc gives the time, in days, to complete the activity. Each activity requires exactly one worker. The project is to be completed in the shortest possible time.
(b) Complete Diagram 1 in the answer book to show the early event times and the late event times. (3)
(c) State the critical activities. (1)
(d) Calculate the maximum number of days by which activity G could be delayed without affecting the shortest possible completion time of the project. You must make the numbers used in your calculation clear. (2)
(e) Calculate a lower bound for the number of workers needed to complete the project in the minimum time. You must show your working. (2)
The project is to be completed in the minimum time using as few workers as possible.
(f) Schedule the activities using Grid 1 in the answer book. (4)
Mark scheme (a)
Scheme
Marks
The total float \(F(i, j)\) of activity \((i, j)\) is defined to be \(F(i, j) = l_j - e_i -\) duration \((i, j)\), where \(e_i\) is the earliest time for event \(i\) and \(l_j\) is the latest time for event \(j\) (see note below)
B2,1,0
(2)
Notes
a1B1 For the first mark: the idea that total float is ‘how long an activity can be delayed for’. Give bod.
a2B1 For both marks: A clear correct statement e.g. the total amount of time that an activity may be delayed from its early start without delaying the project finish time. The candidate must clearly demonstrate a knowledge that total float = latest finish – earliest start – duration of activity. Ignore comments that infer that total refers to the sum of the floats for all activities in an activity network. Note that B1B0 should be awarded for an answer that has the pertinent idea of ‘float’ (see a1B1 above) and B1B1 for a clear correct statement (see a2B1 above) – B0B1 cannot be awarded in this part.
Mark scheme (b)
Scheme
Marks
M1 A1 A1
(3)
Notes
b1M1 All top boxes and all bottom boxes completed. Values generally increasing from left to right (for top boxes) and values generally decreasing from right to left (for bottom boxes) . Condone missing 0 or 30 for M only (for bottom boxes). Condone one rogue value in top boxes and one rouge value in bottom boxes (if values do not increase from left to right (or decrease right to left) then if one value is ignored and then the values do increase from left to right (or decrease right to left) then this is considered to be one rogue value).
b1A1 CAO for top boxes.
b2A1 CAO for bottom boxes.
Mark scheme (c)
Scheme
Marks
Critical activities: A C J M
B1
(1)
Notes
c1B1 CAO
Mark scheme (d)
Scheme
Marks
G can be delayed by 21 – 11 – 3 = 7 (days)
M1 A1
(2)
Notes
d1M1 Correct calculation for their activity G seen - all three numbers correct (ft). Final value must be non-negative.
d1A1 CAO (no follow through on this A mark). Answer of 7 with no working scores no marks in this part.
Mark scheme (e)
Scheme
Marks
\(\dfrac{69}{30} = 2.3\) so lower bound is 3 workers
M1 A1
(2)
Notes
e1M1 Attempt to find lower bound [59 – 79 / their finish time]
e1A1 CAO – correct calculation seen then 3. [As 30/13 also gives 3, an answer of 3 with no working scores M0A0.]
Mark scheme (f)
Scheme
Marks
e.g.
M1 A1 A1 A1
(4)
(14 marks)
Notes
f1M1 Not a cascade chart. 4 ‘workers’ used at most and at least 8 activities placed.
f1A1 The critical (A, C, J, M) activities and B and D correct A – 4, C – 7, J – 10, M – 9, B – 5, D – 9. B must be completed by its late finish time (11) and D must start after A and finishing before its late finish time (15).
Now check the last 7 activities – the last two marks are for E, F, G, H, I, K and L only
First check that there are only three workers and that all 13 activities are present (just once).
Then check precedences (see table below) – each row of the table could give rise to 1 error only in precedences
Finally check the length of each activity and the time interval in which the activity must take place (interval is inclusive).
Activity
Duration
Time interval
IPA
E
6
4 – 17
A
F
2
13 – 17
D
G
3
11 – 21
B, C
H
3
13 – 21
D
I
4
15 – 21
E, F
K
5
14 – 30
G
L
2
14 – 30
G
f2A1 3 workers. All 13 activities present (just once). Condone one error either precedence, time interval or activity length, on activities E, F, G, H, I, K and L only.
f3A1 3 workers. All 13 activities present (just once). No errors on activities E, F, G, H, I, K and L.
(a) Draw the activity network described in the precedence table below, using activity on arc and exactly two dummies. (5)
Activity
Immediately preceding activities
A
–
B
–
C
–
D
A, B
E
C
F
A, B
G
A, B
H
E, F
I
D
J
D, G
K
H
(b) Explain why each of the two dummies is necessary. (2)
Mark scheme (a)
Scheme
Marks
M1 A1 A1 A1 A1
(5)
Notes
Throughout part (a) condone lack of numbered events throughout – also ‘dealt with correctly’ means that the activity starts from the correct event (but not necessarily finishing at the correct event) e.g. ‘H dealt with correctly’ requires F and E leading into the same event and H starting from that event (but not necessarily H leading into K). Activity on node is M0.
a1M1 7 activities and one dummy placed.
a1A1 One start + activities A, B, C and E dealt with correctly.
a2A1 Activities D, F, G, H and K and the 1st dummy dealt with correctly.
a3A1 Activities I and J and the 2nd dummy dealt with correctly.
a4A1 CSO (all four previous marks must have been awarded) - all arrows present and correctly placed with one finish – condone lack of arrows for the first four marks only. No ‘extra’ activities.
Note that another valid solution would be the dummy going from event 3 to event 2 and D, G and F coming out of event 2. Or the candidate could start with a dummy from event 1 to ensure the uniqueness of activities A and B.
Mark scheme (b)
Scheme
Marks
1st dummy – A and B both must be able to be described uniquely in terms of the events at each end.
B1
2nd dummy – I depends on D only but J depends on D and G.
B1
(2)
(7 marks)
Notes
b1B1 CAO – with no incorrect terminology (e.g. event for activity) - please note that e.g. ‘so that activities can be defined uniquely’ is not sufficient to earn this mark. There must be a mention of describing activities uniquely in terms of the events at each end. However give bod on statements that imply that an activity begins and ends at the same event e.g. ‘so that activites do not have the same start and finish’ is sufficient for B1.
b2B1 CAO – all relevant activities must be referred to – so activities D, G, I and J must all be mentioned for this mark.
A project is modelled by the activity network shown in Figure 3. The activities are represented by the arcs. The number in brackets on each arc gives the time, in days, to complete the activity. Each activity requires one worker. The project is to be completed in the shortest possible time.
(a) Complete Diagram 1 in the answer book to show the early event times and late event times. (4)
(b) Calculate the total float for activity H. You must make the numbers you use in your calculation clear. (2)
(c) Calculate a lower bound for the number of workers needed to complete the project in the shortest possible time. Show your calculation. (2)
Diagram 2 in the answer book shows a partly completed scheduling diagram for this project.
(d) Complete the scheduling diagram, using the minimum number of workers, so that the project is completed in the minimum time. (4)
Mark scheme (a)
Scheme
Marks
M1 A1 M1 A1
(4)
Notes
a1M1All top boxes complete, values generally increasing left to right, condone one rogue.
a1A1 CAO.
a2M1 Bottom boxes complete, values generally decreasing right to left, condone one rogue. Condone missing 0 or 37 for the M mark only.
a2A1 CAO
Mark scheme (b)
Scheme
Marks
Total float on H = 20 – 9 – 5 = 6
M1 A1
(2)
Notes
b1M1 Correct calculation seen. All three numbers correct (ft).
b1A1 Float correct (no follow through on this mark)
Mark scheme (c)
Scheme
Marks
93/37 = 2.5135 so 3 (workers)
M1 A1
(2)
Notes
c1M1 Attempt to find lower bound. [82 – 104 / their finish time] accept awrt 2.5
c1A1 CAO – correct calculation seen or awrt 2.5, then 3. (Beware 37/13 gives 3 also, so 3 with no working gets M0A0.)
Mark scheme (d)
Scheme
Marks
M1 A1 M1 A1
(4)
(12 marks)
Notes
d1M1 Not a cascade chart. 4 workers used at most. At least 8 new (10 in total) activities placed.
d1A1 The critical activities (F I K M) and B correct. F – 8; I – 9; K – 5; M – 6; B – 7. B completed by 9 (its late finish time).
Now check the last 6 activities – the last two marks are for D, E, G, H, J and L only
First check that there are only three workers and that all 11 new (13 in total) activities are present (just once).
Then check precedences (see table below) – each row of the table could give rise to 1 error only in precedences
Finally check the length of each activity (see number in brackets in the activity column in the table below)
Activity
I.P.A
Activity
I.P.A
A (8)
-
H (5)
C
B (7)
-
I (9)
E F
C (9)
-
J (11)
G H
D (9)
A
K (5)
D I
E (5)
A
L (4)
D I
F (8)
B C
M (6)
E F J K
G (7)
B C
d2M1 3 workers. All 11 new (13 in total) activities present (just once). Condone one error either precedence, or activity length, on activities D, E, G, H, J and L.
d2A1 3 workers. All 11 new (13 in total) activities present (just once). No errors on activities D, E, G, H, J and L.
[The sum of the duration of all activities is 172 days]
A project is modelled by the activity network shown in Figure 5. The activities are represented by the arcs. The number in brackets on each arc gives the time, in days, to complete the activity. Each activity requires one worker. The project is to be completed in the shortest possible time.
(a) Complete Diagram 1 in the answer book to show the early event times and late event times. (4)
(b) Calculate the total float for activity M. You must make the numbers you use in your calculation clear. (2)
(c) For each of the situations below, explain the effect that the delay would have on the project completion date.
(i) A 2 day delay on the early start of activity P.
(ii) A 2 day delay on the early start of activity Q. (2)
(d) Calculate a lower bound for the number of workers needed to complete the project in the shortest possible time. (1)
Diagram 2 in the answer book shows a partly completed cascade chart for this project.
(e) Complete the cascade chart. (4)
(f) Use your cascade chart to determine a second lower bound on the number of workers needed to complete the project in the shortest possible time. You must make specific reference to times and activities. (2)
(g) State which of the two lower bounds found in (d) and (f) is better. Give a reason for your answer. (2)
Mark scheme (a)
Scheme
Marks
M1 A1 M1 A1
(4)
Notes
a1M1 All top boxes complete, values generally increasing left to right, condone one ‘rogue’ (if values do not increase from left to right then if one value is ignored and then the values do increase from left to right then this is considered to be only one rogue value)
a1A1 CAO.
a2M1 All bottom boxes complete, values generally decreasing right to left, condone one ‘rogue’.
a2A1 CAO
Mark scheme (b)
Scheme
Marks
Float on M = 42 – 26 – 8 = 8
M1 A1
(2)
Notes
b1M1 Correct calculation seen – all three numbers correct (ft), float \(\geqslant 0\).
b1A1 Float correct (no ft on this mark)
Mark scheme (c)
Scheme
Marks
(c)(i) 2 day delay on P – no effect on the project completion date (float on P is 4)
B1
(c)(ii) 2 day delay on Q – project finishes 2 days late (Q is a critical activity)
B1
(2)
Notes
c1B1 CAO
c2B1 CAO
Mark scheme (d)
Scheme
Marks
(172/53 = 3.245, so) a minimum of 4 workers needed
B1
(1)
Notes
d1B1 4 with (or without) working scores this mark
Mark scheme (e)
Scheme
Marks
M1 A1 (any 6 more) M1 A1 (all 11)
(4)
Notes
e1M1 At least six activities added including six floats. Scheduling diagram scores M0.
e1A1 Six activities including their floats dealt with correctly.
e2M1 All remaining eleven activities including all eleven floats.
e2A1 CAO.
Mark scheme (f)
Scheme
Marks
E.g. Activities H, I, J, K and L together with \(22 \lt \text{time} \lt 26\) stated. So 5 workers needed
M1 A1
(2)
Notes
Examples for part (f):
Example 1: Activities H, I, J, K and L with \(22 \lt \text{time} \lt 26\) so 5 workers needed.
Example 2: At \(10 \lt \text{time} \lt 14\), F, D, E and H must be happening. Activity G must be happening \(7 \lt \text{time} \lt 18\) but its duration is 5 so it must also occur at some point in the interval \(10 \lt \text{time} \lt 14\) so 5 workers needed.
f1M1 Example 1: A statement with the correct number of workers (5) and the correct activities (H, I, J, K and L) with some mention of time, or Example 2: A statement with the correct number of workers (5), the correct activities (F,D,E and H) with some mention of time and an indication that G must be happening with the other four activities at some point - give bod but e.g. ‘at time 11 F, D, E, G and H must be happening’ is M0). Scheduling the activities only scores M0.
f1A1 A correct, complete full statement with details of both time and activities. Candidates only need to give a time within the intervals stated. Please note strict inequalities for the time. Allow e.g. on ‘day 23’ as equivalent to \(22 \lt \text{time} \lt 23\).
Mark scheme (g)
Scheme
Marks
The cascade gives a higher lower bound, so (f) is better.
M1 A1
(2)
(17 marks)
Notes
g1M1 Must have attempted both parts (d) and (f). Their higher lower bound chosen + attempt at a reason. Allow for the M mark a reason which argues that e.g. the cascade chart gives a better lower bound (e.g. it takes into account exactly when activities must be taking place) or e.g. the calculation gives a better lower bound (e.g. as it takes into account the sum of all the activities) but without specifically answering the question of which of the two bounds is better. Give bod on an attempt at a reason.
g1A1 CAO plus a correct reason given. Acceptable reasons e.g. the cascade gives a larger value or the bound for the cascade shows that the project cannot be done with fewer workers, etc.
Figure 7 is the activity network relating to a building project. The activities are represented by the arcs. The number in brackets on each arc gives the time to complete the activity. Each activity requires one worker.
The project must be completed in the shortest possible time.
(a) Explain the reason for the dotted line from event 4 to event 6 as shown in Figure 7. (2)
(b) Complete Diagram 1 in the answer book to show the early event times and the late event times. (4)
(c) State the critical activities. (1)
(d) Calculate the total float for activity G. You must make the numbers you use in your calculation clear. (2)
(e) Draw a Gantt chart for this project on the grid provided in the answer book. (4)
(f) State the activities that must be happening at time 5.5 (1)
(g) Use your Gantt chart to determine the minimum number of workers needed to complete the project in the minimum time. You must justify your answer. (2)
Mark scheme (a)
Scheme
Marks
Activity K depends on activities E, F and B, but activity I depends on F and B only.
B2, 1, 0
(2)
Notes
a1B1 K, I, E and at least one of B or F referred to. Correct statement but may be incomplete give bod here.
a2B1 Clear correct statement no bod (at least one of only B or F referred to can score this mark).
Mark scheme (b)
Scheme
Marks
M1 A1 M1 A1
(4)
Notes
b1M1 All top boxes complete, values generally increasing left to right, condone one ‘rogue’ (if values do not increase from left to right then if one value is ignored and then the values do increase from left to right then this is considered to be only one rogue value).
b2A1 CAO
b2M1 All bottom boxes complete, values generally decreasing right to left, condone one rogue. Condone missing 0 or 21 for the M only.
b2A1 CAO
Mark scheme (c)
Scheme
Marks
Critical activities are: A, F, I, L
B1
(1)
Notes
c1B1 CAO
Mark scheme (d)
Scheme
Marks
Total float on G = 15 – 6 – 6 = 3
M1 A1
(2)
Notes
d1M1 Correct calculation seen, all three numbers correct (ft), float \(\geqslant 0\)
d1A1 CAO (no ft on this mark)
Mark scheme (e)
Scheme
Marks
M1 A1 A1 A1
(4)
Notes
e1M1 At least 9 activities including at least 5 floats. Scheduling diagram scores M0.
e1A1 The correct critical activities dealt with correctly
e2A1 All correct non-critical activities present with floats with 5 non-critical activities correct
e3A1 All 9 non-critical activities correct
Mark scheme (f)
Scheme
Marks
Activities A, C and D must be happening at time 5.5
B1
(1)
Notes
f1B1 CAO
Mark scheme (g)
Scheme
Marks
E.g. Activities F, B, C and G together with \(9 \lt \text{time} \lt 10\) stated
M1
So 4 workers are needed
A1
(2)
(16 marks)
Notes
g1M1 A statement with the correct number of workers and details of either time or activities correct. If no part of their statement is correct then allow M mark (only) on the ft with time and activities from their 13 activity, 9 float diagram. Scheduling the activities only or a lower bound calculation argument scores M0.
g1A1 A correct, complete full statement details of time and activities (The two options are F, B, C and G with \(9 \lt \text{time} \lt 10\) or F, C, G and H with \(10 \lt \text{time} \lt 11\)). Please note strict inequalities for the time. Allow e.g. on ‘day 10’ as equivalent to \(9 \lt \text{time} \lt 10\).
Figure 5 is the activity network relating to a development project. The activities are represented by the arcs. The number in brackets on each arc gives the time, in days, to complete the activity. Each activity requires one worker. The project is to be completed in the shortest possible time.
(a) Complete the precedence table in the answer book. (2)
(b) Complete Diagram 1 in the answer book to show the early event times and late event times. (4)
(c) Calculate the total float for activity E. You must make the numbers you use in your calculation clear. (2)
(d) Calculate a lower bound for the number of workers needed to complete the project in the minimum time. You must show your working. (2)
(e) Schedule the activities using the minimum number of workers so that the project is completed in the minimum time. (4)
Mark scheme (a)
Scheme
Marks
Act.
I.P.A.
Act.
I.P.A.
Act.
I.P.A
A
-
E
A
I
D F
B
-
F
B E
J
C D F G
C
-
G
B E
K
H
D
A
H
C
B2, 1, 0
(2)
Notes
a1B1 Any 3 rows completed correctly
a1B2 All five rows completed correctly
Mark scheme (b)
Scheme
Marks
1M1 1A1
2M1 2A1
(4)
Notes
b1M1 All top boxes complete, values generally increasing left to right, condone one rogue
b1A1 CAO
b2M1 All bottom boxes complete, values generally decreasing R to L, condone one rogue. Condone missing 0 or 28 for the M only.
b2A1 CAO
Mark scheme (c)
Scheme
Marks
Total float on E = 21 – 5 – 3 = 13
M1 A1
(2)
Notes
c1M1 Correct calculation seen all three numbers correct (ft). Float \(\geqslant 0\).
c1A1 CAO
Mark scheme (d)
Scheme
Marks
\(\dfrac{62}{28} = 2.21\) so lower bound is 3 workers
M1 A1
(2)
Notes
d1M1 Attempt to find lower bound. [52-72 / their finish time] accept awrt 2.2.
d1A1 CAO – correct calculation seen or awrt 2.2, then . [Beware 28/11 gives 3 also, so 3 with no working gets M0A0.]
Mark scheme (e)
Scheme
Marks
1M1 1A1
2A1 3A1
(4)
(14 marks)
Notes
e1M1 Not a cascade chart. 4 ‘workers’ used at most. At least 7 activities. If in doubt send to review.
e1A1 CHKAB correct. C- 14; H – 10; K – 4; A – 5; B – 9. A and B completed by their late finish times. (A by time = 18 B by time = 21).
Now you need to check the last 6 activites – the last two marks are for D, E, F, G, I, J only
First check that they have only used three workers and that all 11 activities are present (just once).
Then check precedences: You have these on the mark scheme in (a). Each row of the table in (a) could give rise to 1 error (only) I’d suggest you check these ones first since they are most likely to generate errors.
F must not start until after B and E are complete.
G must not start until after B and E are complete.
J must not start until after C, D, F are complete.
I must not start until after D and F are completed
You need to check the others too of course. Finally you need to check the length of each activity. Length 5 - A, I Length 4 – D Length 3 – E, G, J Length 2 – F Length 9 – B
e2A1 3 workers. All 11 activities present (just once). Condone one error either precedence, or activity length, on activities D, E, F, G I, J.
e3A1 3 workers. All 11 activities present (just once). No errors on activities D, E, F, G I, J.
Please use the pen or highlighter tool to indicate any errors to your team leader. Usually we use a vertical line to indicate precedence errors, indicating the overlap, and a horizontal line to indicate an activity of incorrect length.
A project is modelled by the activity network shown in Figure 7. The activities are represented by the arcs. The number in brackets on each arc gives the time required, in hours, to complete the activity. The numbers in circles are the event numbers. Each activity requires one worker.
(a) Explain the significance of the dummy activity
(i) from event 4 to event 6,
(ii) from event 5 to event 7
(3)
(b) Calculate the early time and the late time for each event. Write these in the boxes in the answer book. (4)
(c) Calculate the total float on each of activities D and G. You must make the numbers you use in your calculations clear. (3)
(d) Calculate a lower bound for the minimum number of workers required to complete the project in the minimum time. (2)
(e) On the grid in your answer book, draw a cascade (Gantt) chart for this project. (4)
Mark scheme (a)
Scheme
Marks
(i) I depends on B, E and F only, K depends on B, E, F and D
B1 DB1
(ii) This is so that G and H will not share the same start and end events. So that G and H can be uniquely described in terms of their end events.
B1
(3)
Notes
ai1B1: K, I, D and at least one of B, E, F referred to. Correct statement but maybe incomplete give bod here.
ai2DB1: Clear correct statement. No bod.
aii3B1: correct statement referring to either events or activities. (‘unique’ alone not enough)
Mark scheme (b)
Scheme
Marks
M1 A1 M1 A1
(4)
Notes
b1M1: All top boxes complete, values generally increasing left to right, condone one rogue
b1A1: CAO
b2M1: All bottom boxes complete, values generally decreasing R to L, condone one rogue
b2A1: CAO
Mark scheme (c)
Scheme
Marks
Total float on D = 18 – 5 – 6 = 7 Total float on G = 17 – 4 – 7 = 6
M1 A1ft B1
(3)
Notes
c1M1: Correct calculation seen once, all three numbers correct (ft).
c1A1ft: one float ( \(\geqslant\) 0) correct.
c1B1: Both floats correct (independent of working)
Mark scheme (d)
Scheme
Marks
Lower bound = \(\dfrac{59}{21} = 3\) workers
M1 A1cso
(2)
Notes
d1M1: Attempt to calculate a lower bound. [51-67 / their finish time]. Accept awrt 2.81
d1A1: CSO.
Mark scheme (e)
Scheme
Marks
M1 A1 M1 A1
(4)
(16 marks)
Notes
e1M1: At least 7 activities including at least 4 floats. Do not accept scheduling diagram.
e1A1: Critical activities dealt with correctly
e2M1: All 11 activities including at least 8 floats
e2A1: Non-critical activities dealt with correctly
A project is modelled by the activity network shown in Figure 7. The activities are represented by the arcs. The number in brackets on each arc gives the time, in days, to complete the activity. Each activity requires one worker. The project is to be completed in the shortest possible time.
(a) Complete the precedence table in the answer book. (3)
(b) Complete Diagram 1 in the answer book, to show the early event times and late event times. (4)
(c) State the critical activities. (2)
(d) On the grid in your answer book, draw a cascade (Gantt) chart for this project. (4)
(e) By considering the activities that must take place between time 7 and time 16, explain why it is not possible to complete this project with just 3 workers in the minimum time. (3)
Mark scheme (a)
Scheme
Marks
Activity
Proceeded by
Activity
Proceeded by
Activity
Proceeded by
(A)
(-)
E
A B
I
C D E
(B)
(-)
(F)
(B)
J
C D E
C
A B
(G)
(B)
K
F H I
(D)
(B)
H
C D
L
F G H I
B3,2,1,0
(3)
Notes
(a)1B1 Any two rows correct
2B1 Any four rows correct
3B1 All seven rows correct
Mark scheme (b)
Scheme
Marks
M1 A1 M1 A1
(4)
Notes
(b)1M1 All top boxes complete, values generally increasing left to right, condone one rogue
1A1 CAO
2M1 All bottom boxes complete, values generally decreasing R to L, condone one rogue
2A1 CAO
Mark scheme (c)
Scheme
Marks
Critical activities are B D J H L
M1 A1
(2)
Notes
(c)M1 Accept dummies, repeats and condone one absence or one extra; or BDHL or BDJ
A1 CAO (dummies and repeats ok)
Mark scheme (d)
Scheme
Marks
M1 A1 M1 A1
(4)
Notes
(d)1M1 At least 9 activities including at least 4 floats. Do not accept scheduling diagram.
1A1 Critical activities dealt with correctly
2M1 All 12 activities including at least 7 floats
2A1 Non-critical activities dealt with correctly.
Mark scheme (e)
Scheme
Marks
E.g. Between time 7 and 16, 3 workers could do 3 x 9 = 27 days work. Activities C, D, E, F, G, H, I and 4 days of J need to be done This totals 31 days work. So it is not possible to complete the project with three workers.
B3,2,1,0
OR If three workers are used three activities H, J and I need to happen at time 13.5, this reduces the float on F and G, meaning that at 10.5 D, C, F and G need to be happening. Our initial assumption is incorrect hence four workers are needed.
(3)
(16 marks)
Notes
(e)1B1 Attempt at explanation – one correct idea.
2B1 Good explanation, some imprecise or vague statements – give bod
The network in Figure 7 shows the activities that need to be undertaken to complete a maintenance project. The activities are represented by the arcs. The number in brackets on each arc gives the time, in days, to complete the activity. The numbers in circles are the events.
Each activity requires one worker. The project is to be completed in the shortest possible time.
(a) Complete the precedence table for this network in the answer book. (3)
(b) Explain why each of the following is necessary.
(i) The dummy from event 6 to event 7.
(ii) The dummy from event 8 to event 9.
(3)
(c) Complete Diagram 2 in the answer book to show the early and the late event times. (4)
(d) State the critical activities. (2)
(e) Calculate the total float on activity K. You must make the numbers used in your calculation clear. (2)
(f) Calculate a lower bound for the number of workers needed to complete the project in the minimum time. (2)
Mark scheme (a)
Scheme
Marks
Activity
Immediately preceding activities
G
B, C
H
E, F
I
D, E, F
J
G, H
K
G, H, I
L
G, H, I
B3,2,1,0
(3)
Notes
1B1: Any two rows correct
2B1: Any 4 rows correct
3B1: all correct
Mark scheme (b)
Scheme
Marks
Dummy from 6 to 7 needed because K and L depend on G H and I, but J depends on G and H only. Dummy from 8 to 9 needed because no two activities may share both the same start event number and the same finish event number.
B3,2,1,0
(3)
Notes
1B1: first dummy (precedence) explained, maybe confused, be generous, give bod.
2B1: first dummy clearly explained – all relevant activities referred to. Must refer to K and/or L; H and/or G; I and J
3B1: second dummy (uniqueness) explained, maybe confused, be generous, give bod.
Mark scheme (c)
Scheme
Marks
M1 A1 M1 A1
(4)
Notes
1M1: All top boxes completed generally increasing left to right.(Condone one rogue)
1A1: cao.
2M1: All bottom boxes completed generally decreasing right to left. (Condone one rogue)
2A1: cao.
Mark scheme (d)
Scheme
Marks
Critical activities: A C \(\left\{\begin{matrix}\text{F H}\\ \text{G}\end{matrix}\right\}\) J
B2,1,0
(2)
Notes
1B1: Critical activities correct condone one omission or extra. SC allow ACGJ for B1 only
2B1: Critical activites cao
Mark scheme (e)
Scheme
Marks
Total float on activity K= 21 – 14 – 5 = 2
M1 A1ft
(2)
Notes
1M1ft: Correct calculation seen – all three numbers at least once.
1A1ft: Float correct >0
Mark scheme (f)
Scheme
Marks
Lower bound is \(\dfrac{54}{21} = 2.57 = 3\)
B1 B1ft
(2)
(16 marks)
Notes
1M1 = 1B: 3
1A1ft= 2B1ft:Correct calculation seen or ‘ 2< answer< 3
A project is modelled by the activity network shown in Figure 7. The activities are represented by the arcs. The number in brackets on each arc gives the time, in days, to complete the activity. Each activity requires one worker. The project is to be completed in the shortest possible time.
(a) Complete Diagram 2 in the answer book to show the early and late event times. (4)
(b) State the critical activities. (1)
(c) On Grid 1 in the answer book, draw a cascade (Gantt) chart for this project. (4)
(d) Use your cascade chart to determine a lower bound for the number of workers needed. You must justify your answer. (2)
Mark scheme (a)
Scheme
Marks
M1 A1 M1 A1
(4)
Notes
1M1: Top boxes completed generally increasing left to right.
1A1: CAO.
2M1: Bottom boxes completed generally decreasing right to left.
2A1: CAO.
Mark scheme (b)
Scheme
Marks
Critical activities: C E H J L
B1
(1)
Notes
1B1: Critical activities cao.
Mark scheme (c)
Scheme
Marks
M1 A1 A1 A1
(4)
Notes
1M1: At least 10 activities placed, at least five floats. Scheduling diagram gets M0.
1A1: my critical activities correct.
2A1: condone one error on my non-critical activities.
3A1: my non-critical activities correct.
Mark scheme (d)
Scheme
Marks
4 workers needed e.g. at time 8 ½ (noon on day 9) activities E, D, F and G must be happening.
B2, 1, 0
(2)
(11 marks)
Notes
1B1: A correct statement, details of either time (7<time<9, 8<day<10), or activities, bod gets B1. Allow 1 B mark (only) on ft from their 12 activity, 7 float diagram.
2B1: A correct, complete full statement details of time and activities.
Figure 5 is the activity network relating to a building project. The number in brackets on each arc gives the time taken, in days, to complete the activity.
(a) Explain the significance of the dotted line from event 2 to event 3. (2)
(b) Complete the precedence table in the answer booklet. (3)
(c) Calculate the early time and the late time for each event, showing them on the diagram in the answer booklet. (4)
(d) Determine the critical activities and the length of the critical path. (2)
(e) On the grid in the answer booklet, draw a cascade (Gantt) chart for the project. (4)
Mark scheme (a)
Scheme
Marks
The dotted line represents a dummy activity.
B1
It is necessary because C and D depend only on A, but E depends on A and B.
B1
(2)
Mark scheme (b)
Scheme
Marks
Activity
Immediately preceding activity
A
-
B
-
C
A
D
A
E
A,B
F
C (A)
G
C, D, E
H
F, G
B1 B1 B1
(3)
Notes
B1 To this point (A to D)
B1 For E & F, accepting correct “extra”
B1 Last two rows, correct only
Mark scheme (c)
Scheme
Marks
Early times
M1A1
Late times
M1A1
(4)
Mark scheme (d)
Scheme
Marks
Critical activities: B, E, G, H
B1
Critical path: 16 days
B1ft
(2)
Mark scheme (e)
Scheme
Marks
At least 6 activities placed including at least 3 floats
A construction project is modelled by the activity network shown in Figure 5. The activities are represented by the arcs. The number in brackets on each arc gives the time, in days, to complete the activity. Each activity requires one worker. The project is to be completed in the shortest possible time.
(a) Complete Diagram 2 in the answer book, showing the early and late event times. (4)
(b) State the critical activities. (1)
(c) Find the total float for activities M and H. You must make the numbers you use in your calculations clear. (3)
(d) On the grid provided, draw a cascade (Gantt) chart for this project. (4)
An inspector visits the project at 1pm on days 16 and 31 to check the progress of the work.
(e) Given that the project is on schedule, which activities must be happening on each of these days? (3)
The network in Figure 5 shows the activities involved in a process. The activities are represented by the arcs. The number in brackets on each arc gives the time, in days, taken to complete the activity.
(a) Calculate the early time and the late time for each event, showing them on the diagram in the answer book. (4)
(b) Determine the critical activities and the length of the critical path. (3)
(c) Calculate the total float on activities F and G. You must make the numbers you used in your calculation clear. (3)
(d) On the grid in the answer book, draw a cascade (Gantt) chart for the process. (4)
Given that each task requires just one worker,
(e) use your cascade chart to determine the minimum number of workers required to complete the process in the minimum time. Explain your reasoning clearly. (2)
Mark scheme (a)
Scheme
Marks
M1 A1 M1 A1
(4)
Mark scheme (b)
Scheme
Marks
A, I, K, M, N; Length 39
B2, 1, 0; B1
(3)
Mark scheme (c)
Scheme
Marks
Float on F is 34 – 15 – 15 = 4
M1 A1
Float on G is 24 – 15 – 3 = 6
B1
(3)
Mark scheme (d)
Scheme
Marks
M1 A1 M1 A1
(4)
Mark scheme (e)
Scheme
Marks
e.g. At time 14 ½ there are 4 tasks I, E, H and C must be happening.
The network in Figure 6 shows the activities that need to be undertaken to complete a building project. Each activity is represented by an arc. The number in brackets is the duration of the activity in days. The early and late event times are shown at each vertex.
(a) Find the values of \(v\), \(w\), \(x\), \(y\) and \(z\). (3)
(b) List the critical activities. (1)
(c) Calculate the total float on each of activities H and J. (2)
(d) Draw a cascade (Gantt) chart for the project. (4)
The engineer in charge of the project visits the site at midday on day 8 and sees that activity E has not yet been started.
(e) Determine if the project can still be completed on time. You must explain your answer. (2)
Given that each activity requires one worker and that the project must be completed in 35 days,
(f) use your cascade chart to determine a lower bound for the number of workers needed. You must justify your answer. (2)
Mark scheme (a)
Scheme
Marks
\(v = 16 \quad w = 25 \quad x = 23 \quad y = 20 \quad z = 8\)
B3, 2, 1, 0
(3)
Mark scheme (b)
Scheme
Marks
B C G L M Q
B1
(1)
Mark scheme (c)
Scheme
Marks
Float on H = 23ft − 19 − 3 = 1
B1
Float on J = 25 − 22 − 2 = 1
B1
(2)
Mark scheme (d)
Scheme
Marks
M1 A1 A1 A1
(4)
Mark scheme (e)
Scheme
Marks
E has one day of float, so project can still be completed on time.
B2, 1, 0
(2)
Mark scheme (f)
Scheme
Marks
e.g
At time 23 ½ activities L, I, J and N must be taking place
At time 13 ½ or 14 ½ activities C, D, E and F must be taking place
A project is modelled by the activity network shown in Figure 5. The activities are represented by the arcs. The number in brackets on each arc gives the time, in hours, to complete the activity. Some of the early and late times for each event are shown.
(a) Calculate the missing early and late times and hence complete Diagram 1 in your answer book. (4)
(b) Calculate the total float on activities D, G and I. You must make your calculations clear. (4)
(c) List the critical activities. (1)
Each activity requires one worker.
(d) Calculate a lower bound for the number of workers needed to complete the project in the minimum time. (2)
Mark scheme (a)
Scheme
Marks
M1 A1 M1 A1
(4)
Notes
Q4(a) 1M1 Top 3 boxes completed, generally ascending L to R
1A1 cao
2M1 Bottom 4 boxes completed, generally descending R to L
2A1 cao
Mark scheme (b)
Scheme
Marks
Total float on D = 18ft − 5 − 9 = 4ft G = 25 − 8 − 10 = 7 I = 25 − 20 − 3 = 2
M1 A2, 1ft, 0 B1
(4)
Notes
(b) 1M1 Correct (ft) three numbers visible for at least one calculation.
The network in Figure 5 shows the activities that need to be undertaken to complete a project. Each activity is represented by an arc. The number in brackets is the duration of the activity in days. The early and late event times are to be shown at each vertex and some have been completed for you.
(a) Calculate the missing early and late times and hence complete Diagram 2 in your answer book. (3)
(b) List the two critical paths for this network. (2)
(c) Explain what is meant by a critical path. (2)
The sum of all the activity times is 110 days and each activity requires just one worker.
The project must be completed in the minimum time.
(d) Calculate a lower bound for the number of workers needed to complete the project in the minimum time. You must show your working. (2)
(e) List the activities that must be happening on day 20. (2)
(f) Comment on your answer to part (e) with regard to the lower bound you found in part (d). (1)
(g) Schedule the activities, using the minimum number of workers, so that the project is completed in 30 days. (3)
Mark scheme (a)
Scheme
Marks
B3, 2, 1, 0
(3)
Mark scheme (b)
Scheme
Marks
A E H K
B2, 1, 0
A E L
(2)
Mark scheme (c)
Scheme
Marks
Idea of ‘critical’ – zero float, no delay, immediate – if late project will finish late etc.
B1
Idea of ‘path’ – from start to end event + continuous – the event forming end of one activity forms the start of the next – sequence or series or link or run …
It will not be possible to find a solution with 4 workers to complete the project in the minimum time. 5 workers will be needed. Accept “an extra worker is required”
A project is modelled by the activity network shown in Figure 5. The activities are represented by the arcs. The number in brackets on each arc gives the time, in hours, to complete the activity. The numbers in circles are the event numbers. Each activity requires one worker.
(a) Explain the purpose of the dotted line from event 6 to event 8. (1)
(b) Calculate the early time and late time for each event. Write these in the boxes in the answer book. (4)
(c) Calculate the total float on activities \(D\), \(E\) and \(F\). (3)
(d) Determine the critical activities. (2)
(e) Given that the sum of all the times of the activities is 95 hours, calculate a lower bound for the number of workers needed to complete the project in the minimum time. You must show your working. (2)
(f) Given that workers may not share an activity, schedule the activities so that the process is completed in the shortest time using the minimum number of workers. (4)
Mark scheme (a)
Scheme
Marks
\(J\) depends on \(H\) alone, but \(L\) depends on \(H\) and \(I\)
B1
(1)
Mark scheme (b)
Scheme
Marks
M1 A1 M1 A1
(4)
Mark scheme (c)
Scheme
Marks
Total float on \(D = 20 - 7 - 8 = 5\) Total float on \(E = 20 - 11 - 9 = 0\) Total float on \(F = 29 - 5 - 8 = 16\)
M1 A1ft A1
(3)
Mark scheme (d)
Scheme
Marks
\(C - E \left\langle\begin{matrix}H - J\\ K\end{matrix}\right\rangle M\)
An engineering project is modelled by the activity network shown in Figure 4. The activities are represented by the arcs. The number in brackets on each arc gives the time, in days, to complete the activity. Each activity requires one worker. The project is to be completed in the shortest time.
(a) Calculate the early time and late time for each event. Write these in boxes in Diagram 1 in the answer book. (4)
(b) State the critical activities. (1)
(c) Find the total float on activities \(D\) and \(F\). You must show your working. (3)
(d) On the grid in the answer book, draw a cascade (Gantt) chart for this project. (4)
The chief engineer visits the project on day 15 and day 25 to check the progress of the work.
Given that the project is on schedule,
(e) which activities must be happening on each of these two days? (3)
Mark scheme (a)
Scheme
Marks
M1 A1 (2) M1 A1 (2)
(4)
Notes
M1 All top boxes completed → increasing generally
A1 c.a.o.
M1 All lower boxes completed ← decreasing generally
A1 c.a.o.
Mark scheme (b)
Scheme
Marks
\(A - C - G - I - M\) \(\phantom{A - C -{}} H - K\)
A1
(1)
Notes
A1 c.a.o. all 7 listed – no extras
Mark scheme (c)
Scheme
Marks
Float on \(D = 21 - 5 - 14 = 2\)
B1ft
Float on \(F = 42 - 20 - 14 = 8\)
M1 A1ft
(3)
Notes
B1ft cao ft from diagram
M1 method correct or ft correct answer (top ≤ bottom at both ends; must see appropriate working for M1)
A1ft cao ft from diagram
Mark scheme (d)
Scheme
Marks
M1 A1 A1ft A1
(4)
Notes
M1 At least one of their critical paths + 3 non-critical stated including floats (must be complete answer)
A1 critical activities correct
A1ft 4 non-critical activities correct ft from diagram; must include a float per activity
The network in Figure 5 shows the activities involved in a process. The activities are represented by the arcs. The number in brackets on each arc gives the time, in days, taken to complete the activity.
(a) Calculate the early time and late time for each event, showing them on the diagram in the answer book. (4)
(b) Determine the critical activities and the length of the critical path. (2)
(c) On the grid in the answer book, draw a cascade (Gantt) chart for the process. (4)
Each activity requires only one worker, and workers may not share an activity.
(d) Use your cascade chart to determine the minimum numbers of workers required to complete the process in the minimum time. Explain your reasoning clearly. (2)
(e) Schedule the activities, using the number of workers you found in part (d), so that the process is completed in the shortest time. (3)
Mark scheme (a)
Scheme
Marks
M1 A1 M1 A1
(4)
Mark scheme (b)
Scheme
Marks
\(A\ C\ I\ M\) length 26
B1 B1ft
(2)
Mark scheme (c)
Scheme
Marks
M1 A3,2ft,1ft,0
(4)
Mark scheme (d)
Scheme
Marks
5 workers needed e.g. ref to 13–14 when \(C, F, H, J\) and \(K\) must be taking place e.g. ref to 18–19 when \(I\ F\ J\ K\ L\) must be taking place