
D1 June 2013 Q7
7.
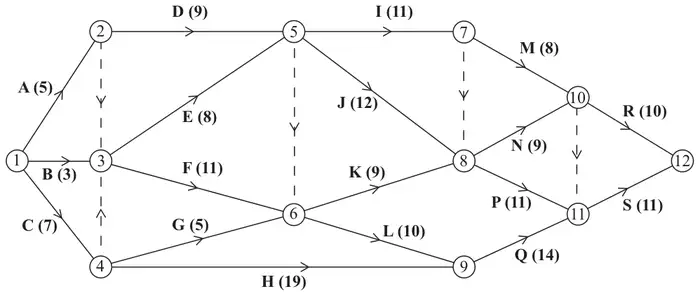
[The sum of the duration of all activities is 172 days]
A project is modelled by the activity network shown in Figure 5. The activities are represented by the arcs. The number in brackets on each arc gives the time, in days, to complete the activity. Each activity requires one worker. The project is to be completed in the shortest possible time.
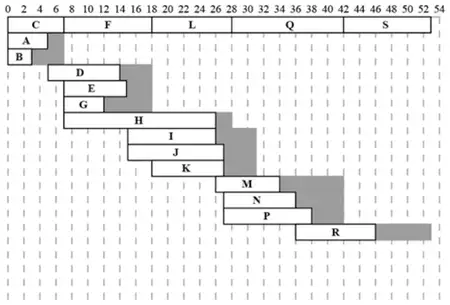
Diagram 2 in the answer book shows a partly completed cascade chart for this project.
| Scheme | Marks |
|---|---|
 | M1 A1 M1 A1 |
| (4) |
Notes
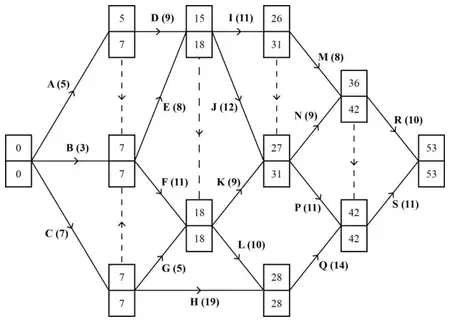
a1M1 All top boxes complete, values generally increasing left to right, condone one ‘rogue’ (if values do not increase from left to right then if one value is ignored and then the values do increase from left to right then this is considered to be only one rogue value)
a1A1 CAO.
a2M1 All bottom boxes complete, values generally decreasing right to left, condone one ‘rogue’.
a2A1 CAO
| Scheme | Marks |
|---|---|
| Float on M = 42 – 26 – 8 = 8 | M1 A1 |
| (2) |
Notes
b1M1 Correct calculation seen – all three numbers correct (ft), float \(\geqslant 0\).
b1A1 Float correct (no ft on this mark)
| Scheme | Marks |
|---|---|
| (c)(i) 2 day delay on P – no effect on the project completion date (float on P is 4) | B1 |
| (c)(ii) 2 day delay on Q – project finishes 2 days late (Q is a critical activity) | B1 |
| (2) |
Notes
c1B1 CAO
c2B1 CAO
| Scheme | Marks |
|---|---|
| (172/53 = 3.245, so) a minimum of 4 workers needed | B1 |
| (1) |
Notes
d1B1 4 with (or without) working scores this mark
| Scheme | Marks |
|---|---|
 | M1 A1 (any 6 more) M1 A1 (all 11) |
| (4) |
Notes
e1M1 At least six activities added including six floats. Scheduling diagram scores M0.
e1A1 Six activities including their floats dealt with correctly.
e2M1 All remaining eleven activities including all eleven floats.
e2A1 CAO.
| Scheme | Marks |
|---|---|
| E.g. Activities H, I, J, K and L together with \(22 \lt \text{time} \lt 26\) stated. So 5 workers needed | M1 A1 |
| (2) |
Notes
Examples for part (f):
Example 1: Activities H, I, J, K and L with \(22 \lt \text{time} \lt 26\) so 5 workers needed.
Example 2: At \(10 \lt \text{time} \lt 14\), F, D, E and H must be happening. Activity G must be happening \(7 \lt \text{time} \lt 18\) but its duration is 5 so it must also occur at some point in the interval \(10 \lt \text{time} \lt 14\) so 5 workers needed.
f1M1 Example 1: A statement with the correct number of workers (5) and the correct activities (H, I, J, K and L) with some mention of time, or
Example 2: A statement with the correct number of workers (5), the correct activities (F,D,E and H) with some mention of time and an indication that G must be happening with the other four activities at some point - give bod but e.g. ‘at time 11 F, D, E, G and H must be happening’ is M0). Scheduling the activities only scores M0.
f1A1 A correct, complete full statement with details of both time and activities. Candidates only need to give a time within the intervals stated.
Please note strict inequalities for the time. Allow e.g. on ‘day 23’ as equivalent to \(22 \lt \text{time} \lt 23\).
| Scheme | Marks |
|---|---|
| The cascade gives a higher lower bound, so (f) is better. | M1 A1 |
| (2) | |
| (17 marks) |
Notes
g1M1 Must have attempted both parts (d) and (f). Their higher lower bound chosen + attempt at a reason.
Allow for the M mark a reason which argues that e.g. the cascade chart gives a better lower bound (e.g. it takes into account exactly when activities must be taking place) or e.g. the calculation gives a better lower bound (e.g. as it takes into account the sum of all the activities) but without specifically answering the question of which of the two bounds is better. Give bod on an attempt at a reason.
g1A1 CAO plus a correct reason given. Acceptable reasons e.g. the cascade gives a larger value or the bound for the cascade shows that the project cannot be done with fewer workers, etc.