
AS June 2023 Q2
2.
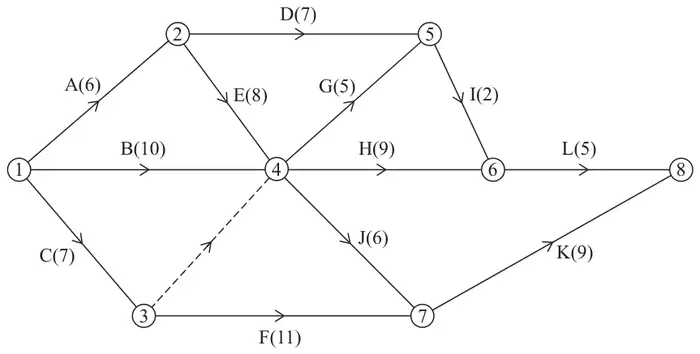
A project is modelled by the activity network shown in Figure 1. The activities are represented by the arcs. The number in brackets on each arc gives the time required, in hours, to complete the corresponding activity. The numbers in circles are the event numbers. Each activity requires one worker, and the project is to be completed in the shortest possible time.
| Scheme | Marks | AO |
|---|---|---|
| The dummy from event 3 to event 4 is required as activity F depends only on activity C, but activities G, H and J depend on activities C, B and E | B1 | 2.4 |
| (1) |
Notes
B1: Correct reasoning for the dummy activity – must mention activities F and C (twice or clearly implied twice), at least one of B/E, and at least one of G/H/J (for example, ‘F relies on C, but G relies on C and E’)
| Scheme | Marks | AO |
|---|---|---|
 | M1 A1 A1 | 1.1b 1.1b 1.1b |
| (3) |
Notes
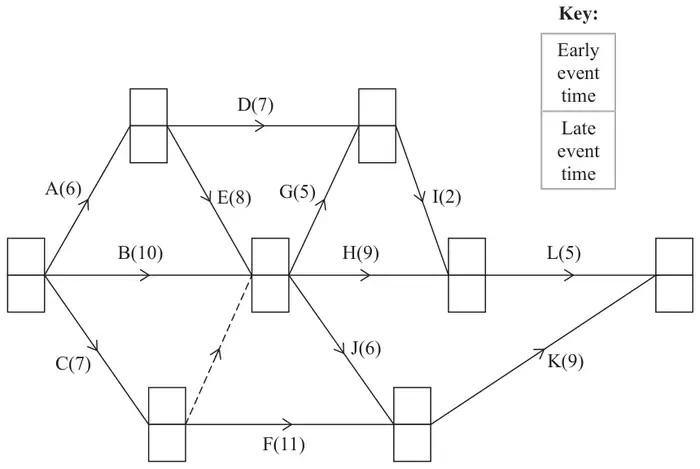
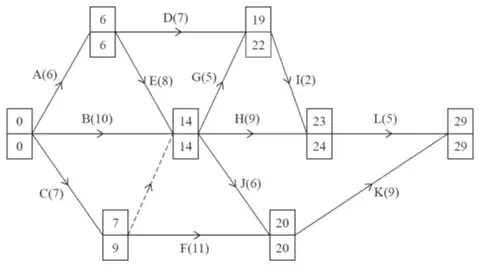
M1: All top boxes and all bottom boxes completed. Values generally increasing left to right (for top boxes) and values generally decreasing from right to left (for bottom boxes). Condone missing 0s at the source node or the 29 in the bottom box at the sink node for the M mark only. Condone one rogue value in top boxes and one rogue value in bottom boxes. For a rogue in the top boxes if values do not increase in the direction of the arrows, then if one value is ignored and then the values do increase in the direction of the arrows then this is considered to be only one rogue value (with a similar definition for bottom boxes but in reverse)
A1: cao - Top boxes (including zero at the source node)
A1: cao - Bottom boxes (including zero at the source node and 29 at the sink node)
| Scheme | Marks | AO |
|---|---|---|
| Critical activities are A, E, J and K | B1 | 1.1b |
| (1) |
Notes
B1: cao (the correct four critical activities A, E, J and K and no others)
| Scheme | Marks | AO |
|---|---|---|
| \(\dfrac{6+10+7+7+8+11+5+9+2+6+9+5}{29} = \dfrac{85}{29} = 2.931\ldots\) so a lower bound of 3 workers | B1ft | 2.2a |
| (1) |
Notes
B1ft: Correct deduction of lower bound from a correct calculation for their minimum project completion time from (b) (so if correct in (b), must be 85/29). The follow through is on their 29 only (so no follow through for incorrectly adding up the duration of all the activities). An answer of 3 with no working scores no marks. All working seen must be correct. As a minimum must either see \(\dfrac{6+10+7+7+8+11+5+9+2+6+9+5}{29}\) or \(\dfrac{85}{29}\) or an awrt 2.9 (not from incorrect working) followed by 3
| Scheme | Marks | AO |
|---|---|---|
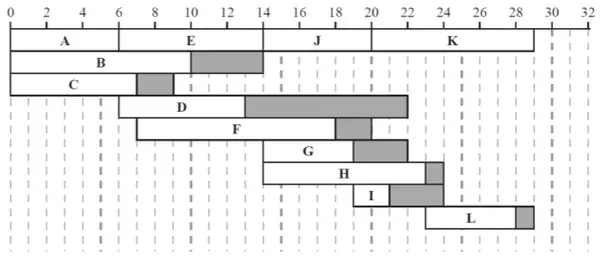 | M1 A1 A1 A1 | 2.1 1.1b 1.1b 1.1b |
| (4) | ||
| (10 marks) |
Notes
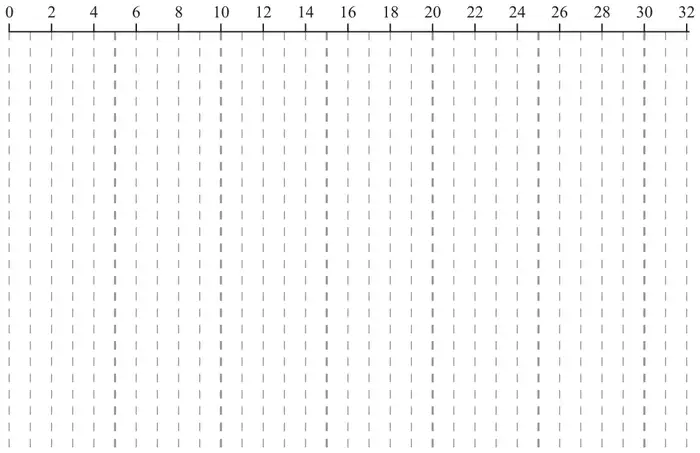
M1: At least nine different activities labelled including at least five floats. A scheduling diagram (so a diagram in which no floats are evident) scores M0
A1: The critical activities dealt with correctly and appearing just once (A, E, J and K) and three non-critical activities dealt with correctly (both duration and total float correct)
A1: Any six non-critical activities correct (this mark is not dependent on the previous A mark)
A1: cso – completely correct Gantt chart (all twelve activities appearing exactly once)
For (e) the following may be useful in checking their cascade chart provided the float is shown after the corresponding activity:
| Activity | Duration + Float |
|---|---|
| A | 0 to 6 Critical |
| B | 0 to 10 F: 10 to 14 |
| C | 0 to 7 F; 7 to 9 |
| D | 6 to 13 F: 13 to 22 |
| E | 6 to 14 Critical |
| F | 7 to 18 F: 18 to 20 |
| G | 14 to 19 F: 19 to 22 |
| H | 14 to 23 F: 23 to 24 |
| I | 19 to 21 F: 21 to 24 |
| J | 14 to 20 Critical |
| K | 20 to 29 Critical |
| L | 23 to 28 F: 28 to 29 |