
A2 June 2025 Q6
6.
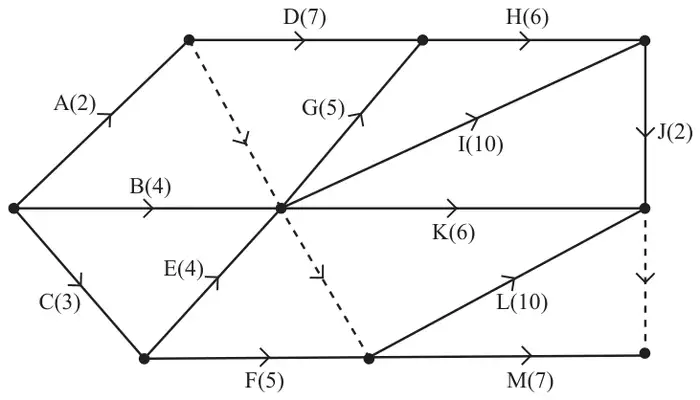
A project is modelled by the activity network shown in Figure 3. The activities are represented by the arcs. The number in brackets on each arc gives the time, in hours, to complete the corresponding activity. The project is to be completed in the shortest possible time.
| Activity | Immediately preceding activities | Activity | Immediately preceding activities |
|---|---|---|---|
| A | G | ||
| B | H | ||
| C | I | ||
| D | J | ||
| E | K | ||
| F | L | ||
| M |
Table 1
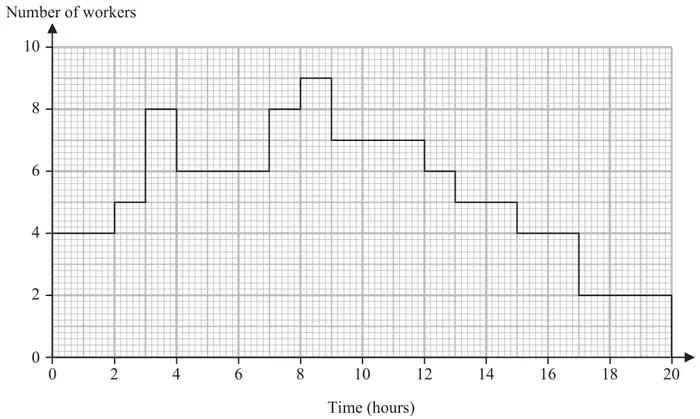
The resource histogram in Figure 4 shows the number of workers required when each activity starts at its earliest possible time. When an activity is started it must be completed without interruption. Each activity requires at least one worker.
| Activity | Number of Workers | Activity | Number of Workers |
|---|---|---|---|
| A | G | ||
| B | H | ||
| C | I | ||
| D | J | ||
| E | K | ||
| F | L | ||
| M |
Table 2
| Scheme | Marks | AO | ||||||||||||||||||||||||||||||||
|---|---|---|---|---|---|---|---|---|---|---|---|---|---|---|---|---|---|---|---|---|---|---|---|---|---|---|---|---|---|---|---|---|---|---|
| B1 B1 | 1.1b 1.1b | ||||||||||||||||||||||||||||||||
| (2) |
Notes
a1B1: Five correct rows (not including A, B and C)
a2B1: All rows correct (accept blanks for A, B and C)
| Scheme | Marks | AO |
|---|---|---|
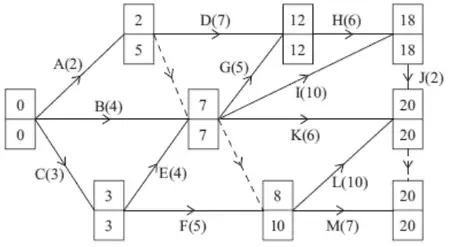 | M1 A1 M1 A1 | 1.1b 1.1b 1.1b 1.1b |
| (4) |
Notes
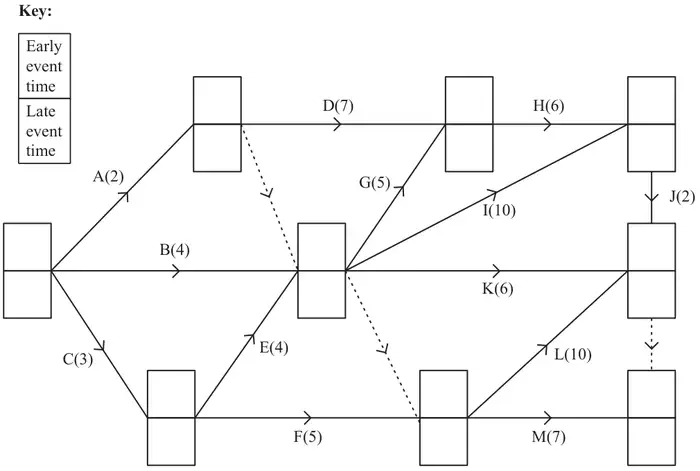
b1M1: All top boxes complete, values generally increasing in the direction of the arrows (‘left to right’), condone one rogue value which is a number in a top box greater than the subsequent value
b1A1: CAO – top boxes
b2M1: All bottom boxes complete, values generally decreasing in the opposite direction of the arrows (‘right to left’), condone one rogue value which is a number in a bottom box greater than the previous value. Condone missing 0 and/or their 20 (at the end event) for the M mark only
b2A1: CAO – bottom boxes
| Scheme | Marks | AO |
|---|---|---|
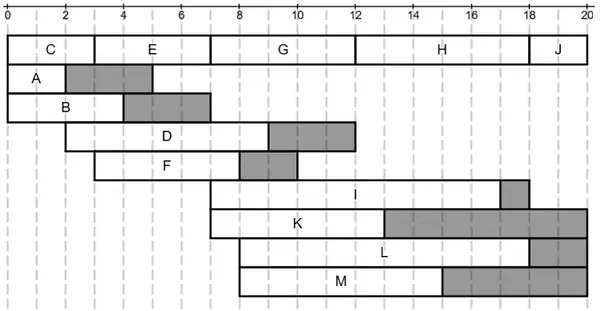 | M1 A1 A1 A1 | 2.1 1.1b 1.1b 1.1b |
| (4) |
Notes
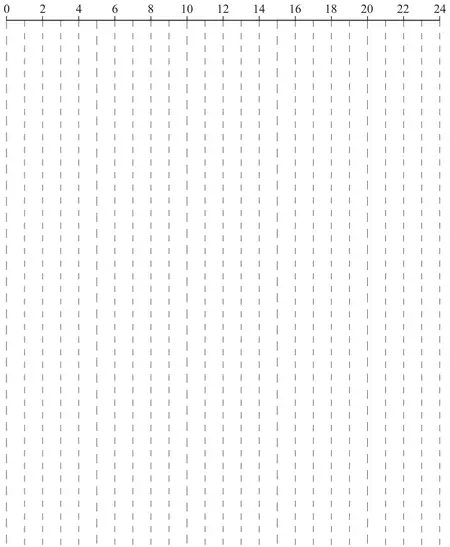
c1M1: Gantt (cascade) chart with at least 9 activities labelled and at least four activities having non-zero float. A scheduling diagram scores M0
c1A1: Critical activities (C, E, G, H and J) correct (note this may be seen as separate activities listed alphabetically instead of at the top of the chart)
c2A1: At least 4 non-critical activities correct
c3A1: CAO All 13 activities present (just once). No errors.
For reference these are the early start, late end and length of float for the non-critical activities
| Activity | Start | Late End | Float | Critical | Start | End |
|---|---|---|---|---|---|---|
| A | 0 | 5 | 3 | C | 0 | 3 |
| B | 0 | 7 | 3 | E | 3 | 7 |
| D | 2 | 12 | 3 | G | 7 | 12 |
| F | 3 | 10 | 2 | H | 12 | 18 |
| I | 7 | 18 | 1 | J | 18 | 20 |
| K | 7 | 20 | 7 | |||
| L | 8 | 20 | 2 | |||
| M | 8 | 20 | 5 |
| Scheme | Marks | AO | ||||||||||||||||||||||||||||||||
|---|---|---|---|---|---|---|---|---|---|---|---|---|---|---|---|---|---|---|---|---|---|---|---|---|---|---|---|---|---|---|---|---|---|---|
| B3, 2, 1 | 3.4 1.1b 1.1b | ||||||||||||||||||||||||||||||||
| (13 marks) |
Notes
d1B1: At least four correct
d2B1: At least eight correct
d3B1: CAO