
A2 October 2020 Q2
2.
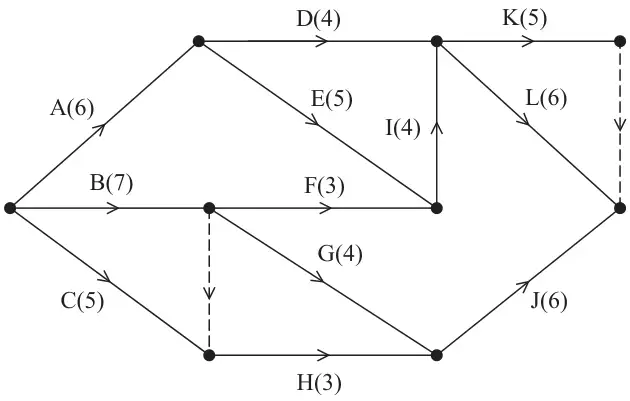
The network in Figure 1 shows the activities that need to be undertaken to complete a project. Each activity is represented by an arc and the duration, in hours, of the corresponding activity is shown in brackets.
| Activity | Immediately preceding activities |
|---|---|
| A | |
| B | |
| C | |
| D | |
| E | |
| F | |
| G | |
| H | |
| I | |
| J | |
| K | |
| L |
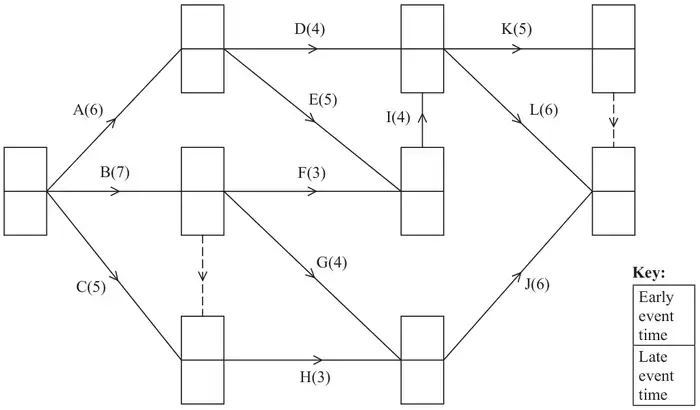
Each activity requires one worker. Each worker is able to do any of the activities. Once an activity is started it must be completed without interruption.
| Scheme | Marks | AO |
|---|---|---|
| The dummy at the end of activity B is required as F (and G) are dependent on activity B only, but activity H is dependent on both activities B and C | B1 | 2.4 |
| The dummy at the end of activity K is required as two activities cannot start at the same event and finish at the same event | B1 | 2.4 |
| (2) |
Notes
(a) B1: Correct explanation for precedence dummy (must mention B, C, H and one of F or G)
B1: Correct explanation for uniqueness dummy
| Scheme | Marks | AO | ||||||||||||||||||||||||||||||
|---|---|---|---|---|---|---|---|---|---|---|---|---|---|---|---|---|---|---|---|---|---|---|---|---|---|---|---|---|---|---|---|---|
| B1 B1 | 1.1b 1.1b | ||||||||||||||||||||||||||||||
| (2) |
Notes
(b) B1: Six correct rows (not including A, B and C)
B1: All rows correct (accept blanks for A, B and C)
| Scheme | Marks | AO |
|---|---|---|
(i)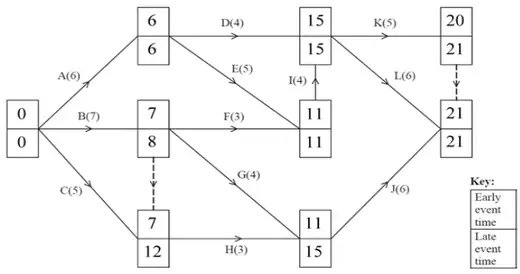 | M1 A1 M1 A1 | 1.1b 1.1b 1.1b 1.1b |
| (ii) Minimum completion time: 21 hours | A1ft | 1.1b |
| (iii) Critical activities: A, E, I, L | A1 | 1.1b |
| (6) |
Notes
(c)(i) M1: All top boxes completed, number generally increasing L to R (condone one “rogue”)
A1: CAO - Top boxes
M1: All bottom boxes completed, numbers generally decreasing R to L (condone one “rogue”) – condone lack of 0 or 21 for the M mark only
A1: CAO - Bottom boxes
(c)(ii) A1ft: Correct follow through from their completed top boxes
(c)(iii) A1: Correct critical activities (A, E, I and L only)
| Scheme | Marks | AO |
|---|---|---|
e.g.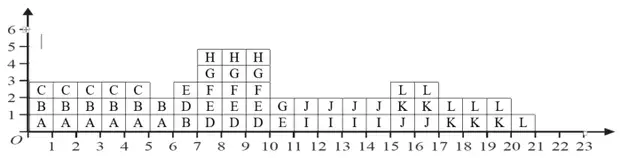 | M1 A1 A1 | 1.1b 1.1b 1.1b |
| (3) |
Notes
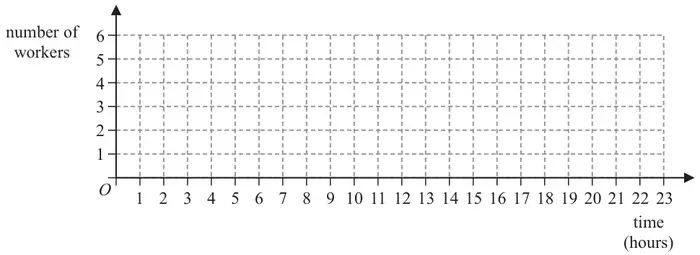
(d) M1: Plausible histogram (correct up to time 6) with no holes or overhangs (must go to at least 20 on the time axis)
A1: Histogram correct to time 10
A1: Histogram correct from time 10 to time 21
| Scheme | Marks | AO |
|---|---|---|
| Currently five workers are required between time 7 and 10 and so one of the non-critical activities D, F, G or H would have to be delayed and start after time 10 | M1 | 2.4 |
| e.g. Activity H could be delayed and start at time 10 (as it has sufficient total float and can finish as late as time 15) and so the project can be completed with fewer workers than the number indicated by the resource histogram as J could be delayed too and start at time 15 | A1 | 2.2a |
| (2) | ||
| (15 marks) |
Notes
(e) M1: Explanation involving the need to delay just one of the non-critical activities (must mention one of D, F, G or H) to start after time 10 (oe) – follow through their histogram
A1: Dependent on a correct histogram and correct answer to (c)(i). Correct deduction that it is possible to complete with fewer workers e.g. delay H to start at 10 therefore delay J to start at its late time (or 15) – A0 if mention of delaying activity F