
D1 January 2009 Q8
8.
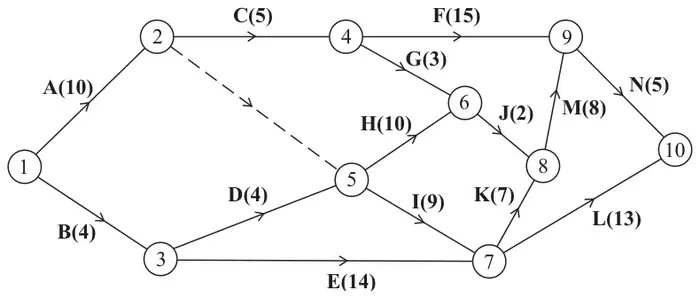
The network in Figure 5 shows the activities involved in a process. The activities are represented by the arcs. The number in brackets on each arc gives the time, in days, taken to complete the activity.
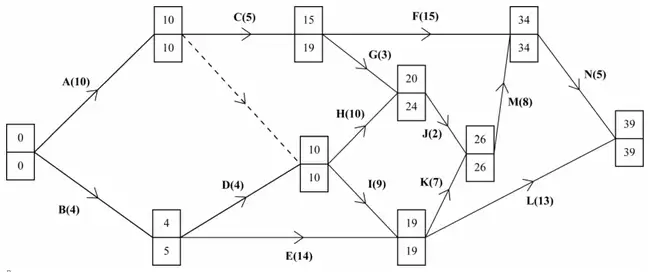
(a) Calculate the early time and the late time for each event, showing them on the diagram in the answer book. (4)
(b) Determine the critical activities and the length of the critical path. (3)
(c) Calculate the total float on activities F and G. You must make the numbers you used in your calculation clear. (3)
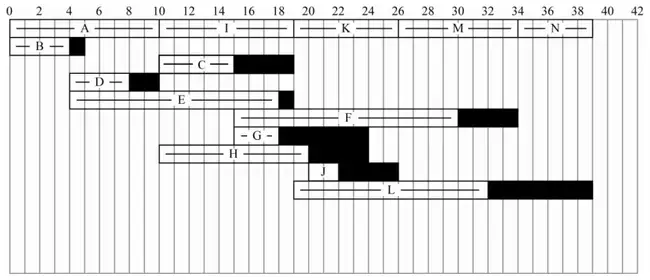
(d) On the grid in the answer book, draw a cascade (Gantt) chart for the process. (4)
Given that each task requires just one worker,
(e) use your cascade chart to determine the minimum number of workers required to complete the process in the minimum time. Explain your reasoning clearly. (2)
| Scheme | Marks |
|---|---|
 | M1 A1 M1 A1 |
| (4) |
| Scheme | Marks |
|---|---|
| A, I, K, M, N; Length 39 | B2, 1, 0; B1 |
| (3) |
| Scheme | Marks |
|---|---|
| Float on F is 34 – 15 – 15 = 4 | M1 A1 |
| Float on G is 24 – 15 – 3 = 6 | B1 |
| (3) |
| Scheme | Marks |
|---|---|
 | M1 A1 M1 A1 |
| (4) |
| Scheme | Marks |
|---|---|
| e.g. At time 14 ½ there are 4 tasks I, E, H and C must be happening. | B2, 1, 0 |
| (2) | |
| (16 marks) |