
D1 January 2007 Q6
6.
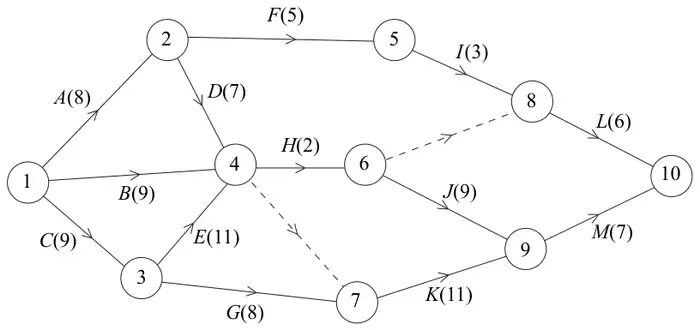
A project is modelled by the activity network shown in Figure 5. The activities are represented by the arcs. The number in brackets on each arc gives the time, in hours, to complete the activity. The numbers in circles are the event numbers. Each activity requires one worker.
(a) Explain the purpose of the dotted line from event 6 to event 8. (1)
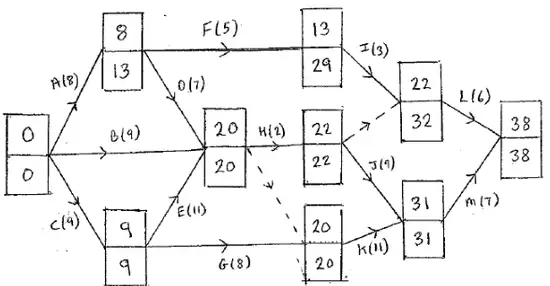
(b) Calculate the early time and late time for each event. Write these in the boxes in the answer book. (4)
(c) Calculate the total float on activities \(D\), \(E\) and \(F\). (3)
(d) Determine the critical activities. (2)
(e) Given that the sum of all the times of the activities is 95 hours, calculate a lower bound for the number of workers needed to complete the project in the minimum time. You must show your working. (2)
(f) Given that workers may not share an activity, schedule the activities so that the process is completed in the shortest time using the minimum number of workers. (4)
| Scheme | Marks |
|---|---|
| \(J\) depends on \(H\) alone, but \(L\) depends on \(H\) and \(I\) | B1 |
| (1) |
| Scheme | Marks |
|---|---|
 | M1 A1 M1 A1 |
| (4) |
| Scheme | Marks |
|---|---|
| Total float on \(D = 20 - 7 - 8 = 5\) Total float on \(E = 20 - 11 - 9 = 0\) Total float on \(F = 29 - 5 - 8 = 16\) | M1 A1ft A1 |
| (3) |
| Scheme | Marks |
|---|---|
| \(C - E \left\langle\begin{matrix}H - J\\ K\end{matrix}\right\rangle M\) | M1 A1 |
| (2) |
| Scheme | Marks |
|---|---|
| \(\dfrac{95}{38} = 2.5\) so 3 workers | M1 A1ft |
| (2) |
| Scheme | Marks |
|---|---|
e.g.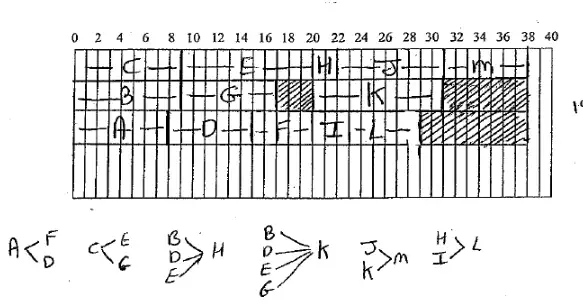 | M1 A1 A1 A1 |
| (4) | |
| (16 marks) |