for finding the mean of list A, eg \((276 + 400 + 157 + 139) \div 4\ (= 243)\) OR for an expression for the mean of list B, eg \((530 + 500 + 270 + x + 440 + 320) \div 6\ \left(= \dfrac{2060 + x}{6}\right)\) oe
P1
for beginning to work with ratio, eg \(\text{``}243\text{''} \div 3\ (= 81)\) or \([\mathrm{A}] \div 3\) or \(\text{``}243\text{''} \times 5\ (= 1215)\) or \([\mathrm{A}] \times 5\) OR \(\text{``}\left(\dfrac{2060 + x}{6}\right)\text{''} \times 3\) or \([\mathrm{B}] \times 3\) or \(\text{``}\left(\dfrac{2060 + x}{6}\right)\text{''} \div 5\) or \([\mathrm{B}] \div 5\)
P1
for completing the work with ratio, eg \(\text{``}81\text{''} \times 5\ (= 405)\) or \([\mathrm{A}] \div 3 \times 5\) or \([\mathrm{B}] \times 3 \div 5\) or \(\text{``}\left(\dfrac{2060 + x}{6}\right)\text{''} \times \dfrac{3}{5}\) OR forms a suitable equation, eg \(\text{``}243\text{''} \times 5 = 3 \times \text{``}\left(\dfrac{2060 + x}{6}\right)\text{''}\) or \([\mathrm{A}] \times 5 = 3 \times \text{``}\left(\dfrac{2060 + x}{6}\right)\text{''}\)
P1
for working with mean of list B, eg \(\text{``}405\text{''} \times 6\ (= 2430)\) or \([\mathrm{A}] \div 3 \times 5 \times 6\) OR for process to remove brackets and denominator, eg \(\text{``}243\text{''} \times 5 \times 2 = 2060 + x\) or \([\mathrm{A}] \times 5 \times 2 = 2060 + x\) or \(2060 + x = \text{``}405\text{''} \times 6\)
A1
cao
Additional guidance
[A] is what they believe to be the mean for A [B] must be clearly their mean of B and be an expression including \(x\)
19 Katya counted the number of people in each of 50 cars.
The table gives information about her results.
Number of people
Frequency
1
16
2
15
3
7
4
9
5
3
(a) Find the median number of people. (1)
(b) Work out the mean number of people. (3)
Mark scheme (a)
Answer
Mark
Mark scheme
2
B1
cao
Mark scheme (b)
Answer
Mark
Mark scheme
2.36
M1
for starting method by multiplying ages by frequencies, with at least 3 correct, eg \(1 \times 16\), \(2 \times 15\), \(3 \times 7\), \(4 \times 9\), \(5 \times 3\) or at least three of 16, 30, 21, 36, 15
M1
(dep on M1) for \(\sum fx \div \sum f\), eg \(118 \div 50\) or \(118 \div (16 + 15 + 7 + 9 + 3)\) or \((1 \times 16 + 2 \times 15 + 3 \times 7 + 4 \times 9 + 5 \times 3) \div 50\)
A1
accept 2.4 from correct working
Additional guidance
Do not award this mark if the final answer comes from an alternative incorrect method, eg \(50 \div 5\) May be seen next to table 118 implies this mark
\(\sum fx\) must come from 5 products
If a correct answer is shown and then incorrectly rounded award full marks
12 The table gives some information about the ages, in years, of 32 actors.
Lowest age
21
Highest age
80
Lower quartile
31
Upper quartile
42
Median
35
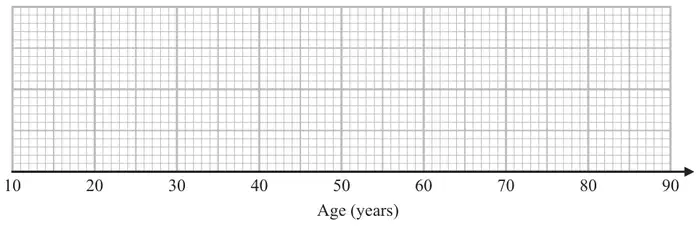
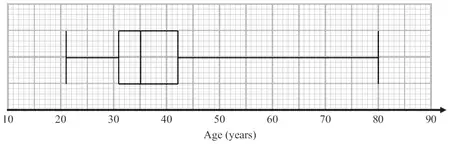
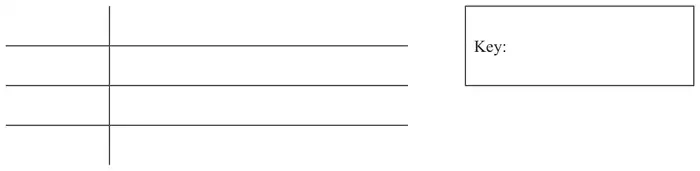
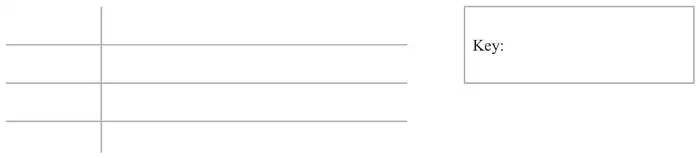
(a) Draw a box plot to represent this information.(3)
(b) Work out an estimate for the number of these actors with an age between 31 years and 42 years. (1)
Mary says,
“At least one of the actors is 35 years old because the median is 35”
(c) Is Mary correct? Give a reason for your answer. (1)
Mark scheme (a)
Answer
Mark
Mark scheme
Drawn
B3
for a fully correct box plot
(B2
for 3 or 4 correctly plotted values including box and whiskers/tails
(B1
for 2 correctly plotted values including box or whiskers/tails or 5 correct values plotted or clearly identified and no box or whiskers/tails)
Additional guidance
See diagram at end of scheme Min = 21 LQ = 31 Med = 35 UQ = 42 Max = 80
Mark scheme (b)
Answer
Mark
Mark scheme
16
B1
cao
Mark scheme (c)
Answer
Mark
Mark scheme
Explanation
C1
Acceptable examples Not true as the median could be the average of two ages No, the median is not always one of the numbers in the data Because there is an even amount of numbers, there must be 2 in the middle that have a mean of 35 She could be correct if the middle two numbers are both 35
Not acceptable examples Yes… No more are between 31-35 than 35-42 No as there is an even number at least two must be 35 No the median is just the average We can’t tell from the graph Because there is an even amount of numbers Not true as we do not know the exact ages of all data.
Additional guidance
Figures need not be stated, but if they are, they must be correct
for finding the mean of list A, eg \((276 + 400 + 157 + 139) \div 4\ (= 243)\) OR an expression for the mean of list B, eg \((530 + 500 + 270 + x + 440 + 320) \div 6\ \left(= \dfrac{2060 + x}{6}\right)\) oe
P1
for beginning to work with ratio, eg \(\text{``}243\text{''} \div 3\ (= 81)\) or \([\mathrm{A}] \div 3\) or \(\text{``}243\text{''} \times 5\ (= 1215)\) or \([\mathrm{A}] \times 5\) OR \(\text{``}\left(\dfrac{2060 + x}{6}\right)\text{''} \times 3\) or \([\mathrm{B}] \times 3\) or \(\text{``}\left(\dfrac{2060 + x}{6}\right)\text{''} \div 5\) or \([\mathrm{B}] \div 5\)
P1
for completing the work with ratio, eg \(\text{``}81\text{''} \times 5\ (= 405)\) or \([\mathrm{A}] \div 3 \times 5\) or \([\mathrm{B}] \times 3 \div 5\) or \(\text{``}\left(\dfrac{2060 + x}{6}\right)\text{''} \times \dfrac{3}{5}\) OR forms a suitable equation, eg \(\text{``}243\text{''} \times 5 = 3 \times \text{``}\left(\dfrac{2060 + x}{6}\right)\text{''}\) or \([\mathrm{A}] \times 5 = 3 \times \text{``}\left(\dfrac{2060 + x}{6}\right)\text{''}\)
P1
for working with mean of list B, eg \(\text{``}405\text{''} \times 6\ (= 2430)\) or \([\mathrm{A}] \div 3 \times 5 \times 6\) OR for process to remove brackets and denominator, eg \(\text{``}243\text{''} \times 5 \times 2 = \text{``}2060 + x\text{''}\) or \([\mathrm{A}] \times 5 \times 2 = \text{``}2060 + x\text{''}\) or \(2060 + x = \text{``}405\text{''} \times 6\)
A1
cao
Additional guidance
[A] is what they believe to be the mean of A [B] must be clearly their mean of B and be an expression including \(x\)
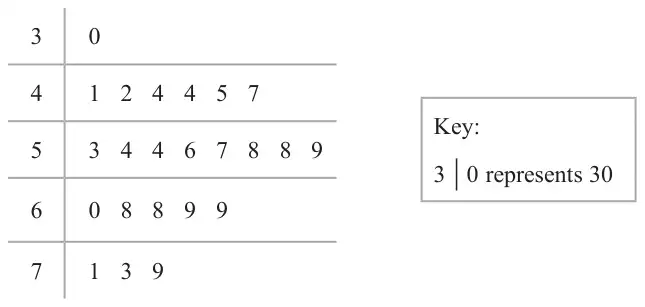
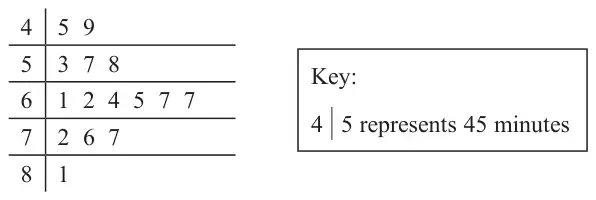
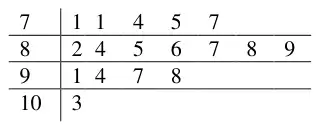
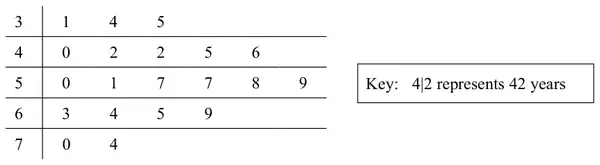
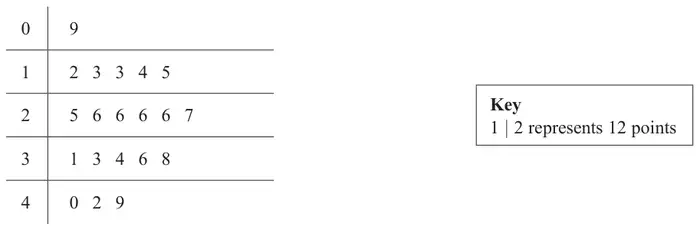
22 The stem and leaf diagram shows the test scores of 23 students from School A.
23 students from School B did the same test.
Their median score was 56 The range of their scores was 47
Compare the distribution of the test scores of the students from School A with the distribution of the test scores of the students from School B. (4)
Mark scheme
Answer
Mark
Mark scheme
Comparison
B1
for correctly identifying the median of (School) A as 57
C1
(ft, dep on value for the median being stated) for making a correct comparison of median eg ‘the median of (School) A is higher than the median of (School) B’
B1
for correctly identifying the range of (School) A as 49
C1
(ft, dep on value for the range being stated) for making a correct comparison of range eg ‘the range of (School) A is higher than the range of (School) B’
Additional guidance
If median for school B is stated in the comparison it must be correct
If range for school B is stated in the comparison it must be correct
15 The table gives information about the ages of the 41 children in Blackrod football club.
Age (years)
Frequency
8
6
9
7
10
15
11
11
12
2
(a) Work out the mean age. Give your answer correct to 1 decimal place. (3)
Rohan is working out the modal age of the children in Blackrod football club. He says,
“The highest frequency is 15, so the modal age is 15”
(b) Is Rohan’s answer correct? Give a reason for your answer. (1)
Mark scheme (a)
Answer
Mark
Mark scheme
9.9
M1
for starting process by multiplying ages by frequencies, with at least 3 correct, eg \(8 \times 6\), \(9 \times 7\), \(10 \times 15\), \(11 \times 11\), \(12 \times 2\) or at least 3 of 48, 63, 150, 121, 24
M1
(dep on M1) for \(\sum fx \div \sum f\), eg \(406 \div 41\) or \(406 \div (6 + 7 + 15 + 11 + 2)\) or \((8 \times 6 + 9 \times 7 + 10 \times 15 + 11 \times 11 + 12 \times 2) \div 41\)
A1
Answer in the range 9.9 to 9.91
Additional guidance
May be seen next to table. 406 implies this mark
\(\sum fx\) must come from 5 products
If an answer is given in the range in working and then rounded incorrectly award full marks.
Mark scheme (b)
Answer
Mark
Mark scheme
No, with explanation
C1
No, with explanation,
Acceptable examples No as the mode/modal age is 10 No it should be 10 (not 15) No because 15 is the number of children that are age 10 (not age 15) No because there are no 15 year olds No because the frequency tells us the number of children for that age No he needs to give the age of the highest frequency
Not acceptable examples No he is not, the modal is the one that occurs the most Yes / Rohan is correct .... No, the mode is 11
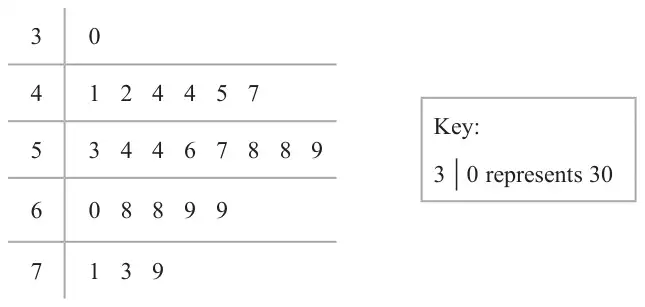
6 The stem and leaf diagram shows the test scores of 23 students from School A.
23 students from School B did the same test.
Their median score was 56 The range of their scores was 47
Compare the distribution of the test scores of the students from School A with the distribution of the test scores of the students from School B. (4)
Mark scheme
Answer
Mark
Mark scheme
Comparison
B1
for correctly identifying the median of (School) A as 57
C1
(ft, dep on value for the median being stated) for making a correct comparison of median eg ‘the median of (School) A is higher than the median of (School) B’
B1
for correctly identifying the range of (School) A as 49
C1
(ft, dep on value for the range being stated) for making a correct comparison of range eg ‘the range of (School) A is higher than the range of (School) B’
Additional guidance
If median for school B is stated in the comparison it must be correct
If range for school B is stated in the comparison it must be correct
15 Tessa recorded the times that 15 adults took to complete a run. She showed her results in a stem and leaf diagram.
(a) Find the median. (1)
(b) Find the range. (2)
Tessa also recorded the times that 15 children took to complete the run.
For the children, the median was 75 minutes.
(c) Compare the times that the adults took with the times that the children took. (1)
Mark scheme (a)
Answer
Mark
Mark scheme
64
B1
cao
Mark scheme (b)
Answer
Mark
Mark scheme
36
M1
for identifying 81 and 45 as the key numbers, eg \(81 - 45\) or \(45 - 81\) or 45 to 81
A1
cao
Additional guidance
It is insufficient to identify these on the diagram (eg as 1, 5)
Answer of \(-36\) gets M1A0
Mark scheme (c)
Answer
Mark
Mark scheme
comparison
C1
for a correct comparison of medians that could ft their incorrect median in (a)
Acceptable examples The adults were faster because they have the smaller median The adults were [11] minutes faster (on average) The adults were faster The adults took less time The children were slower The children took more time Children took [11] minutes more (on average) Children had a larger median than the adults.
Not acceptable examples The children were faster The adults median was 64, the children’s median was 75 11 minutes difference The children had more time to run than the adults
Additional guidance
Statement must be entirely true and not contradictory Figures not required in comparison, but if seen must be correct.
Where [11] is the difference between 75 and their (a).
If median in (a) is greater than 75 then converse statements would be correct ft.
22 Seija works at a weather station. The table gives information about the temperature, \(T\) °C, at midday for each of 50 cities in the UK on Tuesday.
Temperature (\(T\) °C)
Frequency
\(10 \lt T \leqslant 15\)
2
\(15 \lt T \leqslant 20\)
8
\(20 \lt T \leqslant 25\)
13
\(25 \lt T \leqslant 30\)
21
\(30 \lt T \leqslant 35\)
6
(a) Calculate an estimate for the mean temperature. (3)
Seija says,
“The median temperature is 22.5 °C because 22.5 is the middle number in the middle group.”
(b) Is Seija correct? Give a reason for your answer. (1)
Mark scheme (a)
Answer
Mark
Mark scheme
24.6
M1
for finding 5 products within intervals (including end points) with not more than one error, may be seen near table. eg \(2 \times 12.5\ (= 25)\), \(8 \times 17.5\ (= 140)\), \(13 \times 22.5\ (= 292.5)\), \(21 \times 27.5\ (= 577.5)\), \(6 \times 32.5\ (= 195)\) or for 1230
M1
for \(\Sigma fx \div \Sigma f\) eg \((\text{``}25\text{''} + \text{``}140\text{''} + \text{``}292.5\text{''} + \text{``}577.5\text{''} + \text{``}195\text{''}) \div \text{``}50\text{''}\) or \(\text{``}1230\text{''} \div \text{``}50\text{''}\)
A1
for 24.6 oe
Additional guidance
Min \(fx\)
Max \(fx\)
20
30
120
160
260
325
525
630
180
210
\(\Sigma fx\) must come from 5 products, \(fx\) within intervals (including end points)
Mark scheme (b)
Answer
Mark
Mark scheme
No, with reason
C1
for No and reason
Acceptable No, the median is in the interval \(25 \lt T \leqslant 30\) No, the median is in the group containing the 25(.5)th temperature No, she did not take into account frequency No, the frequencies are not the same for each group.
Not acceptable No, the median is 27.5 No, the median is higher than 22.5 \(25 \lt T \leqslant 30\) Yes, …
Additional guidance
Any incorrect statement as part of a correct response can be ignored unless it contradicts the statement.
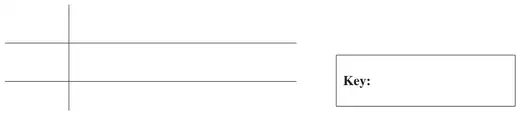
Show this information in a stem and leaf diagram. (3)
Mark scheme
Answer
Mark
Mark scheme
16
0 2 8
17
2 2 3 7 8
18
0 0 3 4 6 8
19
1 7
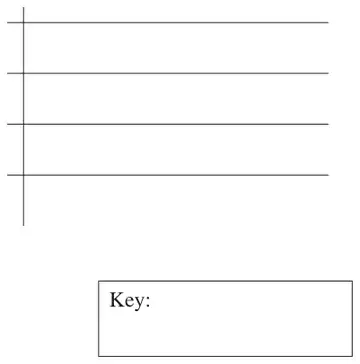
Key: 16|0 = 160 or 160|0 = 160
B2
for a fully correct ordered diagram
(B1
for a complete unordered diagram or for an ordered diagram with at most one error or omission)
B1
(indep) for correct key, eg 16|0 or 160|0 represents 160
Additional guidance
Accept stem of 160, 170, 180, 190 Can be in reverse vertical order (with matching leaves) eg 19, 18, 17, 16 Errors can be omissions; one number in the wrong position is one error.
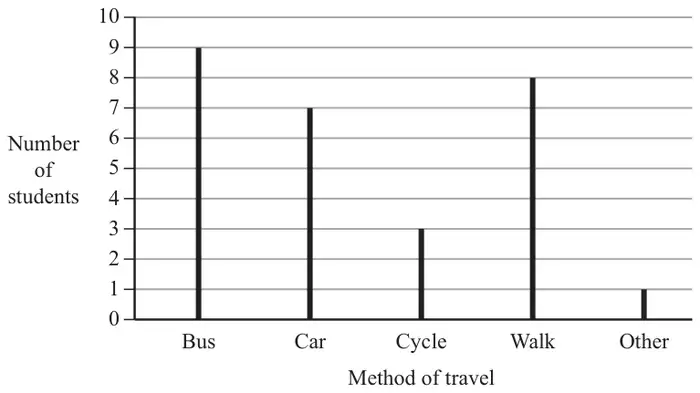
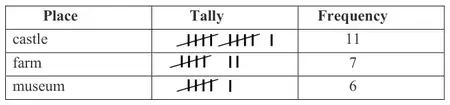
8 Miss Bailey asked 24 students where they each wanted to go on a school trip.
Here are the results.
museum
castle
castle
farm
farm
castle
farm
farm
castle
farm
castle
castle
castle
farm
castle
museum
museum
farm
castle
museum
museum
museum
castle
castle
(a) Complete the frequency table.
Place
Tally
Frequency
castle
farm
museum
(2)
(b) Write down the place that is the mode. (1)
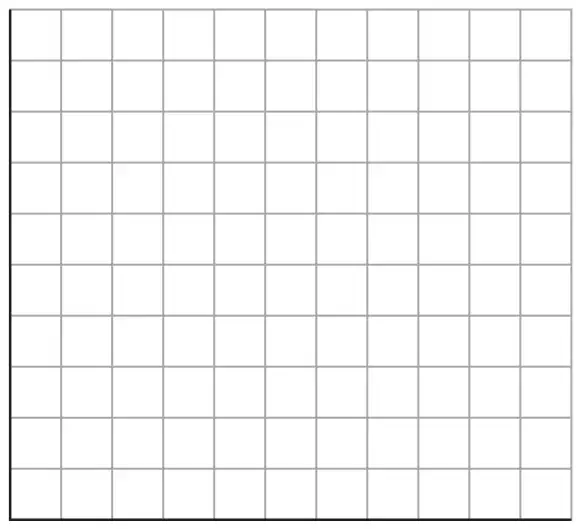
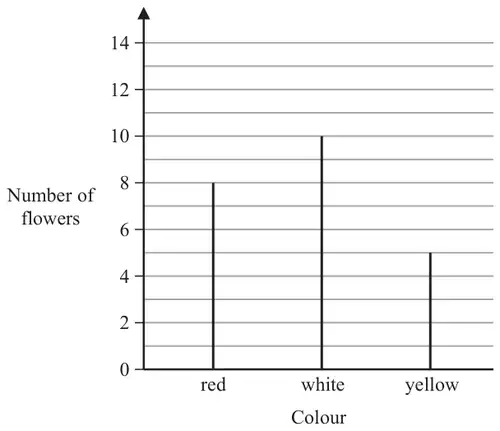
(c) Draw a bar chart to show the results.(3)
Mark scheme (a)
Answer
Mark
Mark scheme
11, 7, 6
B2
for all frequencies correct
(B1
for two tallies or two frequencies correct)
Additional guidance
Any discrepancy mark frequencies
Mark scheme (b)
Answer
Mark
Mark scheme
Castle
B1
Castle or ft their tallies or frequencies
Additional guidance
Any discrepancy ft frequencies
Mark scheme (c)
Answer
Mark
Mark scheme
Bar chart
B1
for correct place labels or a linear scale
M1
for at least two correct bars ft their table in (a)
A1
for a fully correct bar chart with linear scale of numbers on the vertical axis and a set of place labels on the horizontal axis (ft from their frequencies or tallies in (a))
Additional guidance
Accept key in place of labels Accept unambiguous abbreviations for labels eg C, F, M Condone bars of varying widths Condone no gaps or inconsistent gaps Bars must be unambiguously correct for their scale
There are 350 seats in cinema A. There are 250 seats in cinema B.
Work out the number of seats in cinema C. (4)
Mark scheme
Answer
Mark
Mark scheme
540
P1
for start of process, eg \(350 + 250\ (= 600)\) or \(3 \times 380\ (= 1140)\) or \(380 - 350\ (= 30)\) or \(380 - 250\ (= 130)\)
P1
for process to work with mean and number of seats in at least one cinema, eg \(350 + 250\ (= 600)\) and \(3 \times 380\ (= 1140)\) or \(\text{``}1140\text{''} - 350\ (= 790)\) or \(\text{``}1140\text{''} - 250\ (= 890)\) or for an equation in \(x\), eg \(350 + 250 + x = 3 \times 380\) or \(380 - 350\ (= 30)\) and \(380 - 250\ (= 130)\)
P1
for process to find number of seats in cinema C, eg \(\text{``}1140\text{''} - \text{``}600\text{''}\) or for \((x =)\ \text{``}1140\text{''} - 350 - 250\) \(380 + \text{``}30\text{''} + \text{``}130\text{''}\)
A1
cao
Additional guidance
\(350 + 250 +\) another number scores no marks eg \(350 + 250 + 150\) or \(350 + 250 + 380\)
9 The table shows the number of books read by four people in one month.
Person
Number of books
Ximena
7
Martha
9
Kezia
1
Tabby
5
(a) Work out the median number of books. (2)
(b) Find the range. (1)
(c) On the grid, draw a bar chart to show the information in the table.(3)
Mark scheme (a)
Answer
Mark
Mark scheme
6
M1
for ordering the numbers or showing a complete method of \((5+7) \div 2\)
A1
cao
Mark scheme (b)
Answer
Mark
Mark scheme
8
B1
cao
Mark scheme (c)
Answer
Mark
Mark scheme
Bar chart
B1
for correct person labels or a linear scale
M1
for correct bars showing information for at least 2 people
A1
for a fully correct bar chart with linear scale of numbers on the vertical axis and a set of person labels on the horizontal axis
Additional guidance
Accept key in place of labels Accept unambiguous abbreviations eg Frequency or Number, X,M,K,T Condone bars of varying widths Condone no gaps or inconsistent gaps
(a) Show this information in a stem and leaf diagram.(3)
(b) Find the median number of stickers. (2)
Mark scheme (a)
Answer
Mark
Mark scheme
Diagram
B2
for a fully correct ordered diagram
(B1
for a complete unordered diagram or for an ordered diagram with at most one error or omission)
B1
for correct key eg 7 | 1 or 70 | 1 represents 71 Key must be consistent with the stem
Additional guidance
Accept stem of 70, 80, 90, 100 Can be in reverse vertical order (with matching leaves) eg 10, 9, 8, 7 Errors can be omissions; one number in the wrong position is one error.
Mark scheme (b)
Answer
Mark
Mark scheme
86
M1
for identifying the median, eg “6” circled or an answer of 6 or ft their list or diagram for selection of middle value (allow up to two errors or omission in listing)
A1
for 86 or ft their list or diagram for selection of middle value (allow up to two errors or omission in listing)
8 Four students play a game. The table shows the number of points each student has.
Student
Ali
Barbara
Calliope
Danesh
Number of points
143
121
45
19
Barbara has more points than Danesh.
(a) How many more? (1)
(b) Work out the mean number of points. (2)
Mark scheme (a)
Answer
Mark
Mark scheme
102
B1
cao
Mark scheme (b)
Answer
Mark
Mark scheme
82
M1
for a method of extracting the correct 4 numbers from the table, adding all 4 numbers and then dividing by 4 eg \((143+121+45+19) \div 4\) or \(\text{``}328\text{''} \div 4\)
Show this information in a stem and leaf diagram. (3)
Mark scheme
Answer
Mark
Mark scheme
1
79
2
55677789
3
377
4
57
B2
for a fully correct ordered diagram
(B1
for a complete unordered diagram or for an ordered diagram with at most one error or omission)
Key: eg 2|5 = 25 or 20|5 = 25
B1
for correct key (units not required but must be correct if stated) eg 2|5 or 20|5 represents 25 (years)
Additional guidance
Accept stem of 10, 20, 30, 40 Can be in reverse vertical order (with matching leaves) eg 4, 3, 2, 1 Errors can be omissions; one number in the wrong position is one error.
These missed appointments were a total of 25.3 hours.
Work out the mean length of time for each missed appointment. Give your answer in minutes. (3)
Mark scheme
Answer
Mark
Mark scheme
13.2
P1
process to convert decimal time, eg \(25.3 \times 60\ (= 1518)\) or \(0.3 \times 60\ (= 18)\) OR process to work with mean, eg \([\text{time}] \div 115\ (= 0.22)\) or \(1 \div (115 \div [\text{time}])\ (= 0.22)\)
P1
full process to work out mean time allocated for appointment, eg \(\text{``}1518\text{''} \div 115\) or \(\text{``}0.22\text{''} \times 60\)
A1
cao
Additional guidance
[time] could be 25.3 or any other time that has been incorrectly changed from 25.3 hours
15 The table shows information about the number of social media accounts used by each of 300 students.
Number of social media accounts
Frequency
0
3
1
57
2
84
3
75
4
81
(a) Work out the total number of social media accounts used by these students. (2)
(b) Find the median number of social media accounts used by these students. (2)
Mark scheme (a)
Answer
Mark
Mark scheme
774
M1
for at least three of \(0 \times 3\ (= 0)\) or \(1 \times 57\ (= 57)\) or \(2 \times 84\ (= 168)\) or \(3 \times 75\ (= 225)\) or \(4 \times 81\ (= 324)\) or for \(0 \times 3 + 1 \times 57 + 2 \times 84 + 3 \times 75 + 4 \times 81\)
A1
cao
Additional guidance
Note if 2 non zero products are seen award M1 Use of the figure 777 is enough for M1
Mark scheme (b)
Answer
Mark
Mark scheme
3
M1
for method to begin to work with the median, eg \(300 \div 2\ (= 150)\)
14 Here is the shoe size of each of 12 boys in a class.
4 5 6 6 6 7 7 8 8 8 8 9
(a) Find the median. (1)
(b) Work out the range. (1)
For the shoe sizes of each of 12 girls in the class,
the median size is 6 the range is 3
(c) Compare the distribution of the shoe sizes of the boys with the distribution of the shoe sizes of the girls. (2)
Mark scheme (a)
Answer
Mark
Mark scheme
7
B1
cao
Mark scheme (b)
Answer
Mark
Mark scheme
5
B1
cao
Mark scheme (c)
Answer
Mark
Mark scheme
C2
ft for correct comparison of both medians and ranges, eg median of boys shoe sizes is greater than the median of the girls shoe sizes and the range of the boys shoe sizes is greater than the range of the girls shoe sizes.
(C1
ft for a correct comparison of either medians or ranges)
Additional guidance
Simply quoting values for median, range is insufficient; they must be compared.
18 The incomplete table gives some information about the lengths of the planks of wood in Ben’s workshop.
Length of plank (metres)
Number of planks
3
5
2.5
8
2
1.5
14
1
10
The total length of these planks is 92 metres.
Work out the number of planks of length 2 metres in Ben’s workshop. (3)
Mark scheme
Answer
Mark
Mark scheme
13
P1
for at least two of \(3 \times 5\ (= 15)\) or \(2.5 \times 8\ (= 20)\) or \(1.5 \times 14\ (= 21)\) or \(1 \times 10\ (= 10)\) or for \(3 \times 5 + 2.5 \times 8 + 1.5 \times 14 + 1 \times 10\ (= 66)\)
P1
for process to find length of all 2 m planks, eg \(92 - (3 \times 5 + 2.5 \times 8 + 1.5 \times 14 + 1 \times 10)\ (= 26)\) or \(92 - \text{``}15\text{''} - \text{``}20\text{''} - \text{``}21\text{''} - \text{``}10\text{''}\ (= 26)\)
A1
cao
Additional guidance
Note 66 on its own will score this mark
If no calculations are seen for products allow one error in “15”, “20”, “21”, “10”
13 in the correct place in the table should be accepted as the final answer
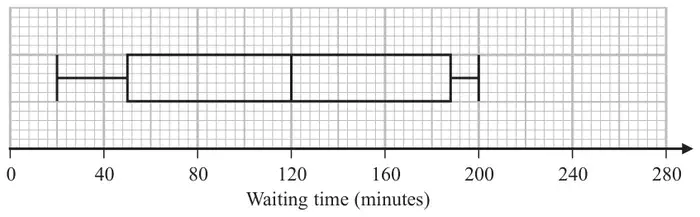
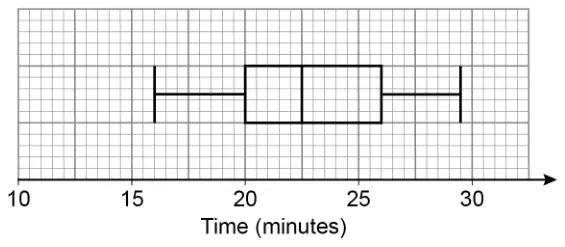
9 The box plot shows information about the length of time, in minutes, some people waited to see a doctor at a hospital on Monday.
(a) Work out the interquartile range of the information in the box plot. (2)
Becky says, “50% of the people waited for at least 2 hours.”
(b) Is Becky correct? Explain why. (1)
The table gives information about the length of time, in minutes, some people waited to see a doctor at the same hospital on Tuesday.
Waiting time (minutes)
Shortest time
20
Lower quartile
50
Median
100
Upper quartile
140
Longest time
210
Becky was asked to compare the distribution of the lengths of times people waited on Monday with the distribution of the lengths of times people waited on Tuesday.
She wrote, “People had to wait longer on Tuesday than on Monday.”
(c) Give one reason why Becky may be wrong. (1)
Mark scheme (a)
Answer
Mark
Mark scheme
138
M1
for upper quartile = 188 or lower quartile = 50 or an indication that they are trying UQ – LQ
A1
cao
Additional guidance
Could be written on the grid
Mark scheme (b)
Answer
Mark
Mark scheme
Yes, with reason
C1
Yes, with reason Acceptable examples Yes, because the median is at 2 hour (120 min) Yes, since 50% is at the 2 hour mark Yes, because the middle is at 2 hours
Not acceptable examples No ….. The median is at the 2 hour mark Yes, because 50% is exactly half way between “188” and “50”
Mark scheme (c)
Answer
Mark
Mark scheme
statement
C1
Acceptable examples The median is lower on Tuesday (higher on Monday) The upper quartile is lower on Tuesday (higher on Monday) There may just have been one person waiting for 210 mins We don’t know how many people were waiting for each time
Not acceptable examples The range is bigger for Tuesday (smaller for Monday) The IQR is smaller for Tuesday (bigger for Monday)
25 4 red bricks have a mean weight of 5 kg. 5 blue bricks have a mean weight of 9 kg. 1 green brick has a weight of 6 kg.
Donna says,
“The mean weight of the 10 bricks is less than 7 kg.”
Is Donna correct? You must show how you get your answer. (3)
Mark scheme
Answer
Mark
Mark scheme
No (supported)
P1
for process to find total weight of the 4 red bricks, eg. \(5 \times 4\ (= 20)\) or for process to find total weight of the 5 blue bricks, eg. \(9 \times 5\ (= 45)\)
P1
for process to find total weight of all 10 bricks, eg. \(\text{``}20\text{''} + \text{``}45\text{''} + 6\ (= 71)\)
C1
No with correct supporting evidence Acceptable examples No, it is 7.1 She is wrong, it is 0.1 more No, (the total weight is) 71 not 70 Not acceptable examples Yes .... No, it is 71
Additional guidance
May be seen next to statements 20 must be clearly referenced to the red bricks. \(5 + 9 + 6 = 20\) scores no marks
Candidates working in grams will need to give 7100 and 7000 for example as comparable figures.
6 4 red bricks have a mean weight of 5 kg. 5 blue bricks have a mean weight of 9 kg. 1 green brick has a weight of 6 kg.
Donna says,
“The mean weight of the 10 bricks is less than 7 kg.”
Is Donna correct? You must show how you get your answer. (3)
Mark scheme
Answer
Mark
Mark scheme
No (supported)
P1
for process to find total weight of the 4 red bricks, eg. \(5 \times 4\ (= 20)\) or for process to find total weight of the 5 blue bricks eg. \(9 \times 5\ (= 45)\)
P1
for process to find total weight of all 10 bricks, eg. \(\text{``}20\text{''} + \text{``}45\text{''} + 6\ (= 71)\)
C1
No with correct supporting evidence Acceptable examples No, it is 7.1 She is wrong, it is 0.1 more No, (the total weight is) 71 not 70 Not acceptable examples Yes … No, it is 71
Additional guidance
May be seen next to statements 20 must be clearly referenced to the red bricks. \(5 + 9 + 6 = 20\) gets no marks
Candidates working in grams will need to give 7100 and 7000 for example as comparable figures
18 The table shows information about the numbers of points scored by 30 students in a quiz.
Number of points
Frequency
0
4
1
3
2
7
3
5
4
6
5
5
(a) Find the modal number of points. (1)
(b) Work out the total number of points scored. (2)
Mark scheme (a)
Answer
Mark
Mark scheme
2
B1
cao
Mark scheme (b)
Answer
Mark
Mark scheme
81
M1
for working with values from the table eg \((0 \times 4), (1 \times 3), \ldots\) with at least 3 products shown correct or (0 +), 3, 14, 15, 24, 25 with at least 3 correct
A1
cao SC B1 for 85
Additional guidance
Check working space or next to the table. Zero points may not be seen so accept without \(0 \times 4\), 0
11 A bus company recorded the ages, in years, of the people on coach A and the people on coach B.
Here are the ages of the 23 people on coach A.
41
42
44
48
52
53
53
53
56
57
57
59
60
61
63
64
64
66
67
69
74
77
79
(a) Complete the table below to show information about the ages of the people on coach A.
Median
Lower quartile
Upper quartile
Least age
41
Greatest age
79
(2)
Here is some information about the ages of the people on coach B.
Median
70
Lower quartile
54
Upper quartile
73
Least age
42
Greatest age
85
Richard says that the people on coach A are younger than the people on coach B.
(b) Is Richard correct? You must give a reason for your answer. (1)
Richard says that the people on coach A vary more in age than the people on coach B.
(c) Is Richard correct? You must give a reason for your answer. (1)
Mark scheme (a)
Answer
Mark
Mark scheme
59, 53, 66
B2
for Median = 59, LQ = 53, UQ = 66, may be seen in working
(B1
for one correct)
Mark scheme (b)
Answer
Mark
Mark scheme
Yes, with reason
C1
for Yes and comment comparing median ages, ft from (a)
Additional guidance
Acceptable examples “59” < 70 All statistics/values are lower for coach A (so they are younger) Median is lower The middle age is lower on coach A
Not acceptable examples Median is higher Median for coach A is “59” and coach B is 70 The oldest on coach A is 79 and the oldest on coach B is 85 There are people on coach B that are older than on coach A
Mark scheme (c)
Answer
Mark
Mark scheme
No, with reason
C1
for No and comment comparing spreads of ages from ranges or IQRs, ft from (a)
Additional guidance
Acceptable examples 38 < 43 or “13” < 19 Greater difference between greatest and least age for coach B Range for coach B is larger than coach A The range of ages is wider on coach B than on coach A The range is 5 greater on coach B There is a smaller difference between the lower and upper quantiles on coach A than on coach B The IQR is shorter for coach A
Not acceptable examples Quartiles are less for coach A 53 < 54 or 79 < 85 (oe) Range for coach A is 38 and range for coach B is 43 Coach A ranges from 41-79 but coach B ranges from 42-85
Working A: Range = 38, IQR = “13” B: Range = 43, IQR = 19
There are 19 buttons or 20 buttons or 21 buttons or 22 buttons in each bag.
The table gives some information about the number of buttons in each bag.
Number of buttons
Frequency
19
……
20
7
21
3
22
1
The total number of buttons is 320
Complete the table. (3)
Mark scheme
Answer
Mark
Mark scheme
5
P1
for start to process eg \(7 \times 20\ (= 140)\) and \(3 \times 21\ (= 63)\) or \((7 \times 20) + (3 \times 21) + 22\ (= 225)\)
P1
for a complete process to find the missing frequency eg \((320 - \text{``}225\text{''}) \div 19\) or \(320 - \text{``}225\text{''} = (95)\) and \(\text{``}95\text{''} \div 19\)
A1
cao
Additional guidance
May be written near table \(7 \times 20\ (= 140)\) and \(3 \times 21\ (= 63)\) minimum requirement for P1
May be seen as two calculations
Please check the table. Correct answer in the table without working award 3 marks
(a) Show this information in a stem and leaf diagram.(3)
One of these students is going to be chosen at random.
The pass mark in the French test is 71
Omar writes,
The probability that this student failed the French test is \(\dfrac{1}{4}\)
Omar is wrong.
(b) Explain why. (2)
Mark scheme (a)
Answer
Mark
Mark scheme
Stem and leaf diagram
B2
for correct ordered stem and leaf
(B1
for fully correct unordered or ordered with one error or omission)
B1
(indep) for key (units not required but must be correct if stated) eg 6 | 4 = 64 (marks)
Correct diagram
6
4799
7
0015667
8
0011247
9
14
Mark scheme (b)
Answer
Mark
Mark scheme
Explanation
C1
for identifying “6” students failed (ft their diagram) OR for \(20 \div 4\ (= 5)\)
C1
for comparing \(\dfrac{1}{4}\) with \(\dfrac{6}{20}\) or \(\dfrac{3}{10}\) (ft their diagram) OR for comparing “6” with 5
Additional guidance
Explanation does not need to state that Omar is wrong, but just needs to provide two comparable values (that are not the same) unless ft values show that Omar is not wrong in which case a statement is needed.
12 The table shows information about the heights, in cm, of a group of Year 11 girls.
height (cm)
least height
154
median
165
lower quartile
161
interquartile range
7
range
20
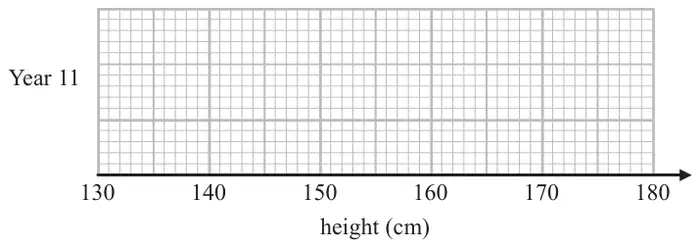
(a) Draw a box plot for this information.(3)
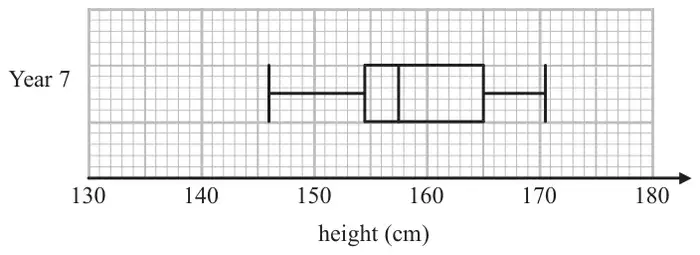
The box plot below shows information about the heights, in cm, of a group of Year 7 girls.
(b) Compare the distribution of heights of the Year 7 girls with the distribution of heights of the Year 11 girls. (2)
Mark scheme (a)
Working
Answer
Mark
Notes
\(161 + 7\) \(154 + 20\)
Box plot
M1
for method to find UQ (168) or highest value (174), may be implied by correct values plotted
M1
for showing a box and at least 3 correctly plotted values from 154, 161, 165, 168, 174
A1
for fully correct box plot
Mark scheme (b)
Working
Answer
Mark
Notes
Med IQR Range Y11 165 7 20 Y7 157.5 10.5 24.5
Comparison
C1
(ft) for comparison of the median
C1
(ft) for comparison of the spread NB: for award of both marks, at least one comparison must be in context. NB: figures need not be stated, but if they are they must be correct (ft)
5 The table shows information about the weekly earnings of 20 people who work in a shop.
Weekly earnings (£\(x\))
Frequency
\(150 \lt x \leqslant 250\)
1
\(250 \lt x \leqslant 350\)
11
\(350 \lt x \leqslant 450\)
5
\(450 \lt x \leqslant 550\)
0
\(550 \lt x \leqslant 650\)
3
(a) Work out an estimate for the mean of the weekly earnings. (3)
Nadiya says,
“The mean may not be the best average to use to represent this information.”
(b) Do you agree with Nadiya? You must justify your answer. (1)
Mark scheme (a)
Answer
Mark
Notes
365
M1
\(fx\) with \(x\) consistent within intervals eg \(200 \times 1\), \(300 \times 11\), \(400 \times 5\), \(500 \times 0\), \(600 \times 3\), if 200, 3300, 2000, 0, 1800 are seen without working then condone 1 error
M1
(dep) \(\Sigma fx \div \Sigma f\) eg \(\text{``}7300\text{''} \div 20\)
17 The table shows some information about the dress sizes of 25 women.
Dress size
Number of women
8
2
10
9
12
8
14
6
(a) Find the median dress size. (1)
3 of the 25 women have a shoe size of 7
Zoe says that if you choose at random one of the 25 women, the probability that she has either a shoe size of 7 or a dress size of 14 is \(\dfrac{9}{25}\) because
\[\frac{3}{25} + \frac{6}{25} = \frac{9}{25}\]
(b) Is Zoe correct? You must give a reason for your answer. (1)
Mark scheme (a)
Answer
Mark
Notes
12
B1
cao
Mark scheme (b)
Answer
Mark
Notes
Explanation
C1
No with statement about not being mutually exclusive events eg a person could be in both categories
3 The table shows some information about the dress sizes of 25 women.
Dress size
Number of women
8
2
10
9
12
8
14
6
(a) Find the median dress size. (1)
3 of the 25 women have a shoe size of 7
Zoe says that if you choose at random one of the 25 women, the probability that she has either a shoe size of 7 or a dress size of 14 is \(\dfrac{9}{25}\) because
\[\frac{3}{25} + \frac{6}{25} = \frac{9}{25}\]
(b) Is Zoe correct? You must give a reason for your answer. (1)
Mark scheme (a)
Answer
Mark
Notes
12
B1
cao
Mark scheme (b)
Answer
Mark
Notes
Explanation
C1
No with statement about not being mutually exclusive events eg a person could be in both categories
Draw an ordered stem and leaf diagram for these heights.
(3)
Mark scheme
Working
Answer
Mark
Notes
3
1 3 7
4
1 4 4 7 8 8
5
1 2 3 5 6 6 6
6
0 1 3 4
Diagram and key
3
B2 for fully correct diagram (accept a stem of 30, 40, 50, 60, the order of the numbers in the stem may be reversed) (B1 for one error or omission or unordered diagram with no errors) B1 for a correct key (units may be omitted but must be correct if stated) eg 3 | 1 = 31 (mm)
20 Chloe recorded the test marks of 20 students. The stem and leaf diagram shows this information.
1
5 7 8 9
2
0 0 3 7 8
3
1 4 5 6 8 9
4
1 2 2 6 7
Key: 1 | 5 means 15 marks
(a) Find the median mark. (2)
(b) Work out the range of the marks. (2)
The pass mark for the test is 25
(c) How many of the 20 students did not pass the test? (1)
Mark scheme (a)
Answer
Mark
Notes
32.5
2
M1 for median value is 10.5th evidenced by 10th and 11th seen or “31, 34” written or \((31 + 34) \div 2\) (condone missing brackets) or both 31 and 34 identified in the stem and leaf diagram or in a fully ordered list A1 for 32.5 (accept \(32\frac{1}{2}\))
10 Steve went on holiday. He recorded the number of photos he took each day. Here are his results.
20 14 21 19 27 31 19 19 24 21
(a) Find the mode. (1)
(b) Work out the mean. (2)
Steve saves his photos on a memory card. The memory card has 1000 megabytes of memory space. Each photo uses 2.4 megabytes of memory space. Steve has saved 320 photos on the memory card.
(c) Work out how many more photos Steve can save on the memory card. (3)
Mark scheme (a)
Answer
Mark
Notes
19
1
B1 cao
Mark scheme (b)
Answer
Mark
Notes
21.5
2
M1 for evidence of adding all 10 numbers and dividing by 10 eg \((20 + 14 + 21 + 19 + 27 + 31 + 19 + 19 + 24 + 21) \div 10\) or \(215 \div 10\) or \(x \div 10\) seen where \(205 \leqslant x \leqslant 225\) A1 cao
Mark scheme (c)
Answer
Mark
Notes
96
3
M1 for \(320 \times 2.4\) (= 768) or for \(1000 \div 2.4\) (= 416.6 or 416) M1 for \((1000 - 320 \times 2.4) \div 2.4\) or for \(1000 \div 2.4 - 320\) or an answer of 96.6(66...) or 96.7 or 97 A1 cao
(a) Show this information in an ordered stem and leaf diagram.(3)
One of these students is going to be chosen at random.
(b) Find the probability that this student has a test mark less than 28 (2)
Mark scheme (a)
Answer
Mark
Notes
1
4 6 8 9
2
1 2 3 5 7 9
3
0 4 6 8 8
4
1 3 6 6 8
3
B2 for correct ordered stem and leaf (B1 for fully correct unordered, or ordered with one error or omission) B1 (indep) for key (units not required but must be correct if stated) eg. 1 | 4 = 14 (marks)
Mark scheme (b)
Answer
Mark
Notes
\(\dfrac{9}{20}\) oe
2
B2 for \(\dfrac{9}{20}\) oe or ft from stem and leaf diagram (B1 for \(\dfrac{x}{20}\) where \(x \lt 20\), \(x \neq 9\) or \(\dfrac{9}{y}\) where \(y \gt 9\) or ft from stem and leaf diagram)
Draw an ordered stem and leaf diagram for these lengths. (3)
Mark scheme
Working
Answer
Mark
Notes
2 | 3 5 8 9 3 | 2 5 7 8 9 4 | 1 2 4 5 | 1 6 | 1 3
Stem and leaf with key
3
B2 for a fully correct ordered stem and leaf (B1 for a correct unordered stem and leaf or for an ordered stem and leaf with at most 1 error or omission) B1 (indep) for a correct key (units not required)
B2 for a correct ordered stem and leaf diagram (B1 for fully correct unordered or ordered with one error or omission) B1 (indep) for key (units not required)
Mark scheme (b)
Answer
Mark
Notes
15
2
M1 for a method to find "3" as a percentage of the total number of men, eg \(\dfrac{\text{``}3\text{''}}{\text{``}20\text{''}} \times 100\) oe \(\dfrac{\text{``}3\text{''} \times 5}{100}\) or ft from their diagram A1 for 15 cao
10 Here is the number of goals scored by a football team in each of its first 10 games.
3 1 4 2 0 1 1 1 3 2
(a) Write down the mode. (1)
(b) Work out the mean number of goals for the first 10 games. (2)
In the 11th game the team scored 4 goals. In the 12th game the team scored 2 goals.
(*c) Will the mean number of goals for the 12 games be greater than or less than the mean number of goals for the first 10 games? You must explain your answer. (2)
Mark scheme (a)
Answer
Mark
Notes
1
1
B1 cao
Mark scheme (b)
Answer
Mark
Notes
1.8
2
M1 for adding all 10 scores and dividing by 10 eg \(18 \div 10\) A1 cao
Mark scheme (c)
Answer
Mark
Notes
Greater and explanation
2
M1 (ft from (b)) adding all 12 scores and dividing by 12 or for comparing 4 and 2 with ‘1.8’ or comparing \(4 + 2\) with \(2 \times \text{‘}1.8\text{’}\) C1 (ft from (b)) for correct conclusion and correct explanation NB: if M1 A1 awarded in (b) comparison must be with 1.8
B2 for a fully correct ordered diagram (B1 for a correct unordered diagram or ordered with at most two errors or omissions with stems 8, 9, 10 and 11 present) B1 for a correct key (units not necessary) Accept stem written as 80, 90, etc. but key only if consistent with this
At noon one day he records the number of customers sitting at each table in the cafe.
Here are his results.
Number of customers sitting at a table
Number of tables
0
4
1
5
2
10
3
7
4
3
5
1
(a) Work out the total number of tables in the cafe. (1)
(b) Work out the total number of customers sitting at tables in the cafe. (2)
(c) Work out the mean number of customers sitting at a table. (2)
Mark scheme (a)
Answer
Mark
Notes
30
1
B1 cao
Mark scheme (b)
Answer
Mark
Notes
63
2
M1 for [(4 × 0)] + (5 × 1) + (10 × 2) + (7 × 3) + (3 × 4) + (1 × 5) Or [0] + 5 + 20 + 21 + 12 + 5 condone one error or omission or for 67 given as total A1 cao
Mark scheme (c)
Answer
Mark
Notes
2.1
2
M1 for an attempt to divide the number of customers by the number of tables A1 for 2.1 or ft from (a) and (b)
B2 for fully correct diagram. Accept a stem of 10, 20, etc. (B1 for ordered with at most 2 errors or omissions or for correct unordered diagram) B1 for a correct key (units may be omitted) consistent with diagram.
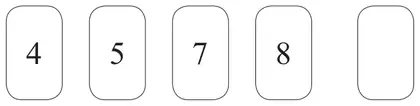
There is a whole number from 0 to 9 on each card. The number on the last card is hidden.
The range of the five numbers is 6
(a) Write down the whole number on the last card. (1)
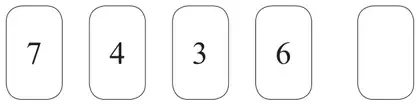
Here is a different set of five cards.
There is a different whole number from 0 to 9 on each card. The number on the last card is hidden.
The median of the numbers on the five cards is 4
(b) Which whole numbers could be on the last card? (2)
Mark scheme (a)
Answer
Mark
Notes
2
1
B1 cao
Mark scheme (b)
Answer
Mark
Notes
0, 1, 2
2
M1 for any two of 0, 1, 2 correct with no extras or for showing 3, 4, 6, 7 as consecutive numbers in an ordered list (ignore numbers before or after 3, 4, 6, 7 and allow an extra 4 written within the list 3, 4, 4, 6, 7). A1 fully correct answer in any order
Show this information in an ordered stem and leaf diagram. (3)
Mark scheme
Answer
Mark
Notes
1
7 8 8 9
2
0 0 1 2 3 5 9
3
3 7 7
4
2
1 | 8 represents 18
3
B2 for a fully correct ordered diagram (B1 for correct unordered diagram or ordered with at most two errors or omissions) B1 for a correct key Accept stem written as 10, 20 etc but key only acceptable if consistent with this
9 The stem and leaf diagram gives information about the numbers of tomatoes on 31 tomato plants.
0
8 8 9
1
1 1 5 5
2
1 2 2 6 7 8 8
3
0 2 5 5 7 9
4
2 2 3 5 8 8
5
1 1 3 4 7
Key: 5 | 7 = 57 tomatoes
(a) Work out the median. (1)
(b) Work out the interquartile range. (2)
Mark scheme (a)
Answer
Mark
Notes
32
1
B1 cao
Mark scheme (b)
Working
Answer
Mark
Notes
LQ = 21 UQ = 45
24
2
M1 for 45 or 21 or 43.5 or 19.5 or 7.75thor 8thor 23.25thor 24th (all of above may be seen in working space or indicated on S&L) or clear attempt to find UQ and LQ from a list of values or in stem and leaf diagram A1 cao
4 Here are the speeds, in miles per hour, of 16 cars.
31
52
43
49
36
35
33
29
54
43
44
46
42
39
55
48
Draw an ordered stem and leaf diagram for these speeds. (3)
Mark scheme
Working
Answer
Mark
Notes
2
9
3
1 3 5 6 9
4
2 3 3 4 6 8 9
5
2 4 5
OR
20
9
30
1 3 5 6 9
40
2 3 3 4 6 8 9
50
2 4 5
2
9
3
1 3 5 6 9
4
2 3 3 4 6 8 9
5
2 4 5
Key: 2 | 9 = 29
3
B3 for fully correct diagram with appropriate key (B2 for ordered leaves, with at most two errors or omissions and a key OR correct unordered leaves and a key OR correct ordered leaves) (B1 for unordered or ordered leaves, with at most two errors or omissions OR key) NB : Order of stem may be reversed; condone commas between leaves
(a) £4.56 is paid using the smallest possible number of coins.
What is the modal value of the coins used?
You must show your working. [2 marks]
(b) Here is a list of five numbers.
5 9 4 16 8
An extra number is put into the list.
The median of the numbers is now 7
Work out the extra number. [2 marks]
Mark scheme (a)
Answer
Mark
Comments
Answer £2 and £2, £2, 50p, 5p, 1p
B2
any order B1 Answer £2 or a set of coins which total £4.56 or correct modal value for their set of coins SC1 Answer 2 and 2, 2, 50, 5, 1 or Answer 2 and 2, 2, 0.50, 0.05, 0.01
Additional guidance
SC1 is for an otherwise correct response with all or some units missing eg Answer 2 and £2, 2, 50p, 5, 1
SC1
Units must be seen on answer and all coins for B2
Units must be seen for B1 on answer £2 or on all coins for a set of coins which total £4.56 or on answer and all coins for the correct modal value for their set of coins
Accept £0.50, condone £0.50p
Units of the form 0.50p are incorrect
Use of one or more coins that do not exist is max B1 for Answer £2
Answer £2 and 2, 2, 50, 5, 1
B1
2, 2, 50, 5, 1 without answer £2
B0
£1, £1, £1, £1, 50p, 5p, 1p
B1
Answer 1 and 1, 1, 1, 1, 50, 5, 1
B0
Mark scheme (b)
Answer
Mark
Comments
ordered list 4 5 8 9 16 or ordered list with an extra number (extra may be correct or incorrect) or indication of middle numbers as 6 and 8
M1
list in ascending or descending order
6
A1
Additional guidance
M1 may be awarded for correct work with no answer or incorrect answer, even if this is seen amongst multiple attempts
4 5 7 8 9 16 (ordered list with incorrect extra)
M1
4 5 8 9 16 1 (ordered list with incorrect extra)
M1
4 5 6 8 9 16 (ordered list with correct extra) and answer 7
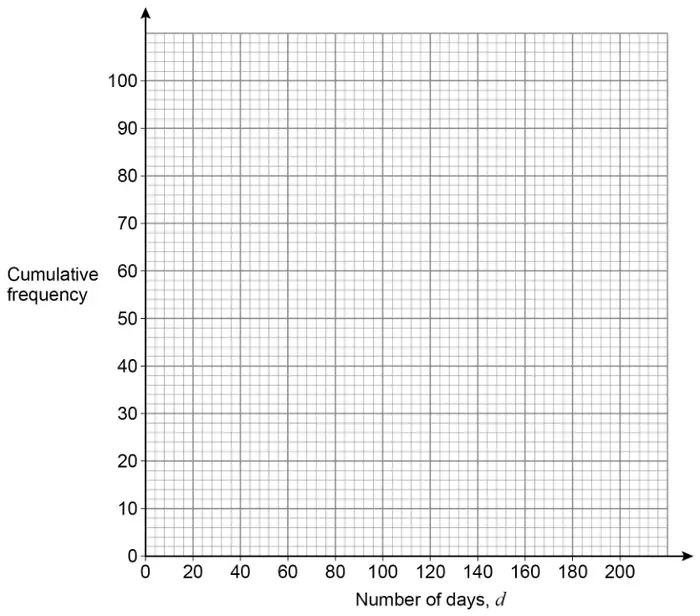
The number of days each battery lasted was recorded.
(a) The frequency table represents the results for type P.
Number of days, \(d\)
Frequency
\(0 \leqslant d \lt 40\)
2
\(40 \leqslant d \lt 80\)
9
\(80 \leqslant d \lt 120\)
26
\(120 \leqslant d \lt 160\)
45
\(160 \leqslant d \lt 200\)
18
On the grid, draw a cumulative frequency diagram to represent the data. [3 marks]
(b) For type Q,
the median was 126 days the interquartile range was 57 days.
Compare the number of days that types P and Q lasted.
Make one statement about the average and one statement about the spread.
Use statistical measures to support your statements. [4 marks]
Mark scheme (a)
Answer
Mark
Comments
2 11 37 82 100
B1
may be implied by plots
Correct cf diagram with points joined with a smooth curve or lines
B2ft
\(\pm \dfrac{1}{2}\) small square ft their cf values which must be increasing for B2 or B1 B1ft cf diagram with all points plotted at their heights but not at correct horizontal positions or cf diagram with all points plotted at correct horizontal positions with at least 4 of their heights correct or all points plotted correctly at their heights but cf diagram not drawn or drawn poorly
Additional guidance
Ignore diagram to the left of their (40, 2)
For B2ft the diagram must end at (200, their 100) unless followed by a horizontal line
Histogram only
Max B1B0
Histogram and cf diagram
Mark the cf diagram
Mark scheme (b)
Answer
Mark
Comments
Correct median for their cumulative frequency diagram
B1ft
ft their diagram which must be increasing \(\pm \dfrac{1}{2}\) small square
Correct comparison of their type P median with 126
B1ft
answers must be in context eg P lasts longer or P is better
Correct interquartile range for their cumulative frequency diagram
B1ft
ft their diagram which must be increasing \(\pm \dfrac{1}{2}\) small square
Correct comparison of their type P interquartile range with 57
B1ft
answers must be in context eg P is more consistent or P is more reliable or Q is more varied
Additional guidance
2nd and 4th marks - ignore irrelevant or incorrect statements alongside a correct statement as long as not contradictory
eg (P median = 132) P lasts longer by 8 (error) minutes
2nd B1
P’s average is bigger
2nd B0
P’s median is greater
2nd B0
P’s spread is smaller
4th B0
P’s IQR is lower
4th B0
Q is more spread out
4th B0
2nd and 4th marks can be awarded even if their diagram is not increasing
2nd and 4th marks can be awarded even if the methods used for P’s median and IQR are incorrect
14 Here is a list of 11 whole numbers in numerical order.
The lower quartile, median, upper quartile and highest value are missing.
5
8
13
19
25
28
34
median \(= 2 \times\) lower quartile
upper quartile \(= 2.5 \times\) lower quartile
range \(= 2 \times\) interquartile range
Complete the list. [2 marks]
Mark scheme
Answer
Mark
Comments
12 24 30 41
B2
B1 their median \(= 2 \times\) their LQ with the first eight values in order and their UQ and their last number \(\geqslant\) their median or their UQ \(= 2.5 \times\) their LQ with the first ten numbers in order and their last number \(\geqslant\) their UQ or their range \(= 2 \times\) their interquartile range with all values in order
Additional guidance
Take the boxes to be the LQ, median, UQ and highest value in that order
Decimal values can score up to B1 eg 11.5 23 29 40 has median \(= 2 \times\) LQ
\(2\;\;4\;\;4\;\;8\;\;10\;\;11\;\;12\;\;15\) or \(2\;\;4\;\;4\;\;8\;\;10\) or \(15\;\;12\;\;11\;\;10\;\;8\) or 8 and 10 or \(18 \div 2\) or \(\dfrac{8 + 1}{2}\)th or 4.5th value
M1
full list of numbers in either order allow one missing, extra or transcription error in an otherwise full list of numbers list of first or last five numbers in either order allow only a transcription error in a list of the first or last five numbers oe works out the position of the median in the list
9
A1
Additional guidance
Ordered list in the stem of the question can be assumed to be for part (b) unless contradicted by the working seen in the working space
Numbers in a list may be seen crossed out in an attempt to find the median
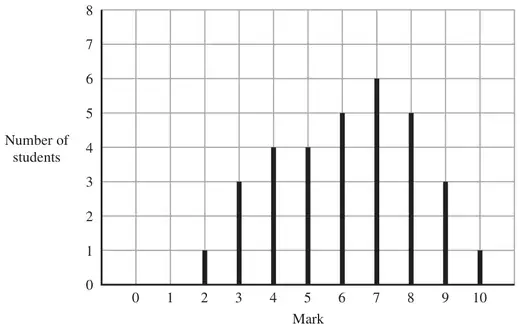
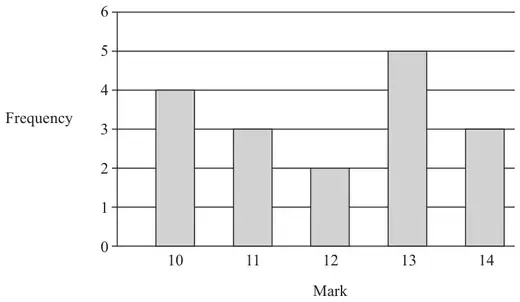
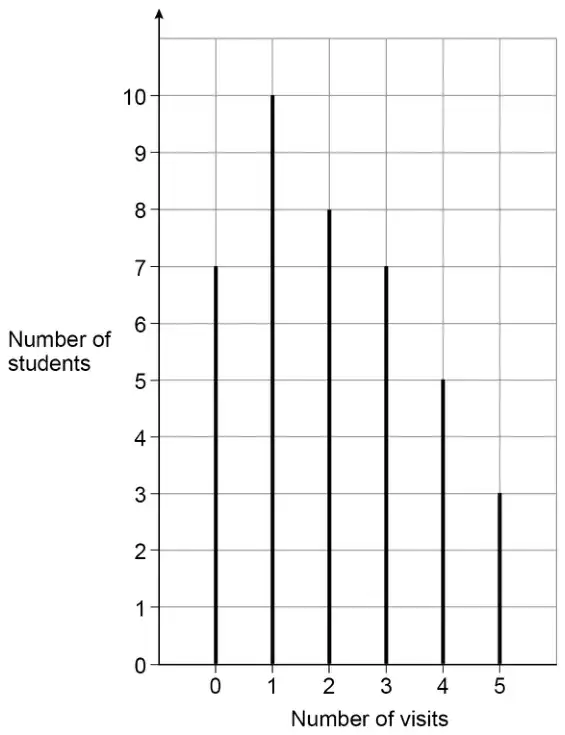
16 40 students were asked the number of visits they made to a gym one week.
The chart shows information about the results.
(a) Write down the modal number of visits. [1 mark]
(b) Work out the mean number of visits.
Give your answer as a decimal. [3 marks]
(c) One of the 40 students is chosen at random.
Work out the probability that the student visited the gym at least once. [2 marks]
Mark scheme (a)
Answer
Mark
Comments
1
B1
Additional guidance
1 with 10 indicated as the greatest frequency eg 1 scores 10
B1
1 (10)
B0
1, 10 is the most
B0
1 and 10
B0
Mark scheme (b)
Answer
Mark
Comments
\((0 \times 7\) and\()\) \(1 \times 10\) and \(2 \times 8\) and \(3 \times 7\) and \(4 \times 5\) and \(5 \times 3\) or (0 and) 10 and 16 and 21 and 20 and 15 or 82
M1
allow one error or omission
\(\dfrac{(0 +)\, 10 + 16 + 21 + 20 + 15}{40}\) or \(82 \div 40\) or their \(82 \div 40\)
M1dep
oe eg \(\dfrac{82}{40}\) or \(\dfrac{41}{20}\) or \(2\dfrac{1}{20}\)
22 A school play takes place each day from Monday to Friday.
Here are the attendances on four of the days.
Monday
Tuesday
Wednesday
Thursday
72
83
88
97
For all five days, the mean attendance is 90
Work out the attendance on Friday. [3 marks]
Mark scheme
Answer
Mark
Comments
Alternative method 1
\(90 \times 5\) or 450 or \(\dfrac{72 + 83 + 88 + 97 + x}{5}\) or \(\dfrac{340 + x}{5}\)
M1
oe any letter or symbol
\(90 \times 5 - 72 - 83 - 88 - 97\) or \(90 \times 5 - 340\) or \(72 + 83 + 88 + 97 + x = 90 \times 5\) or \(340 + x = 90 \times 5\)
M1dep
oe any letter or symbol equations must have fraction eliminated
110
A1
Alternative method 2
Trial of any value with mean correctly evaluated
M1
also allow if given to the next or previous integer eg1 trial of 100 \(\dfrac{72 + 83 + 88 + 97 + 100}{5} = 88\) eg2 trial of 78 \(\dfrac{340 + 78}{5} = 83\) (or 84 or 83.6) ignore trials with mean not evaluated or incorrectly evaluated
Trial of 110 with mean evaluated to 90
M1dep
eg \(\dfrac{72 + 83 + 88 + 97 + 110}{5} = 90\) this mark implies M1M1
110
A1
Alternative method 3
\(\dfrac{72 + 83 + 88 + 97}{4}\) or \(\dfrac{340}{4}\) or 85
M1
oe
their \(85 + 5 \times (90 -\) their 85) or their \(85 + 5 \times 5\) or their \(85 + 25\)
M1dep
oe \(90 + 4 \times (90 -\) their 85)
110
A1
Alternative method 4
\(\dfrac{72 + 83 + 88 + 97}{5}\) or \(\dfrac{340}{5}\) or 68
8 A school play takes place each day from Monday to Friday.
Here are the attendances on four of the days.
Monday
Tuesday
Wednesday
Thursday
72
83
88
97
For all five days, the mean attendance is 90
Work out the attendance on Friday. [3 marks]
Mark scheme
Answer
Mark
Comments
Alternative method 1
\(90 \times 5\) or 450 or \(\dfrac{72 + 83 + 88 + 97 + x}{5}\) or \(\dfrac{340 + x}{5}\)
M1
oe any letter or symbol
\(90 \times 5 - 72 - 83 - 88 - 97\) or \(90 \times 5 - 340\) or \(72 + 83 + 88 + 97 + x = 90 \times 5\) or \(340 + x = 90 \times 5\)
M1dep
oe any letter or symbol equations must have fraction eliminated
110
A1
Alternative method 2
Trial of any value with mean correctly evaluated
M1
also allow if given to the next or previous integer eg1 trial of 100 \(\dfrac{72 + 83 + 88 + 97 + 100}{5} = 88\) eg2 trial of 78 \(\dfrac{340 + 78}{5} = 83\) (or 84 or 83.6) ignore trials with mean not evaluated or incorrectly evaluated
Trial of 110 with mean evaluated to 90
M1dep
eg \(\dfrac{72 + 83 + 88 + 97 + 110}{5} = 90\) this mark implies M1M1
110
A1
Alternative method 3
\(\dfrac{72 + 83 + 88 + 97}{4}\) or \(\dfrac{340}{4}\) or 85
M1
oe
their \(85 + 5 \times (90 -\) their \(85)\) or their \(85 + 5 \times 5\) or their \(85 + 25\)
M1dep
oe \(90 + 4 \times (90 -\) their \(85)\)
110
A1
Alternative method 4
\(\dfrac{72 + 83 + 88 + 97}{5}\) or \(\dfrac{340}{5}\) or 68
M1
oe
\(5 \times (90 -\) their \(68)\) or \(5 \times 22\)
19 A company sells bags of toffees and bags of mints.
Here are the numbers of sweets in 11 bags of toffees. 55 50 49 51 55 47 54 50 49 55 57
Here are the numbers of sweets in 10 bags of mints. 46 47 47 48 48 50 53 54 54 54
The company claims that the average number of sweets per bag is at least 50
Using medians, is the company’s claim correct for each type of sweet?
You must work out the median for toffees and the median for mints. [4 marks]
Toffees
Tick a box for toffees.
Yes
No
Mints
Tick a box for mints.
Yes
No
Mark scheme
Answer
Mark
Comments
Puts toffees in order or orders the numbers to at least the sixth number from either end 47, 49, 49, 50, 50, 51 or 57, 55, 55, 55, 54, 51 or gives median of toffees as 51
M1
allow one error or omission on an attempt at a full list
Identifies 48 and 50 for mints or gives median of mints as 49
M1
eg circled in list or vertical line between 48 and 50
51 for toffees and 49 for mints
A1
with no errors seen
Yes for toffees and No for mints
A1ft
correct decision for their values with M1M1 awarded and a single median given for each
Additional guidance
Ignore modes or means if medians also given, but modes or means only scores zero
Beware of medians coming from only using the distinct values: 47, 49, 50, 51, 54, 55, 57 46, 47, 48 | 50, 53, 54
M0
For the A1ft, the median may be a decimal eg 47, 49, 49, 50, 50, 51, 51, 54, 55, 55, 57 median = 50.5 \(48 + 50 = 98\), \(98 \div 2 = 44\) Yes for toffees, No for mints
Work out a possible set of values for \(a\), \(b\) and \(c\). [3 marks]
Mark scheme
Answer
Mark
Comments
\(a = 2\) and \(b = 4\) and \(c = 5\) or \(a = 4\) and \(b = 2\) and \(c = 5\) or \(a = 0\) and \(b = 6\) and \(c = 5\)
B3
B2 \(a + b = 6\) with integer values of \(a \geqslant 0\) and \(b \geqslant 1\) B1 \(c = 5\) or \(a + b + c = 11\) with integer values of \(a \geqslant 0\) and \(b \geqslant 0\) and \(c \geqslant 0\) or 13th value = 3 and 14th value = 4 stated or correct median position indicated on a list
Additional guidance
Values may be seen alongside or in the table
Blank answer line does not indicate zero for that value eg \(a =\) ____ \(b = 6\) \(c = 5\)
Work out a possible set of values for \(a\), \(b\) and \(c\). [3 marks]
Mark scheme
Answer
Mark
Comments
\(a = 2\) and \(b = 4\) and \(c = 5\) or \(a = 4\) and \(b = 2\) and \(c = 5\) or \(a = 0\) and \(b = 6\) and \(c = 5\)
B3
B2 \(a + b = 6\) with integer values of \(a \geqslant 0\) and \(b \geqslant 1\) B1 \(c = 5\) or \(a + b + c = 11\) with integer values of \(a \geqslant 0\) and \(b \geqslant 0\) and \(c \geqslant 0\) or 13th value = 3 and 14th value = 4 stated or correct median position indicated on a list
Additional guidance
Values may be seen alongside or in the table
Blank answer line does not indicate zero for that value eg \(a =\) _____ \(b = 6\) \(c = 5\)
She asks a sample of five people in a book club how many books they read last month.
The table shows the results.
Lynn
Ali
Paul
Chen
Ruth
Number of books
10
11
8
10
13
(a) Show how Naga could use the data to support her hypothesis. [2 marks]
(b) Give two reasons why this sample should not be used to support her hypothesis. [2 marks]
Mark scheme (a)
Answer
Mark
Comments
120 and 132 and 96 and 156 and states that 4 out of 5 would be above 100 or 8.3… and states that 4 out of 5 would be above 100 or \(10.4 \times 12 = 124.8\) and states this is above 100 or the hypothesis is correct or median or mode = 10 and \(10 \times 12 = 120\) and states that median or mode is above 100 or \(52 \times 12\) (= 624) and \(5 \times 100\) (= 500) and states \(624 > 500\)
B2
B1 \(10 \times 12\) or 120 and \(11 \times 12\) or 132 and \(8 \times 12\) or 96 and \(13 \times 12\) or 156 or \(100 \div 12\) or 8.3… or states that 4 out of 5 would be above 100 with no or incorrect evaluations or \(10.4 \times 12 = 124.8\) or median or mode = 10 and \(10 \times 12 = 120\) or \(52 \times 12\) (= 624) and \(5 \times 100\) (= 500)
Additional guidance
‘4 out of 5’ is implied by ‘most people’
\((10 + 11 + 8 + 10 + 13) \div 5 = 10.4\)
B0
\(52 \times 12\) or 624 alone
B0
Mark scheme (b)
Answer
Mark
Comments
Any two correct reasons from The sample is biased The sample is too small They may not read at the same rate in other months
B2
oe eg people in book clubs read more books eg she should ask a lot more people eg that month may not be representative B1 any one correct reason
13 The amounts spent on clothes by 40 boys and 40 girls in one month were recorded.
The table shows information about the amounts spent by the boys.
Amount, \(x\) (£)
Midpoint
Number of boys
\(0 \leqslant x < 20\)
22
\(20 \leqslant x < 40\)
9
\(40 \leqslant x < 60\)
6
\(60 \leqslant x < 80\)
3
Total = 40
The mean for the girls was £35
Estimate the mean for the girls as a percentage of the mean for the boys. [5 marks]
Mark scheme
Answer
Mark
Comments
Alternative method 1
Any three of [9.5, 10.5] \(\times\) 22 or [209, 231] and [29.5, 30.5] \(\times\) 9 or [265.5, 274.5] and [49.5, 50.5] \(\times\) 6 or [297, 303] and [69.5, 70.5] \(\times\) 3 or [208.5, 211.5] or 1000
M1
(their [209, 231] + their [265.5, 274.5] + their [297, 303] + their [208.5, 211.5]) \(\div\) 40 or \(1000 \div 40\)
M1dep
oe condone bracket error if working seen eg \(220 + 270 + 300 + 210 \div 40\)
25
A1
\(\dfrac{35}{\text{their } 25}\) or \(\dfrac{7}{5}\) or 1.4
Any three of [9.5, 10.5] \(\times\) 22 or [209, 231] and [29.5, 30.5] \(\times\) 9 or [265.5, 274.5] and [49.5, 50.5] \(\times\) 6 or [297, 303] and [69.5, 70.5] \(\times\) 3 or [208.5, 211.5] or 1000
M1
\(35 \times 40\) or 1400
M1
1000 and 1400
A1
\(\dfrac{\text{their } 1400}{\text{their } 1000}\) or \(\dfrac{7}{5}\) or 1.4
M1dep
oe eg \(1 + \dfrac{\text{their } 1400 - \text{their } 1000}{\text{their } 1000}\) dep on M2
140
A1ft
ft their 1400 and their 1000 with M3 scored
Additional guidance
Alt 1 Correct products seen in the table but a different method not using their products used for the mean shown in the working lines eg \(40 \div 4 = 10\) can score a maximum of M0M0A0M1A1ft
Alt 1 \(1000 \div 4\) (= 250) is not a misread
NB The dependency of the M marks and the requirement for applying A1ft are different for the two alternative methods
Alt 1 3rd M1 Allow any number for their 25 (unless it contradicts their mean)
Alt 1 3rd M1 and A1ft If there is a mean for the boys allow the M mark to be implied by a correct ft answer eg from a mean of 250 allow M1A1ft for 14%
For A1ft allow answers to the nearest whole number or better
Further work after working out the percentage is 3rd M0 eg Mean = 25 \(\dfrac{35}{\text{their } 25} \times 100 = 140\) 140 – 100 = 40 Answer 40
Ignore attempts to simplify or convert a correct fraction
B1
Ignore probability words unless contradictory, eg \(\dfrac{4}{50}\) unlikely
B1
4 out of 50 or 4 in 50 or 4 : 50 is B0 however, condone 4 out of 50 or 4 in 50 with a correct fraction, decimal or percentage (together on answer line) but do not accept 4 : 50 with a correct fraction, decimal or percentage (together on answer line)
B1 B0
\(\dfrac{4}{50}\) seen, but answer 4
B0
Mark scheme (c)
Answer
Mark
Comments
\(8 + 10 + 14 + 7\) or \(50 - 4 - 7\) or \(50 - 11\) or 39
M1
allow one error (but not omission) in the 4 frequencies being added frequencies may be seen as numerators of fractions (as probabilities) – ignore denominators as long as they are all the same and all probabilities are < 1 in subtraction method, both frequencies must be correct Condone 51 for 50 for M1
\(\dfrac{39}{50}\)
A1
oe fraction, decimal or percentage eg 0.78 78%
Additional guidance
Ignore attempts to simplify or convert a correct fraction
M1A1
\(\dfrac{8}{100} + \dfrac{10}{100} + \dfrac{14}{100} + \dfrac{6.5}{100}\) (frequencies have one error and no omissions, seen as probabilities, with same denominator)
M1A0
\(1 - \dfrac{11}{50}\) or \(1 - \dfrac{7}{50} - \dfrac{4}{50}\) is correct for M1 (allow \(\dfrac{50}{50}\) in place of 1) also accept the above with any consistent denominator eg \(\dfrac{52}{52} - \dfrac{11}{52}\)
at least M1 M1A0
\(\dfrac{39}{50}\) then 39 as final answer
M1A0
39 out of 50 or 39 in 50 or 39 : 50 is M1A0 however, condone 39 out of 50 or 39 in 50 with a correct fraction, decimal or percentage (together on answer line) but do not accept 39 : 50 with a correct fraction, decimal or percentage (together on answer line)
M1A1 M1A0
Ignore probability words unless contradictory, eg \(\dfrac{39}{50}\) unlikely
M1A0
Numbers may be shown on the diagram but must then be added (or subtracted from 50 as appropriate) to score M1
She records the number of planes landing between 10 am and 2 pm each day.
The table shows the data for the first 10 days in January.
Day
1
2
3
4
5
6
7
8
9
10
Number of planes
148
151
147
155
153
147
155
102
151
154
(a) The airport was affected by fog on one of the days.
Which day do you think it was?
Give a reason for your answer. [1 mark]
(b) Kim uses the data to predict how many planes will land at the airport in a year.
In her method, she
uses an estimate of 150 planes in each 4-hour period throughout the day assumes the same number of planes each day.
Work out her prediction. [3 marks]
(c) In fact,
fewer planes land in winter than in summer fewer planes land at night than during the day.
What does this tell you about Kim’s prediction?
Tick one box.
Her prediction is too low
Her prediction is too high
Her prediction could be too low or too high
Give a reason for your answer. [2 marks]
Mark scheme (a)
Answer
Mark
Comments
8 and lowest (value) or 8 and outlier
B1
oe Accept 102 for day 8
Additional guidance
8 and ‘(Only 102 landed whereas) All the other days were over 140’
B1
8 and ‘Fewer (less) planes landed (than the other days)’
B1
8 and ‘It’s an anomaly’
B1
8 and ‘There was a (big) drop / reduction / decrease in the number of planes’
B1
8 and ‘There were only 102 planes’
B1
8 and ‘It’s low’ or 8 and ‘It’s lower’ or 8 and ‘It’s too low’
B1
8 and ‘It doesn’t follow the trend (or pattern)’
B1
8 and ‘It reduces a lot that day’
B1
Ignore a non-contradictory statement with a correct statement eg 8 and It’s the lowest, it dropped by 53’
B1
Do not award B1 with a numerical error in the statement eg 8 and ‘It’s the lowest by 40’
B0
8 and ‘There were 102 planes’
B0
8 and ‘There’s a drop of 53 (implies a point to point comparison)’
B0
8 and ‘It’s below average’
B0
8 and ‘It’s the odd one out’
B0
Mark scheme (b)
Answer
Mark
Comments
Alternative method 1
\(150 \times 24 \div 4\) or \(150 \times 6\) or 900
M1
oe
their \(900 \times 365\) or their \(900 \times 7 \times 4 \times 12\) or their \(900 \times 7 \times 52\) or 302 400 or 360 000
M1dep
for 365, allow 336, 360, 364, 366, 370 and 400
324 000 or 327 600 or 328 500 or 329 400 or 333 000
A1
Alternative method 2
\(365 \times 150\) or 54 750 or \(365 \times\) any multiple of 150
M1
for 365, allow 336, 360, 364, 366, 370 and 400 for 54 750 allow 50 400, 54 000, 54 600, 54 900, 55 500 and 60 000
their \(54\,750 \times 24 \div 4\) or 302 400 or 360 000
M1dep
324 000 or 327 600 or 328 500 or 329 400 or 333 000
A1
Alternative method 3
\(365 \times (24 \div 4)\) or \(365 \times 6\) or 2190
M1
for 365, allow 336, 360, 364, 366, 370 and 400 for 2190, allow 2016, 2160, 2184, 2196, 2220 and 2400
their \(2190 \times 150\) or 302 400 or 360 000
M1dep
324 000 or 327 600 or 328 500 or 329 400 or 333 000
A1
Mark scheme (c)
Answer
Mark
Comments
Ticks ‘Her prediction could be too low or too high’ and explains that fewer landings in winter would make it too low, but fewer landings at night would make it too high or states that the actual numbers are not given
B2
oe reason B1 ticks ‘Her prediction could be too low or too high’
Additional guidance
Ticks ‘Her prediction could be too low or too high’ and states that there is not enough data
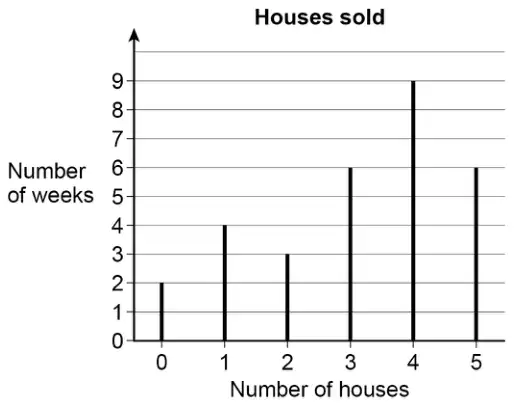
The line graph shows the number sold per week for 30 weeks.
(a) Work out the range of the number of houses sold per week. [2 marks]
(b) Work out the median number of houses sold per week. [2 marks]
(c) The company sells three houses.
The prices are £185 000, £239 000 and £136 000
The company earns 2% commission on each house.
In total, how much commission does the company earn on these three houses? [3 marks]
Mark scheme (a)
Answer
Mark
Comments
0 and 5 identified
M1
5
A1
Additional guidance
0 – 5 or 0 to 5 and answer 5
M1A1
0 – 5 or 0 to 5 without answer 5
M1A0
\(30 \div 6 = 5\)
M0A0
Mark scheme (b)
Answer
Mark
Comments
\(\dfrac{3 + 4}{2}\) or \(\dfrac{30 + 1}{2}\) or 15.5 or (between) 15th and 16th (value) or identifies 3 and 4 or correct numbers listed in either order to at least 16th value 0, 0, 1, 1, 1, 1, 2, 2, 2, 3, 3, 3, 3, 3, 3, 4 or 5, 5, 5, 5, 5, 5, 4, 4, 4, 4, 4, 4, 4, 4, 4, 3
M1
3.5
A1
Additional guidance
Correct ordered list of at least 16 terms starting from 0 or 5
She records the number of planes landing between 10 am and 2 pm each day.
The table shows the data for the first 10 days in January.
Day
1
2
3
4
5
6
7
8
9
10
Number of planes
148
151
147
155
153
147
155
102
151
154
(a) The airport was affected by fog on one of the days.
Which day do you think it was?
Give a reason for your answer. [1 mark]
(b) Kim uses the data to predict how many planes will land at the airport in a year.
In her method, she
uses an estimate of 150 planes in each 4-hour period throughout the day assumes the same number of planes each day.
Work out her prediction. [3 marks]
(c) In fact,
fewer planes land in winter than in summer fewer planes land at night than during the day.
What does this tell you about Kim’s prediction?
Tick one box.
Her prediction is too low
Her prediction is too high
Her prediction could be too low or too high
Give a reason for your answer. [2 marks]
Mark scheme (a)
Answer
Mark
Comments
8 and lowest (value) or 8 and outlier
B1
oe Accept 102 for day 8
Additional guidance
8 and ‘(Only 102 landed whereas) All the other days were over 140’
B1
8 and ‘Fewer (less) planes landed (than the other days)’
B1
8 and ‘It’s an anomaly’
B1
8 and ‘There was a (big) drop / reduction / decrease in the number of planes’
B1
8 and ‘There were only 102 planes’
B1
8 and ‘It’s low’ or 8 and ‘It’s lower’ or 8 and ‘It’s too low’
B1
8 and ‘It doesn’t follow the trend (or pattern)’
B1
8 and ‘It reduces a lot that day’
B1
Ignore a non-contradictory statement with a correct statement eg 8 and It’s the lowest, it dropped by 53’
B1
Do not award B1 with a numerical error in the statement eg 8 and ‘It’s the lowest by 40’
B0
8 and ‘There were 102 planes’
B0
8 and ‘There’s a drop of 53 (implies a point to point comparison)’
B0
8 and ‘It’s below average’
B0
8 and ‘It’s the odd one out’
B0
Mark scheme (b)
Answer
Mark
Comments
Alternative method 1
\(150 \times 24 \div 4\) or \(150 \times 6\) or 900
M1
oe
their \(900 \times 365\) or their \(900 \times 7 \times 4 \times 12\) or their \(900 \times 7 \times 52\) or 302 400 or 360 000
M1dep
for 365, allow 336, 360, 364, 366, 370 and 400
324 000 or 327 600 or 328 500 or 329 400 or 333 000
A1
Alternative method 2
\(365 \times 150\) or 54 750 or \(365 \times\) any multiple of 150
M1
for 365, allow 336, 360, 364, 366, 370 and 400 for 54 750 allow 50 400, 54 000, 54 600, 54 900, 55 500 and 60 000
their \(54\,750 \times 24 \div 4\) or 302 400 or 360 000
M1dep
324 000 or 327 600 or 328 500 or 329 400 or 333 000
A1
Alternative method 3
\(365 \times (24 \div 4)\) or \(365 \times 6\) or 2190
M1
for 365, allow 336, 360, 364, 366, 370 and 400 for 2190, allow 2016, 2160, 2184, 2196, 2220 and 2400
their \(2190 \times 150\) or 302 400 or 360 000
M1dep
324 000 or 327 600 or 328 500 or 329 400 or 333 000
A1
Mark scheme (c)
Answer
Mark
Comments
Ticks ‘Her prediction could be too low or too high’ and explains that fewer landings in winter would make it too low, but fewer landings at night would make it too high or states that the actual numbers are not given
B2
oe reason B1 ticks ‘Her prediction could be too low or too high’
Additional guidance
Ticks ‘Her prediction could be too low or too high’ and states that there is not enough data
\(t \geqslant 15\) product must be 0 if seen condone bracket error seen eg \(30 + 52.5 + 12.5 \div 20\)
4.75
A1
accept 4.8 or 5 if full working shown using correct midpoints
Additional guidance
Two correct from 30, 52.5 and 12.5 implies the first mark and could be used to score up to M2
M1
Midpoints used in the ranges [2, 3], [7, 8] and [12, 13] must be seen eg \(2.5 \times 12\) and \(7 \times 7\) and 12 \((\times 1)\) or \(3 \times 12\) and \(7 \times 7\) and 13 \((\times 1)\) NB These could be used to score up to M2
M1
Correct products seen in the table but a different method shown in the working lines eg \(20 \div 4 = 5\)
Orders the numbers to at least the sixth number from either end 1 2 2 3 4 5 (\(\ldots\ \ldots\ \ldots\ \ldots\)) or 8 6 5 5 5 4 (\(\ldots\ \ldots\ \ldots\ \ldots\)) or 4 and 5 indicated or \(\dfrac{4 + 5}{2}\)
Allow one value omitted or incorrect if method clear
4.1 or \(4\dfrac{1}{10}\)
A1
Additional guidance
Answer of 4 with correct working or 4.1 seen
M1A1
Answer of 4 without correct working and without 4.1 seen
M0A0
Condone missing first and/or final bracket for M1
If their total is not 41, all additions must be shown or implied eg they write \(5 + \ldots + 2 = 42\) and \(42 \div 10\) eg they write \(5 + 6 + 1 +\) etc \(= 24\) and \(24 \div 10\) (both clearly implying that they are adding up all the numbers – minimum is two of the values shown as being added)
M1A0
but, for example, \(42 \div 10\) (no other working)
M0
Method mark could be scored for work at top of page, above, but not in, part (a) It cannot be assumed that work done in part (a) is intended for part (b)
Answer of \(\dfrac{41}{10}\) or \(\dfrac{4.1}{1}\) or 4 r(emainder) 1
20 In one month, the number of hours of exercise taken by 10 people are
4 7 2 8 6 5 1 82 3 9
Which is the appropriate average to use in this situation?
Tick a box.
Mean
Median
Mode
Give one reason for each of the other two averages as to why they are not appropriate. [2 marks]
Mark scheme
Answer
Mark
Comments
Median ticked and a valid reason for not using mode (eg there is no mode) and a valid reason for not using mean (eg 82 will affect the mean disproportionately)
B2
B1 median ticked or valid reason to reject mean or valid reason to reject mode with any box or no box ticked
Additional guidance
Accept any indication in place of a tick
Ignore non-contradictory statements alongside a correct reason
Median ticked with reasons “There is no mode” and “82 would skew the mean”
B2
No box or mode ticked with reason “Not mean, because of the 82”
B1
No box or mean ticked with reason “Not mode, all the numbers are different”
B1
No box or mode ticked with statement that 82 is very large
B0
Condone “one number” oe for “82” in reason for mean if intention is clear, eg “One of the numbers is far bigger than the others”
Do not accept reasons for the mean indicating that 12.7 is too high unless 82 is also mentioned
Do not accept reasons given with the wrong measure eg “It cannot be the mean as they’re all different”
Do not accept a reason which simply defines mean and mode
Giving reasons for mode and mean does not imply a selection of median – the box must be ticked to achieve both marks
Median ticked with two valid reasons which are not attributed to median and mode eg median ticked and “There is not a repeated number” and “82 is far too high to calculate the average”
Condone the omission of brackets Accept one error or omission in reading from diagram
4.7
A1
oe
Additional guidance
5 on answer line with 4.7 in working
M1A1
4 on answer line with 4.7 in working
M1A0
\((4 + 2 + 4 + 8 + 8 + 7 + 9) \div 10\) is one omission \((4 + 2 + 4 + 8 + 8 + 7 + 9 + 6) \div 10\) is one error \((6 + 12 + 15 + 13) \div 10\) assume one error \((25 + 23) \div 10\) assume one error \(2.5 + 2.3\) assume one error
M1
Do not accept further calculation after 4.7 seen \(47 \div 10 = 4.7\) \(4.7 \times 4 = 18.8\)
M1A0
Use of away goals only, treat as misread from the words in part (a) \((2 + 8 + 7 + 5) \div 10\) or 2.2 condone the omission of brackets
M1A0
5 on answer line without working
M0A0
\((6 + 12 + 15) \div 10\) assume two omissions
M0A0
Mark scheme (c)
Answer
Mark
Comments
Alternative method 1
\(4 + 4 + 8 + 9\) and \(2 + 8 + 7 + 5\) or 25 and 22
M1
Accept one error in reading from diagram
3
A1
Alternative method 2
\(4 - 2\) or 2 and \(4 - 8\) or \(-4\) and \(8 - 7\) or 1 and \(9 - 5\) or 4
M1
Accept one error in reading from diagram Differences may be seen on the diagram
3
A1
Additional guidance
\(25 - 22 = 3\)
M1A1
\(4 - 2 = 2\) and \(4 - 8 = -4\) and \(8 - 6 = 2\) and \(9 - 5 = 4\) is one reading error
M1
\(4 - 2 = 2\) and \(4 - 8 = 4\) and \(8 - 7 = 1\) and \(9 - 5 = 4\)
M1
\(4 + 4 + 8 + 9\) and \(2 + 7 + 7 + 5\) is one reading error \(24 - 21 = 3\)
M1 A0
1st 2 2nd 4 3rd 1 4th 4 is one error in calculation without working
M0A0
1st 2 3rd 1 4th 4 is one omission
M0A0
\(24 - 21 = 3\) with no other working
M0A0
\(4 + 4 + 8 + 8\) and \(2 + 8 + 6 + 5\) is two reading errors \(24 - 21 = 3\)
M0 A0
Mark scheme (d)
Answer
Mark
Comments
No and valid reason eg Indicates that one or more home teams might have won a game or games by a lot of goals
B1
Additional guidance
In numerical examples relating to results, the total home goals must be more than the total away goals and there cannot be more home wins than away wins eg
No, the scores could have been 2-0 6-0 0-3 0-2 2-2 3-3 3-3 4-4 4-4 1-1
B1
No, the scores could have been 2-0 6-0 0-3 0-2 and then all draws
B1
If scores are given, assume home team first
Use of ‘they’ implies the home team in a statement relating to a team eg No, because they could score more just in one game
B1
No, the home team scored 0 in 9 matches and 25 in the final game
B1
No, the home team may have scored lots in one game
B1
No, multiple goals could be scored by a home team in one game
B1
No, the away team win a lot of games by one goal and lose by a lot of goals in one game
B1
Yes with or without an explanation
B0
No, the away team win a lot of games by one goal
B0
No, multiple goals could be scored in one game
B0
No, more goals scored at home but it doesn’t mean that they won more
B0
No, we don't know how many goals were scored in each game
B0
No, the home team scored more goals in some games than others
25 A town council are going to do a survey on how people travel to work or school and for how long they travel.
One day their interviewer stands outside the town railway station and chooses 20 people at random to form their sample.
Make three different criticisms or suggestions for improving the council’s method for selecting their sample. [3]
Mark scheme
Answer
Marks
Part marks and guidance
Three correct and different criticisms or suggestions for improvement
3
We need three statements, only one from each category (in guidance) for 3 marks. B2 for two correct or B1 for one correct
Different means different category Note : the same criticism and suggestion e.g. standing by station will only get people using trains and they should stand in the middle of town is only 1 mark
Categories:
Larger sample size
Vary the time (hour or day)
Vary the location e.g biased towards railway users
No control over numbers of genders
No control over numbers in age groups
see appendix for exemplars and treat stratified sample as one category (usually age or gender)
Appendix
Exemplar responses for Q25
Larger sample size
Vary the time (hour or day)
Vary the location e.g biased towards railway users
No control over numbers of genders
No control over numbers in age groups
Response
Mark
1
The sample size is too small (1)
1
2
20 people is not enough (1)
1
3
Too few people (1)
1
4
Ask a wider group of people (1)
1(BOD)
5
He only got a sample for one day (2)
1
6
Do School and work on different days(2)
1
7
Do this more than once because schools might be closed (2)
1
8
Only on one day(2)
1
9
Only in one place (3)
1
10
They assume they all travel by train (3)
1
11
Go to bus stop and other places(3)
1
12
Look at different modes of transport (3)
1
13
There may not be school students if school isn’t near a railway station(3)
1
14
It excludes other methods of transport (3)
1
15
Some people may not take the train to work or school (3)
1
16
Go to more than 1 location / area (3)
1
17
Ask random people in town centre(3)
1
18
Consider different factors such as gender (4)
1
19
Ask a variety of people (4 or 5)
1
20
They should select only workers or schoolchildren (5)
1
21
Use different aged people (5)
1
22
Use a stratified sample(4 or 5)
1
23
Survey the same amount of old people and young people (5)
The table and the histogram each show part of this information.
Mass (\(m\) kg)
\(0 \lt m \leqslant 2\)
\(2 \lt m \leqslant 5\)
\(5 \lt m \leqslant 10\)
\(10 \lt m \leqslant 20\)
Frequency
12
18
(a) Complete the table and the histogram. [4]
(b) The heaviest parcel is 19.5 kg.
Complete the inequality to represent the range, \(R\) kg, of the masses of the parcels.
\(\ldots\ldots \leqslant R \lt \ldots\ldots\) [2]
Mark scheme (a)
Answer
Marks
Part marks and guidance
Completes table with \(0 \lt m \leqslant 2\) = 5 and \(10 \lt t \leqslant 20\) = 3
4
B2 for both frequencies correct in table or B1 for one frequency correct in table
and
Draws correct bars on histogram \(2 \lt m \leqslant 5\) to 4 \(5 \lt m \leqslant 10\) to 3.6
B2 for both bars correct
or B1 for one bar correct or M1 for [FD’s =] 12 ÷ 3 oe and 18 ÷ 5 oe soi
Bar must touch correct horizontal line for the majority of the interval For B2 no gaps between bars Do not accept omission of horizontal line at 4 on first bar
A fourth number is added to the list. The mean of the four numbers is 13.
Work out the fourth number. [3]
Mark scheme
Answer
Marks
Part marks and guidance
19
3
M2 for \((13 \times 4) - (8 + 15 + 10)\) oe or for \(8 + 15 + 10 + 19 = 52\) or \(\dfrac{8 + 15 + 10 + 19}{4} = 13\) or M1 for \(13 \times 4\) maybe implied by 52 or for \(\dfrac{8 + 15 + 10 + x}{4} = 13\) or better or for \(\dfrac{8 + 15 + 10 + c}{4}\) correctly evaluated for their value of \(c\)
14 A teacher is planning a theme day for the 500 pupils at their school. The teacher asks a sample of 20 pupils from year 8 which theme they would prefer.
The results are shown in the table.
Theme
Number of pupils
Sport
7
Art and design
3
Recipes
2
Music and movies
8
(a) Describe two disadvantages of the teacher’s sampling method. [2]
(b) Using the results from the table the teacher estimates that 175 pupils in the school would prefer a sport theme.
Here is the teacher’s method.
\(\frac{7}{20} \times 500 = 175\)
Write down one assumption the teacher has made when making their estimate. [1]
Mark scheme (a)
Answer
Marks
Part marks and guidance
Any two from
2
B1 for each correct reason
Accept e.g:
Small sample oe
They should have asked more pupils Do not accept they should ask all the pupils
Limited to one age group oe
They should have asked different age groups
May all be one gender oe
They should make sure they ask males and females
Accept two disadvantages given in one statement
Ignore incorrect statements
Mark scheme (b)
Answer
Marks
Part marks and guidance
The sample is representative of the whole school oe
1
See Appendix 3
Appendix 3: Q14(b)
Response
Mark
1
The sample is representative of the whole school (in mark scheme)
1
2
The same proportion of pupils will choose sports for the rest of the school
1
3
That the 7 [ or 20] students reflect the choices of the rest
1
4
7/20 of the rest of the school will choose sports
1
5
The teacher assumes the sample will be proportional for all 500 pupils
1
6
For every 20 people [in the school] 7 will choose sport
1
7
The ratio/fraction/proportion stays the same if more/all people were asked
1
8
Every 20 people will give the same response
1
9
The sample reflects the rest of the school (hints at representative sample)
1
10
The whole school has the same interests as year 8 (BOD hints at representative sample)
1
11
That 7 out of 20 is accurate (It is accurate as the results for the sample)
0
12
Other students in the school will choose the same theme (Not referring to proportion/fraction)
0
13
The same amount will choose sports for the rest of the years (needs proportion not amount)
0
14
There will be 175 students that prefer a sports theme (Not referring to sample)
0
15
All of the students will take part / attend /choose an option
6 A six-sided numbered spinner is thrown 50 times. The score for each throw is recorded. Some of the results are shown in the table.
An 8 was thrown \(f\) times. An unknown number on the spinner is represented by \(n\).
Score
Frequency
1
12
3
2
5
9
6
16
8
\(f\)
\(n\)
4
Total
50
The mean score of the 50 throws is 5.5 .
Find the value of \(f\) and the value of \(n\). [4]
Mark scheme
Answer
Marks
Part marks and guidance
[\(f\) =] 7 [\(n\) =] 15
4
B1 for [\(f\) =] 7 AND B3 for [\(n\) =] 15 or M2 for 50 × 5.5 – (1 × 12 + 3 × 2 + 5 × 9 + 6 × 16 + 8 × their 7) [÷ 4] or better or forming an equation and attempting to solve it correctly e.g. (1 x 12)+(3 x 2) + (5 x 9) + (6 x16) + (8 x their f) +( \(n\) x 4) = 5.5 x 50 or better or M1 for 50 × 5.5 or 275 or 1 × 12 + 3 × 2 + 5 × 9 + 6 × 16 + 8 × their 7 or 215
Note : if \(f\) is an error FTtheir f for the M marks
M2 implied by 60 or 275 – their 215 better = 12 + 6 + 45 + 96 + their 56
Common error is 1 + 3 + 5 + 6 + 8 = 23 5.5 × 6 = 33 and 33 – 23 =10 scores M0
17 Charlie weighs many apples. The weights of the apples are summarised below.
heaviest apple = 75 g
range = 50 g
median = 60 g
lower quartile = 45 g
50% of the apples weigh between 45 g and 65 g
mean = 63 g
(a)
(i) Write down the interquartile range for the weights of the apples, in g. [1]
(ii) Write down the percentage of the apples that weigh between 45 g and 60 g. [1]
(b) Draw a box plot to show the distribution of the weights of the apples.[3]
(c) Charlie eats two of the apples. The apples that they eat weigh 58 g and 66 g.
Charlie says
The mean weight of all the apples was 63 g. I ate one apple that weighed less than the mean and another apple that weighed more than the mean. Therefore, the mean of the remaining apples will still be 63 g.
13 At the end of each day, a driver works out the mean distance they have driven so far that week.
At the end of 5 days, the mean distance they have driven is 185.5 miles per day.
At the end of 6 days, the mean distance they have driven is 190 miles per day.
Work out how many miles the driver drove on the sixth day of that week.
.................... miles [4]
Mark scheme
Answer
Marks
Part marks and guidance
212.5
4
M1 for \(185.5 \times 5\) may be implied by 927.5 M1 for \(190 \times 6\) may be implied by 1140 M1 for their \(190 \times 6\) – their \(185.5 \times 5\)
Alt method e.g. M2 for \((190 - 185.5) \times 5\) M1 for their \((190 - 185.5) \times 5 + 190\)
14 In a dance competition, four judges award marks to each dancer. Each judge can award 1, 2, 3, 4 or 5 marks. The four judges’ median mark, \(m\), is put into the formula
\[S = 10m - 5\]
to get the dancer’s score, \(S\).
(a) Sam is awarded marks of 4, 3, 1 and 4. Work out Sam’s score. [3]
(b) Taylor gets a score of 40. Taylor says
The judges must have awarded marks of 4, 4, 5 and 5 because the median is 4.5 and \(4.5 \times 10 - 5 = 40\).
Why is Taylor not correct? Show working to support your reason. [2]
Mark scheme (a)
Answer
Marks
Part marks and guidance
30
3
B1 for [median =] 3.5 M1 for their median \(\times 10 - 5\)
Accept only 30 for 3 marks If 4 (mode) or 3 (mean) or other wrong value from 1 to 4 used, M1 still available
Mark scheme (b)
Answer
Marks
Part marks and guidance
At least one from 1, 4, 5, 5 2, 4, 5, 5 3, 4, 5, 5 or one judge awards 1, 2 or 3 oe and 4, 5, 5 [stay the same]
2
B1 for four values in order with median 4.5 with one not from 1 to 5 or for one judge awards 1, 2 or 3 without mentioning 4, 5, 5
Condone inclusion of 4, 4, 5, 5 with another correct list Accept 1 to 3 for 1, 2 or 3 and condone 4 included e.g. 1 to 4 Accept “the rest stay the same” oe for 4, 5, 5
22 A journalist is going to do a survey to find out whether people aged 15 or less spend more time playing computer games than people aged more than 15.
The journalist says their sample will be the first 20 people leaving a particular shop after 9 am next Monday.
(a) Give one reason why the journalist’s sample is unlikely to give reliable information. [1]
(b) Make three suggestions to help the journalist obtain a sample that may give more reliable information. [3]
Mark scheme (a)
Answer
Marks
Part marks and guidance
Correct reason
1
e.g. all could be children oe all could be adults oe too small a sample vary the time various age groups
See Appendix
Mark scheme (b)
Answer
Marks
Part marks and guidance
Any three from:
Larger sample size Vary the time of day/day Ensure equal numbers [of older and younger people are asked] Vary the location
3
B1 for each
isw incorrect reasons
See Appendix
Appendix
Exemplar responses Q22a
Response
Mark
School starts at 9am
1
There might be no one below 15
1
Because he could ask more people that are 15 than people aged more than 15
1
The first 20 might all be the same age
1BOD
People under the age of 15 will at school and most over the age of 15 may be at college or work
1BOD
People leaving a particular shop
1BOD
Not diverse enough
0
Not everybody may be out at the time the survey is taken
0
How do we know they all played games
0
Won’t know what age they’ll be
0
Exemplar responses Q22b
Response
Mark
Use statistics from other days
1
Make the survey available online implies more people and different age groups
1
Go to the schools and ask individually every person, confirm ages, equal amounts of both under and over 18
0, 0, 1BOD
Make sure you ask their age
0
It should be a closed question
0
The journalist should be unbiased
0
Go to school in a certain year and ask 20 students
0
Go to a game shop
0
have a wider time range as there is no time range/limit
0
Do it on a Tuesday as just on a different day of the week would make no difference
0
Asking people of all ages not the same as ensuring equal numbers
0
Ask female. And male not relevant to data required
12 The box plot shows the distribution of the lengths, in cm, of 60 full-grown mice owned by a pet shop.
(a) Find the range. [2]
(b) Work out the number of these mice that have a length of at least 7.2 cm. [2]
(c) Sam owns 5 full-grown mice. Sam picks the third longest mouse and measures its length. Sam then looks at the box plot.
Sam says
This mouse is 7.35 cm long. Therefore, the mice I own are longer than the full-grown mice owned by the pet shop.
(i) Give a mathematical reason to support Sam’s conclusion. [1]
(ii) Give a mathematical reason why Sam’s conclusion may be unreliable. [1]
Mark scheme (a)
Answer
Marks
Part marks and guidance
0.64
2
M1 for 7.64 – 7 or 7 to 7.64
Mark scheme (b)
Answer
Marks
Part marks and guidance
45
2
M1 for 0.75 × 60 oe
Mark scheme (c)
Answer
Marks
Part marks and guidance
(i) Sam’s mouse/median is longer than the box plot’s median oe
1
With no incorrect statement Accept ‘middle’ for ‘median’ Accept 7.35 > 7.28 It is above the box plot median [7.28]
(ii) Spread/range/IQR of Sam’s lengths is not known oe or sample is too small oe
1
With no incorrect statement Accept ‘He only measured the middle mouse’ oe Accept ‘Lengths of Sam’s other mice are not known’ oe Sam only has 5 mice which makes the data unreliable for comparison
10 Mr and Mrs Wilde have five children who are all different ages.
The mean age is 6.4.
The range is 9.
The median is 6.
The oldest child is 12.
Work out the ages of the children. Write their ages from youngest to oldest. [4]
Mark scheme
Answer
Marks
Part marks and guidance
3, 4, 6, 7, 12
4
B1 for 6 or 12 placed in correct position B1 for 3 in the correct position M1 for \((6.4 \times 5) - (12 + 6 + 3)\) soi by 11 or by 4 and 7 or by any two numbers in the second and fourth positions between 3 and 5 inclusive, and between 6 and 8 inclusive which sum to 11
4 These are the heights, in metres, of the players in a netball team.
1.30 1.13 1.20 1.23 1.22 1.24 1.15
(a)
(i) Find the median height of the 7 players. [2]
(ii) Work out the range of the heights of the 7 players. [2]
(iii) The sum of the heights of the 7 players is 8.47 m.
Calculate the mean height of the 7 players. [2]
(b) The tallest player is replaced by a substitute. The median height of the players is unchanged. The mean height of the players becomes smaller.
Write down a possible height for the substitute. [2]
Mark scheme (a)
Answer
Marks
Part marks and guidance
(i) 1.22
2
M1 for six or seven heights seen in the correct order
1.13, 1.15, 1.20, 1.22, 1.23, 1.24, 1.30
(ii) 0.17 or 17 cm
2
M1 for 1.30 – 1.13 or 30 – 13 soi
(iii) 1.21
2
M1 for 8.47 \(\div\) 7 soi
Mark scheme (b)
Answer
Marks
Part marks and guidance
\(x\) such that \(1.22 \le x \lt 1.30\)
2
M1 for selecting a value stating/indicating that this leaves median unchanged or for selecting a value stating/indicating that this reduces the value of mean or for selecting a value stating/indicating that this reduces the total of the heights
2 The police record the speed of vehicles passing a speed checkpoint. The speeds are recorded in the table below.
Speed (s mph)
Number of vehicles
\(0 \lt s \leqslant 20\)
5
\(20 \lt s \leqslant 40\)
8
\(40 \lt s \leqslant 50\)
37
\(50 \lt s \leqslant 60\)
47
\(60 \lt s \leqslant 80\)
3
(a) Calculate an estimate of the mean speed of the vehicles. [4]
(b) Explain why it is not possible to use the information from this table to calculate the exact value of the mean speed. [1]
Mark scheme (a)
Answer
Marks
Part marks and guidance
47.5
4
B1 for at least four of 10, 30, 45, 55, 70 M1 FT for Σmf where m is a value within each group 10×5 + 30×8 + 45×37 + 55×47 + 70×3 soi by 50 + 240 + 1665 + 2585 + 210 or 4750 M1 FT dep on M1 for their 4750 ÷ their (5 + 8 + 37 + 47 + 3)
May be implied by four correct products or 4750
FT their “midpoints” seen. M1 may be implied by Lower: 0 + 160 + 1480 + 2350 + 180 (4180) Upper: 100 + 320 + 1850 + 2820 + 240 (5330) Allow one error in calculation.
Expect 100
Mark scheme (b)
Answer
Marks
Part marks and guidance
Exact speeds for each vehicle are not recorded oe
1
Do not accept, “Because the mid-point is used” or comments on the method used. Accept e.g.: Specific speeds not given or We don’t know the speeds The exact speed isn’t given
15 Iqrah carries out a survey of 200 families in the north of England on their weekly spending on food. The cumulative frequency diagram summarises the results.
(a) Find
(i) the median, [1]
(ii) the interquartile range. [2]
(b) Iqrah says
15% of these families spent over £120.
Is her statement correct? State the evidence you have used in making your decision. [2]
(c) In a survey of 200 families in the south of England, the median weekly amount spent on food was £84 and the interquartile range was £28.
Make two comparisons between the weekly amounts spent on food in the north of England and the south of England. State the evidence you have used in making your comparisons.
1 [2] 2 [2]
Mark scheme (a)
Answer
Marks
Part marks and guidance
(i) 90
1
(ii) 22
2
M1 for [UQ = ]100 or [LQ = ] 77 to 79
Accept 21 to 23
Mark scheme (b)
Answer
Marks
Part marks and guidance
No with 18 to 20 and 30 OR No with 8% to 10% [and 15%] OR No with [£] 110 to112 [which is less than 120] OR No with 170 and 180 to 184
2
M1 for 18 to 20 or 8% to 10% or 110 to 112 or for 30 or 170 or 180 to 184
Could be written on graph for M1
Mark scheme (c)
Answer
Marks
Part marks and guidance
Families in the south spent less on average as their median was lower oe
2
Strict FT their median in (a)(i) M1 for Families in the South spent less oe nfww
Allow either way around but do not allow M1 if wrong reason given e.g. in first reason mentions IQR for spending less Ignore ref to figures
Families in the south were more spread in their spending as their IQR was larger oe
2
Strict FT their IQR in (a)(ii) M1 for Spending varies more in the South oe nfww
For M1 allow spread oe associated with IQR without comparison
Correct example supporting their reason with result \(\geqslant\) 630
2
M1 for correct calculation supporting their reason wrongly evaluated or correct value \(\geqslant\) 630 supporting their reason for their example without working or A correct calculation involving a mass and a number of people.
Eg 8 men weigh 672 kg
Multiplication or division Eg 84 \(\times\) 8 = 672 or 630 \(\div\) 84 = 7.5 or 630 \(\div\) 70 = 9