
Foundation November 2017 Paper 1 Q7
7 The diagram shows the scores given by judges during a television show.
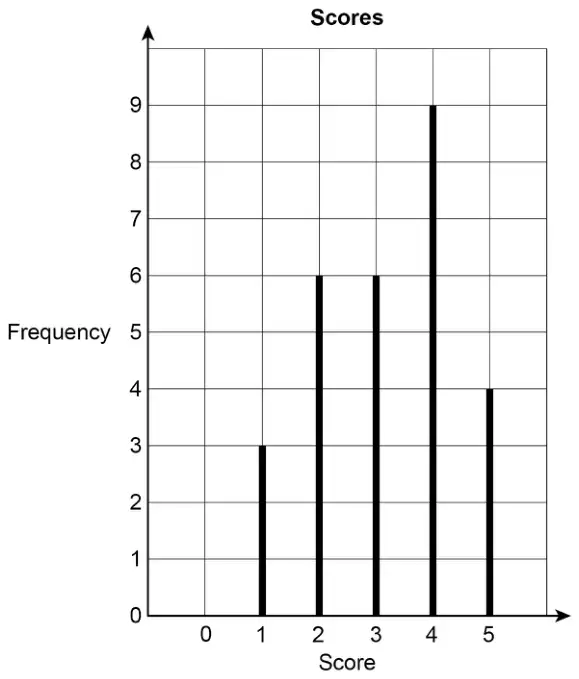
(a) Which score was the mode? [1 mark]
(b) There were 4 judges.
Each judge gave one score in each round.
How many rounds were there? [3 marks]
| Answer | Mark | Comments |
|---|---|---|
| 4 | B1 |
| Answer | Mark | Comments |
|---|---|---|
| \(3 + 6 + 6 + 9 + 4\) or 28 | M1 | at least four correct and intention to add |
| their \(28 \div 4\) | M1dep | oe |
| 7 | A1 |
Additional guidance
| Totals other than 28 must be evidenced for M1 or M2 | |
| \(3 + 6 + 6 + 9 + 4 = 29\), \(29 \div 4\), answer = 7 | M1M1A0 |