
1MA0 Foundation November 2016 Paper 2 Q6
6 The graph shows information about the test marks of Mr Gilbert’s science class.
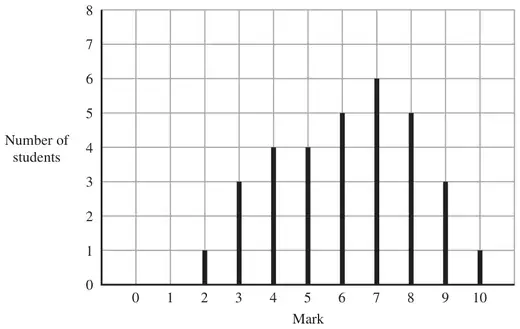
(a) Work out the number of students who did the test. (2)
(b) Write down the mode. (1)
(c) Work out the range of the test marks. (2)
| Answer | Mark | Notes |
|---|---|---|
| 32 | 2 | M1 for reading off frequencies (condone one error) A1 cao |
| Answer | Mark | Notes |
|---|---|---|
| 7 | 1 | B1 cao |
| Answer | Mark | Notes |
|---|---|---|
| 8 | 2 | M1 for \(10 - 2\) or \(2 - 10\) or \(-8\) A1 cao |