Time-Series Graphs

More questions on this topic: A2 Mechanics: Time-Series Graphs (17)

Your progress
0 of 49 done
Ticks are kept only in this browser: clearing your browsing data or changing device loses them. · ·

Edexcel

Edexcel · Old spec

AQA

OCR A

OCR MEI

WJEC

June 2025 Mechanics Q1

EdexcelCurrent spec4 marksSUVATTime-Series Graphs

1.

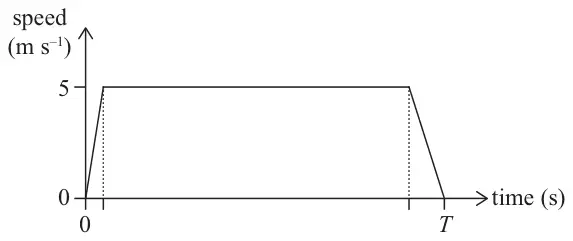
Figure 1: Speed-time graph: speed in m s⁻¹ against time in s. Speed rises in a straight line from 0 at time 0 to 5, stays constant at 5, then falls in a straight line to 0 at time T
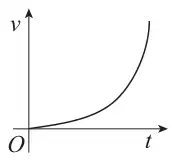
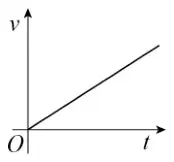
Figure 1

Figure 1 shows a sketch of the speed-time graph for a model of the motion of a runner travelling along a straight horizontal road from a point \(A\) to a point \(B\).

The distance from \(A\) to \(B\) is 400 metres.

In the model of the motion, the runner

  • starts from rest at \(A\) at time \(t = 0\)
  • then moves with constant acceleration for 5 seconds, reaching a maximum speed of \(5\ \mathrm{m\,s^{-1}}\)
  • then travels at a constant speed of \(5\ \mathrm{m\,s^{-1}}\)
  • then moves with constant deceleration for 15 seconds, until coming to rest at \(B\)
  • travels from \(A\) to \(B\) in \(T\) seconds
(a) Find the value of \(T\). (3)
(b) State one reason why the actual time taken to travel from \(A\) to \(B\) might not be \(T\) seconds. (1)

June 2024 Mechanics Q1

EdexcelCurrent spec6 marksSUVATTime-Series Graphs

1.

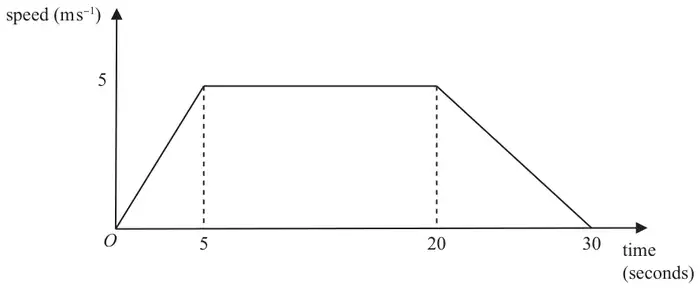
Figure 1: speed-time graph: speed rises uniformly from 0 at O to 5 m s⁻¹ at t = 5, stays at 5 until t = 20, then falls uniformly to 0 at t = 30
Figure 1

Figure 1 shows the speed-time graph for the journey of a car moving in a long queue of traffic on a straight horizontal road.

At time \(t = 0\), the car is at rest at the point \(A\).

The car then accelerates uniformly for 5 seconds until it reaches a speed of \(5\ \mathrm{m\,s^{-1}}\)

For the next 15 seconds the car travels at a constant speed of \(5\ \mathrm{m\,s^{-1}}\)

The car then decelerates uniformly until it comes to rest at the point \(B\).

The total journey time is 30 seconds.

(a) Find the distance \(AB\). (3)
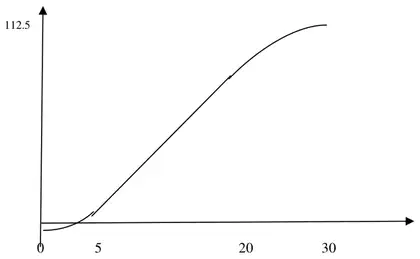
(b) Sketch a distance-time graph for the journey of the car from \(A\) to \(B\). (3)

June 2023 Mechanics Q1

EdexcelCurrent spec8 marksSUVATTime-Series Graphs

1.

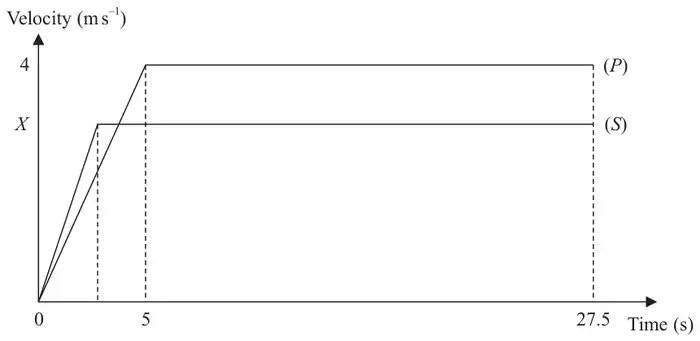
Figure 1: velocity-time graphs for P and S: P rises in a straight line from 0 at t = 0 to 4 at t = 5, then stays at 4 until t = 27.5; S rises in a straight line from 0 to X, reaching it before t = 5, then stays at X until t = 27.5
Figure 1

Two children, Pat (\(P\)) and Sam (\(S\)), run a race along a straight horizontal track.

Both children start from rest at the same time and cross the finish line at the same time.

In a model of the motion:

Pat accelerates at a constant rate from rest for 5 s until reaching a speed of \(4\ \mathrm{m\,s^{-1}}\) and then maintains a constant speed of \(4\ \mathrm{m\,s^{-1}}\) until crossing the finish line.

Sam accelerates at a constant rate of \(1\ \mathrm{m\,s^{-2}}\) from rest until reaching a speed of \(X\ \mathrm{m\,s^{-1}}\) and then maintains a constant speed of \(X\ \mathrm{m\,s^{-1}}\) until crossing the finish line.

Both children take 27.5 s to complete the race.

The velocity-time graphs shown in Figure 1 describe the model of the motion of each child from the instant they start to the instant they cross the finish line together.

Using the model,

(a) explain why the areas under the two graphs are equal, (1)
(b) find the acceleration of Pat during the first 5 seconds, (1)
(c) find, in metres, the length of the race, (2)
(d) find the value of \(X\), giving your answer to 3 significant figures. (4)

June 2022 Mechanics Q2

EdexcelCurrent spec8 marksSUVATTime-Series Graphs

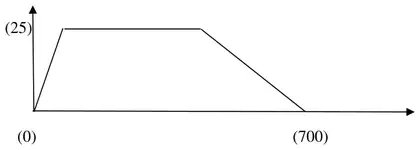
2. A train travels along a straight horizontal track from station \(P\) to station \(Q\).

In a model of the motion of the train, at time \(t = 0\) the train starts from rest at \(P\), and moves with constant acceleration until it reaches its maximum speed of 25 m s−1

The train then travels at this constant speed of 25 m s−1 before finally moving with constant deceleration until it comes to rest at \(Q\).

The time spent decelerating is four times the time spent accelerating.

The journey from \(P\) to \(Q\) takes 700 s.

Using the model,

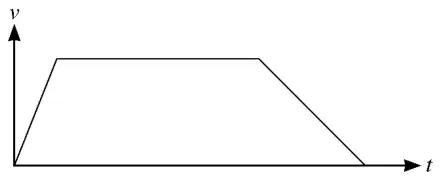
(a) sketch a speed-time graph for the motion of the train between the two stations \(P\) and \(Q\). (1)

The distance between the two stations is 15 km.

Using the model,

(b) show that the time spent accelerating by the train is 40 s, (3)
(c) find the acceleration, in m s−2, of the train, (1)
(d) find the speed of the train 572 s after leaving \(P\). (2)
(e) State one limitation of the model which could affect your answers to parts (b) and (c). (1)

June 2019 Mechanics Q1

EdexcelCurrent spec10 marksSUVATTime-Series Graphs

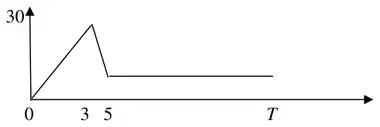
1. At time \(t = 0\), a parachutist falls vertically from rest from a helicopter which is hovering at a height of 550 m above horizontal ground.

The parachutist, who is modelled as a particle, falls for 3 seconds before her parachute opens.

While she is falling, and before her parachute opens, she is modelled as falling freely under gravity.

The acceleration due to gravity is modelled as being \(10\ \mathrm{m\,s^{-2}}\).

(a) Using this model, find the speed of the parachutist at the instant her parachute opens. (1)

When her parachute is open, the parachutist continues to fall vertically.

Immediately after her parachute opens, she decelerates at \(12\ \mathrm{m\,s^{-2}}\) for 2 seconds before reaching a constant speed and she reaches the ground with this speed.

The total time taken by the parachutist to fall the 550 m from the helicopter to the ground is \(T\) seconds.

(b) Sketch a speed-time graph for the motion of the parachutist for \(0 \leqslant t \leqslant T\). (2)
(c) Find, to the nearest whole number, the value of \(T\). (5)

In a refinement of the model of the motion of the parachutist, the effect of air resistance is included before her parachute opens and this refined model is now used to find a new value of \(T\).

(d) How would this new value of \(T\) compare with the value found, using the initial model, in part (c)? (1)
(e) Suggest one further refinement to the model, apart from air resistance, to make the model more realistic. (1)

June 2018 Mechanics Q7

EdexcelCurrent spec7 marksSUVATTime-Series Graphs

7. A train travels along a straight horizontal track between two stations, \(A\) and \(B\).

In a model of the motion, the train starts from rest at \(A\) and moves with constant acceleration 0.3 m s−2 for 80 s.
The train then moves at constant velocity before it moves with a constant deceleration of 0.5 m s−2, coming to rest at \(B\).

(a) For this model of the motion of the train between \(A\) and \(B\),
(i) state the value of the constant velocity of the train,
(ii) state the time for which the train is decelerating,
(iii) sketch a velocity-time graph. (3)

The total distance between the two stations is 4800 m.

(b) Using the model, find the total time taken by the train to travel from \(A\) to \(B\). (3)
(c) Suggest one improvement that could be made to the model of the motion of the train from \(A\) to \(B\) in order to make the model more realistic. (1)

M1 June 2018 Q4

EdexcelOld spec13 marksSUVATTime-Series Graphs

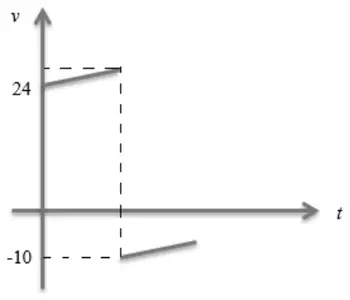
4. A ball of mass 0.2 kg is projected vertically downwards with speed \(U\) m s\(^{-1}\) from a point \(A\) which is 2.5 m above horizontal ground. The ball hits the ground. Immediately after hitting the ground, the ball rebounds vertically with a speed of 10 m s\(^{-1}\). The ball receives an impulse of magnitude 7 N s in its impact with the ground. By modelling the ball as a particle and ignoring air resistance, find

(a) the value of \(U\). (6)

After hitting the ground, the ball moves vertically upwards and passes through a point \(B\) which is 1 m above the ground.

(b) Find the time between the instant when the ball hits the ground and the instant when the ball first passes through \(B\). (4)
(c) Sketch a velocity-time graph for the motion of the ball from when it was projected from \(A\) to when it first passes through \(B\). (You need not make any further calculations to draw this sketch.) (3)

M1 June 2016 Q4

EdexcelOld spec12 marksSUVATTime-Series Graphs

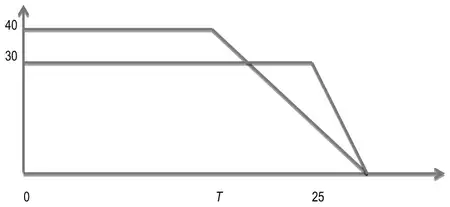
4. Two trains \(M\) and \(N\) are moving in the same direction along parallel straight horizontal tracks. At time \(t = 0\), \(M\) overtakes \(N\) whilst they are travelling with speeds 40 m s\(^{-1}\) and 30 m s\(^{-1}\) respectively. Train \(M\) overtakes train \(N\) as they pass a point \(X\) at the side of the tracks.

After overtaking \(N\), train \(M\) maintains its speed of 40 m s\(^{-1}\) for \(T\) seconds and then decelerates uniformly, coming to rest next to a point \(Y\) at the side of the tracks.

After being overtaken, train \(N\) maintains its speed of 30 m s\(^{-1}\) for 25 s and then decelerates uniformly, also coming to rest next to the point \(Y\).

The times taken by the trains to travel between \(X\) and \(Y\) are the same.

(a) Sketch, on the same diagram, the speed-time graphs for the motions of the two trains between \(X\) and \(Y\). (4)

Given that \(XY = 975\) m,

(b) find the value of \(T\). (8)

M1 June 2015 Q7

EdexcelOld spec13 marksSUVATTime-Series Graphs

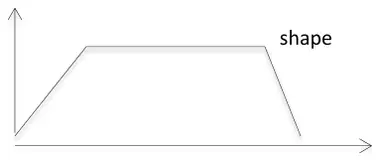
7. A train travels along a straight horizontal track between two stations, \(A\) and \(B\). The train starts from rest at \(A\) and moves with constant acceleration 0.5 m s\(^{-2}\) until it reaches a speed of \(V\) m s\(^{-1}\), \((V < 50)\). The train then travels at this constant speed before it moves with constant deceleration 0.25 m s\(^{-2}\) until it comes to rest at \(B\).

(a) Sketch in the space below a speed-time graph for the motion of the train between the two stations \(A\) and \(B\). (2)

The total time for the journey from \(A\) to \(B\) is 5 minutes.

(b) Find, in terms of \(V\), the length of time, in seconds, for which the train is
(i) accelerating,
(ii) decelerating,
(iii) moving with constant speed. (5)

Given that the distance between the two stations \(A\) and \(B\) is 6.3 km,

(c) find the value of \(V\). (6)

M1 June 2014 (R) Q3

EdexcelOld spec13 marksSUVATTime-Series Graphs

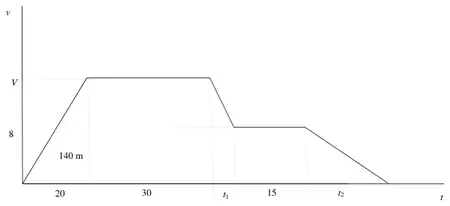
3. A car starts from rest and moves with constant acceleration along a straight horizontal road. The car reaches a speed of \(V\) m s\(^{-1}\) in 20 seconds. It moves at constant speed \(V\) m s\(^{-1}\) for the next 30 seconds, then moves with constant deceleration \(\dfrac{1}{2}\) m s\(^{-2}\) until it has speed 8 m s\(^{-1}\). It moves at speed 8 m s\(^{-1}\) for the next 15 seconds and then moves with constant deceleration \(\dfrac{1}{3}\) m s\(^{-2}\) until it comes to rest.

(a) Sketch, in the space below, a speed-time graph for this journey. (3)

In the first 20 seconds of this journey the car travels 140 m.

Find

(b) the value of \(V\), (2)
(c) the total time for this journey, (4)
(d) the total distance travelled by the car. (4)

M1 June 2014 Q3

EdexcelOld spec13 marksSUVATTime-Series Graphs

3. A ball of mass 0.3 kg is released from rest at a point which is 2 m above horizontal ground. The ball moves freely under gravity. After striking the ground, the ball rebounds vertically and rises to a maximum height of 1.5 m above the ground, before falling to the ground again. The ball is modelled as a particle.

(a) Find the speed of the ball at the instant before it strikes the ground for the first time. (2)
(b) Find the speed of the ball at the instant after it rebounds from the ground for the first time. (2)
(c) Find the magnitude of the impulse on the ball in the first impact with the ground. (2)
(d) Sketch, in the space provided, a velocity-time graph for the motion of the ball from the instant when it is released until the instant when it strikes the ground for the second time. (3)
(e) Find the time between the instant when the ball is released and the instant when it strikes the ground for the second time. (4)

M1 June 2013 Q5

EdexcelOld spec11 marksSUVATTime-Series Graphs

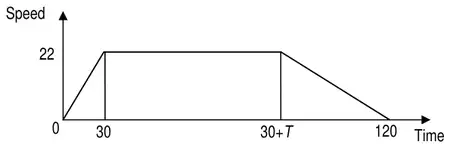
5. A car is travelling along a straight horizontal road. The car takes 120 s to travel between two sets of traffic lights which are 2145 m apart. The car starts from rest at the first set of traffic lights and moves with constant acceleration for 30 s until its speed is 22 m s\(^{-1}\). The car maintains this speed for \(T\) seconds. The car then moves with constant deceleration, coming to rest at the second set of traffic lights.

(a) Sketch, in the space below, a speed-time graph for the motion of the car between the two sets of traffic lights. (2)
(b) Find the value of \(T\). (3)

A motorcycle leaves the first set of traffic lights 10 s after the car has left the first set of traffic lights. The motorcycle moves from rest with constant acceleration, \(a\) m s\(^{-2}\), and passes the car at the point \(A\) which is 990 m from the first set of traffic lights. When the motorcycle passes the car, the car is moving with speed 22 m s\(^{-1}\).

(c) Find the time it takes for the motorcycle to move from the first set of traffic lights to the point \(A\). (4)
(d) Find the value of \(a\). (2)

M1 January 2013 Q5

EdexcelOld spec15 marksSUVATTime-Series Graphs

5.

Figure 4: velocity-time graph rising from O to 30, constant at 30 for T seconds, then falling to zero
Figure 4

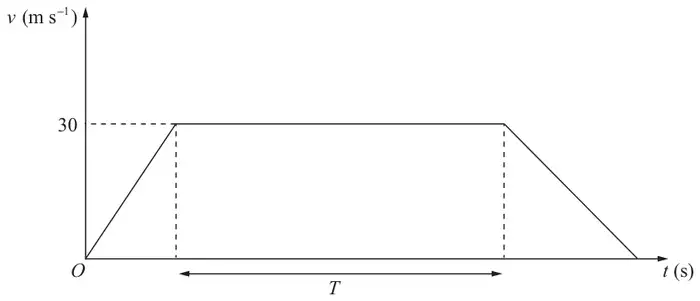
The velocity-time graph in Figure 4 represents the journey of a train \(P\) travelling along a straight horizontal track between two stations which are 1.5 km apart. The train \(P\) leaves the first station, accelerating uniformly from rest for 300 m until it reaches a speed of 30 m s\(^{-1}\). The train then maintains this speed for \(T\) seconds before decelerating uniformly at 1.25 m s\(^{-2}\), coming to rest at the next station.

(a) Find the acceleration of \(P\) during the first 300 m of its journey. (2)
(b) Find the value of \(T\). (5)

A second train \(Q\) completes the same journey in the same total time. The train leaves the first station, accelerating uniformly from rest until it reaches a speed of \(V\) m s\(^{-1}\) and then immediately decelerates uniformly until it comes to rest at the next station.

(c) Sketch on the diagram above, a velocity-time graph which represents the journey of train \(Q\). (2)
(d) Find the value of \(V\). (6)

M1 June 2012 Q4

EdexcelOld spec13 marksSUVATTime-Series Graphs

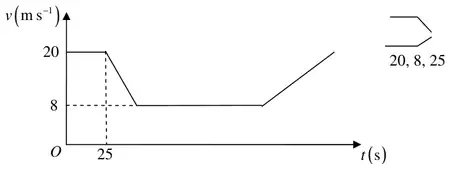
4. A car is moving on a straight horizontal road. At time \(t = 0\), the car is moving with speed 20 m s\(^{-1}\) and is at the point \(A\). The car maintains the speed of 20 m s\(^{-1}\) for 25 s. The car then moves with constant deceleration 0.4 m s\(^{-2}\), reducing its speed from 20 m s\(^{-1}\) to 8 m s\(^{-1}\). The car then moves with constant speed 8 m s\(^{-1}\) for 60 s. The car then moves with constant acceleration until it is moving with speed 20 m s\(^{-1}\) at the point \(B\).

(a) Sketch a speed-time graph to represent the motion of the car from \(A\) to \(B\). (3)
(b) Find the time for which the car is decelerating. (2)

Given that the distance from \(A\) to \(B\) is 1960 m,

(c) find the time taken for the car to move from \(A\) to \(B\). (8)

M1 January 2012 Q6

EdexcelOld spec13 marksSUVATTime-Series Graphs

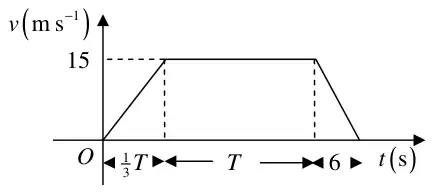
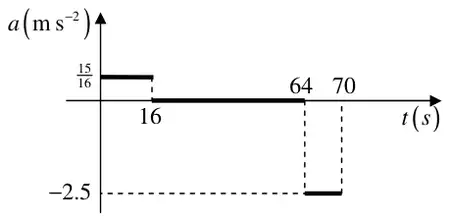
6. A car moves along a straight horizontal road from a point \(A\) to a point \(B\), where \(AB = 885\) m. The car accelerates from rest at \(A\) to a speed of 15 m s\(^{-1}\) at a constant rate \(a\) m s\(^{-2}\). The time for which the car accelerates is \(\tfrac{1}{3}T\) seconds. The car maintains the speed of 15 m s\(^{-1}\) for \(T\) seconds. The car then decelerates at a constant rate of 2.5 m s\(^{-2}\) stopping at \(B\).

(a) Find the time for which the car decelerates. (2)
(b) Sketch a speed-time graph for the motion of the car. (2)
(c) Find the value of \(T\). (4)
(d) Find the value of \(a\). (2)
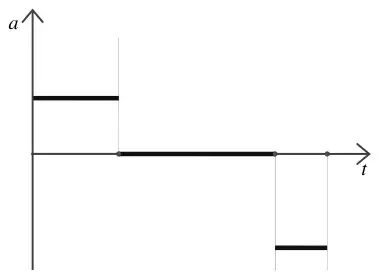
(e) Sketch an acceleration-time graph for the motion of the car. (3)

M1 June 2011 Q4

EdexcelOld spec12 marksSUVATTime-Series Graphs

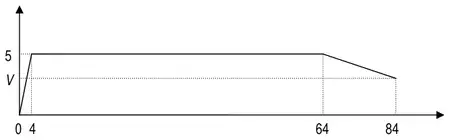
4. A girl runs a 400 m race in a time of 84 s. In a model of this race, it is assumed that, starting from rest, she moves with constant acceleration for 4 s, reaching a speed of 5 m s\(^{-1}\). She maintains this speed for 60 s and then moves with constant deceleration for 20 s, crossing the finishing line with a speed of \(V\) m s\(^{-1}\).

(a) Sketch, in the space below, a speed-time graph for the motion of the girl during the whole race. (2)
(b) Find the distance run by the girl in the first 64 s of the race. (3)
(c) Find the value of \(V\). (5)
(d) Find the deceleration of the girl in the final 20 s of her race. (2)

M1 January 2011 Q5

EdexcelOld spec10 marksTime-Series Graphs

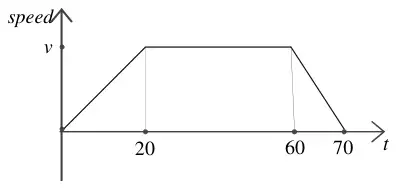
5. A car accelerates uniformly from rest for 20 seconds. It moves at constant speed \(v\) m s\(^{-1}\) for the next 40 seconds and then decelerates uniformly for 10 seconds until it comes to rest.

(a) For the motion of the car, sketch
(i) a speed-time graph,
(ii) an acceleration-time graph.
(6)

Given that the total distance moved by the car is 880 m,

(b) find the value of \(v\). (4)

M1 June 2010 Q5

EdexcelOld spec12 marksSUVATTime-Series Graphs

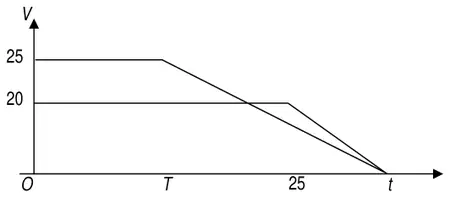
5. Two cars \(P\) and \(Q\) are moving in the same direction along the same straight horizontal road. Car \(P\) is moving with constant speed 25 m s\(^{-1}\). At time \(t = 0\), \(P\) overtakes \(Q\) which is moving with constant speed 20 m s\(^{-1}\). From \(t = T\) seconds, \(P\) decelerates uniformly, coming to rest at a point \(X\) which is 800 m from the point where \(P\) overtook \(Q\). From \(t = 25\) s, \(Q\) decelerates uniformly, coming to rest at the same point \(X\) at the same instant as \(P\).

(a) Sketch, on the same axes, the speed-time graphs of the two cars for the period from \(t = 0\) to the time when they both come to rest at the point \(X\). (4)
(b) Find the value of \(T\). (8)

M1 January 2010 Q2

EdexcelOld spec8 marksSUVATTime-Series Graphs

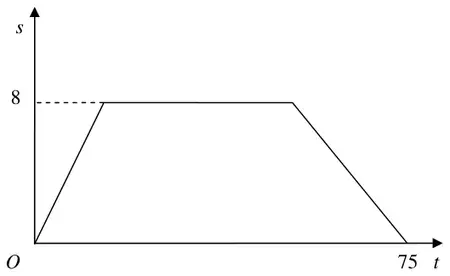
2. An athlete runs along a straight road. She starts from rest and moves with constant acceleration for 5 seconds, reaching a speed of 8 m s\(^{-1}\). This speed is then maintained for \(T\) seconds. She then decelerates at a constant rate until she stops. She has run a total of 500 m in 75 s.

(a) In the space below, sketch a speed-time graph to illustrate the motion of the athlete. (3)
(b) Calculate the value of \(T\). (5)

M1 January 2009 Q2

EdexcelOld spec5 marksSUVATTime-Series Graphs

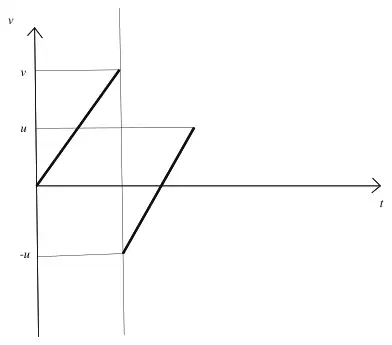
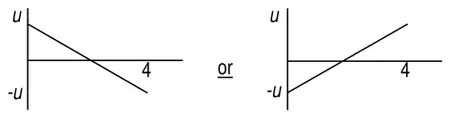
2. A small ball is projected vertically upwards from ground level with speed \(u\) m s\(^{-1}\). The ball takes 4 s to return to ground level.

(a) Draw, in the space below, a velocity-time graph to represent the motion of the ball during the first 4 s. (2)
(b) The maximum height of the ball above the ground during the first 4 s is 19.6 m. Find the value of \(u\). (3)

M1 June 2008 Q4

EdexcelOld spec9 marksSUVATTime-Series Graphs

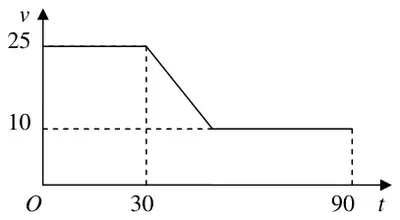
4. A car is moving along a straight horizontal road. The speed of the car as it passes the point \(A\) is 25 m s\(^{-1}\) and the car maintains this speed for 30 s. The car then decelerates uniformly to a speed of 10 m s\(^{-1}\). The speed of 10 m s\(^{-1}\) is then maintained until the car passes the point \(B\). The time taken to travel from \(A\) to \(B\) is 90 s and \(AB = 1410\) m.

(a) Sketch, in the space below, a speed-time graph to show the motion of the car from \(A\) to \(B\). (2)
(b) Calculate the deceleration of the car as it decelerates from 25 m s\(^{-1}\) to 10 m s\(^{-1}\). (7)

M1 January 2008 Q3

EdexcelOld spec11 marksSUVATTime-Series Graphs

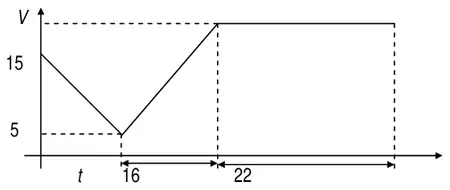
3. A car moves along a horizontal straight road, passing two points \(A\) and \(B\). At \(A\) the speed of the car is 15 m s\(^{-1}\). When the driver passes \(A\), he sees a warning sign \(W\) ahead of him, 120 m away. He immediately applies the brakes and the car decelerates with uniform deceleration, reaching \(W\) with speed 5 m s\(^{-1}\). At \(W\), the driver sees that the road is clear. He then immediately accelerates the car with uniform acceleration for 16 s to reach a speed of \(V\) m s\(^{-1}\) \((V \gt 15)\). He then maintains the car at a constant speed of \(V\) m s\(^{-1}\). Moving at this constant speed, the car passes \(B\) after a further 22 s.

(a) Sketch, in the space below, a speed-time graph to illustrate the motion of the car as it moves from \(A\) to \(B\). (3)
(b) Find the time taken for the car to move from \(A\) to \(B\). (3)

The distance from \(A\) to \(B\) is 1 km.

(c) Find the value of \(V\). (5)

M1 June 2007 Q4

EdexcelOld spec11 marksSUVATTime-Series Graphs

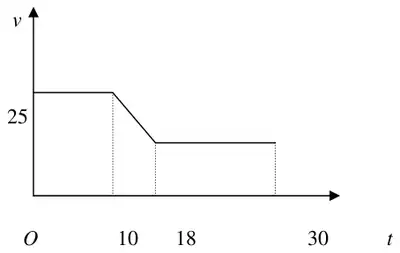
4. A car is moving along a straight horizontal road. At time \(t = 0\), the car passes a point \(A\) with speed 25 m s\(^{-1}\). The car moves with constant speed 25 m s\(^{-1}\) until \(t = 10\) s. The car then decelerates uniformly for 8 s. At time \(t = 18\) s, the speed of the car is \(V\) m s\(^{-1}\) and this speed is maintained until the car reaches the point \(B\) at time \(t = 30\) s.

(a) Sketch, in the space provided, a speed–time graph to show the motion of the car from \(A\) to \(B\). (3)

Given that \(AB = 526\) m, find

(b) the value of \(V\), (5)
(c) the deceleration of the car between \(t = 10\) s and \(t = 18\) s. (3)

M1 June 2006 Q1

EdexcelOld spec6 marksTime-Series Graphs

1.

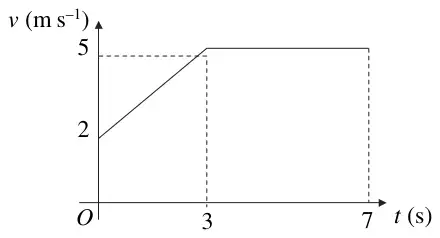
Figure 1: speed-time graph rising in a straight line from 2 at t = 0 to 5 at t = 3, then constant at 5 until t = 7
Figure 1

Figure 1 shows the speed-time graph of a cyclist moving on a straight road over a 7 s period. The sections of the graph from \(t = 0\) to \(t = 3\), and from \(t = 3\) to \(t = 7\), are straight lines. The section from \(t = 3\) to \(t = 7\) is parallel to the \(t\)-axis.

State what can be deduced about the motion of the cyclist from the fact that

(a) the graph from \(t = 0\) to \(t = 3\) is a straight line, (1)
(b) the graph from \(t = 3\) to \(t = 7\) is parallel to the \(t\)-axis. (1)
(c) Find the distance travelled by the cyclist during this 7 s period. (4)

M1 June 2005 Q5

EdexcelOld spec10 marksSUVATTime-Series Graphs

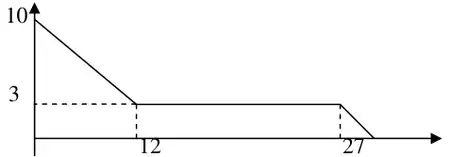
5. A train is travelling at 10 m s\(^{-1}\) on a straight horizontal track. The driver sees a red signal 135 m ahead and immediately applies the brakes. The train immediately decelerates with constant deceleration for 12 s, reducing its speed to 3 m s\(^{-1}\). The driver then releases the brakes and allows the train to travel at a constant speed of 3 m s\(^{-1}\) for a further 15 s. He then applies the brakes again and the train slows down with constant deceleration, coming to rest as it reaches the signal.

(a) Sketch a speed-time graph to show the motion of the train, (3)
(b) Find the distance travelled by the train from the moment when the brakes are first applied to the moment when its speed first reaches 3 m s\(^{-1}\). (2)
(c) Find the total time from the moment when the brakes are first applied to the moment when the train comes to rest. (5)

M1 January 2005 Q3

EdexcelOld spec9 marksTime-Series Graphs

3.

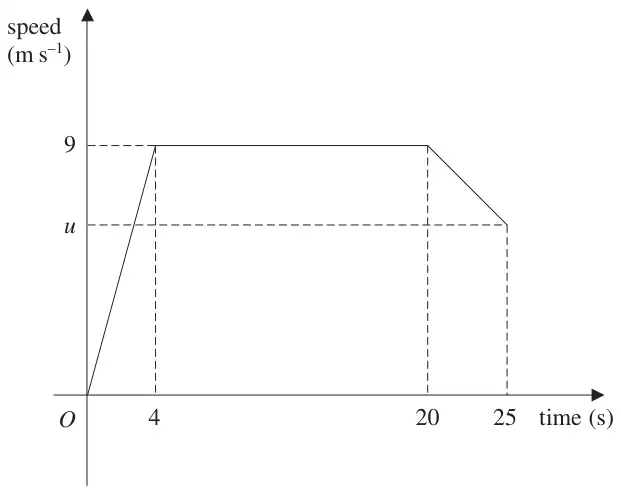
Figure 2: speed-time graph rising from O to 9 at t = 4, constant to t = 20, then falling to u at t = 25
Figure 2

A sprinter runs a race of 200 m. Her total time for running the race is 25 s. Figure 2 is a sketch of the speed-time graph for the motion of the sprinter. She starts from rest and accelerates uniformly to a speed of 9 m s\(^{-1}\) in 4 s. The speed of 9 m s\(^{-1}\) is maintained for 16 s and she then decelerates uniformly to a speed of \(u\) m s\(^{-1}\) at the end of the race. Calculate

(a) the distance covered by the sprinter in the first 20 s of the race, (2)
(b) the value of \(u\), (4)
(c) the deceleration of the sprinter in the last 5 s of the race. (3)

June 2025 Paper 1 Q16

AQACurrent spec2 marksTime-Series Graphs

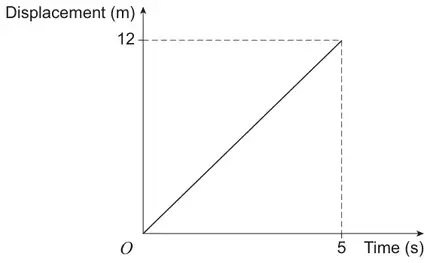
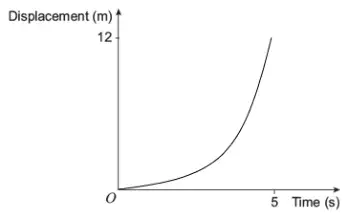
16 The displacement–time graph, Figure 1, shows the first 5 seconds of the motion of a car which starts from rest and travels 12 metres.

Figure 1: displacement (m) against time (s), a straight line from O to the point (5, 12), with dashed lines from 12 on the displacement axis and from 5 on the time axis
Figure 1
(a) Find the speed of the car. [1 mark]
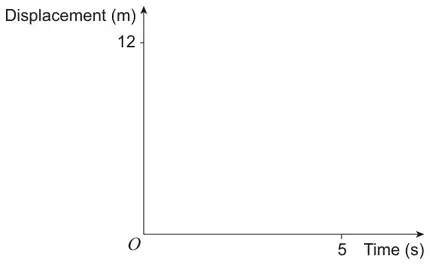
(b) On Figure 2, draw a more realistic displacement–time graph to show the first 5 seconds of motion of the car. [1 mark]
Figure 2: blank axes of displacement (m) against time (s), with 12 marked on the displacement axis and 5 marked on the time axis
Figure 2

June 2024 Paper 1 Q15

AQACurrent spec4 marksTime-Series Graphs

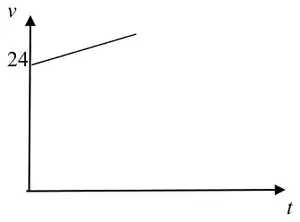
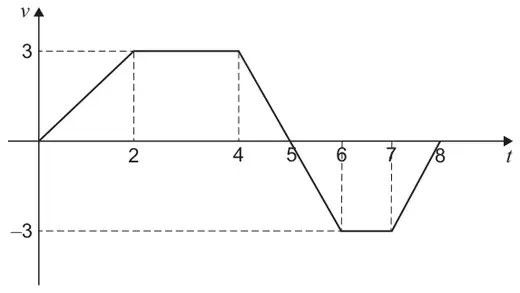
15 A graph indicating how the velocity, \(v\) m s−1, of a particle changes with respect to time, \(t\) seconds, is shown below.

Velocity–time graph: v rises from 0 to 3 at t = 2, stays at 3 until t = 4, falls through 0 at t = 5 to −3 at t = 6, stays at −3 until t = 7, then rises to 0 at t = 8
(a) Find the total distance travelled by the particle over the 8 second period shown. [3 marks]
(b) A student claims that

“The displacement of the particle is less than the distance travelled.”

State the range of values of \(t\) for which this claim is true. [1 mark]

June 2023 Paper 1 Q15

AQACurrent spec4 marksTime-Series Graphs

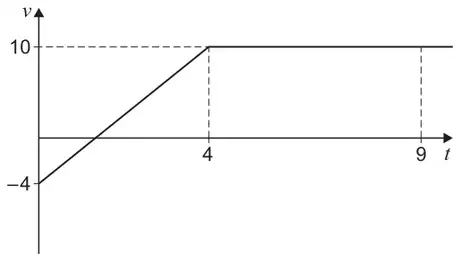
15 A particle is moving in a straight line such that its velocity, \(v\) m s−1, changes with respect to time, \(t\) seconds, as shown in the graph below.

Velocity–time graph: v increases linearly from −4 at t = 0 to 10 at t = 4, then stays at 10 up to and beyond t = 9
(a) Show that the acceleration of the particle over the first 4 seconds is 3.5 m s−2 [1 mark]
(b) The particle is initially at a fixed point \(P\)

Show that the displacement of the particle from \(P\), when \(t = 9\), is 62 metres. [3 marks]

June 2022 Paper 1 Q11

AQACurrent spec1 markTime-Series Graphs

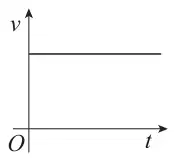
11 A car, initially at rest, moves with constant acceleration along a straight horizontal road.

One of the graphs below shows how the car’s velocity, \(v\) m s−1, changes over time, \(t\) seconds.

Identify the correct graph.

Tick (✓) one box. [1 mark]

  • Velocity–time graph: horizontal line at a positive value of v
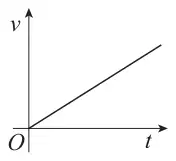
  • Velocity–time graph: straight line with positive gradient starting at the origin
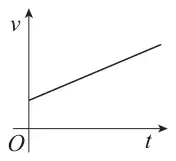
  • Velocity–time graph: straight line with positive gradient starting at a positive value of v
  • Velocity–time graph: curve starting at the origin and increasing ever more steeply

June 2021 Paper 1 Q13

AQACurrent spec5 marksTime-Series Graphs

13 A car, initially at rest, is driven along a straight horizontal road.

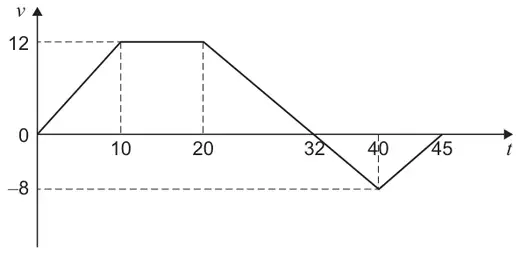
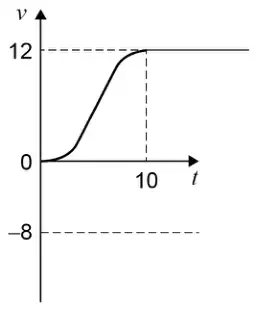
The graph below is a simple model of how the car’s velocity, \(v\) metres per second, changes with respect to time, \(t\) seconds.

Velocity-time graph: v rises linearly from 0 at t = 0 to 12 at t = 10, stays at 12 until t = 20, decreases linearly through 0 at t = 32 to −8 at t = 40, then rises linearly to 0 at t = 45
(a) Find the displacement of the car when \(t = 45\) [3 marks]
(b) Shona says:

“This model is too simple. It is unrealistic to assume that the car will instantaneously change its acceleration.”

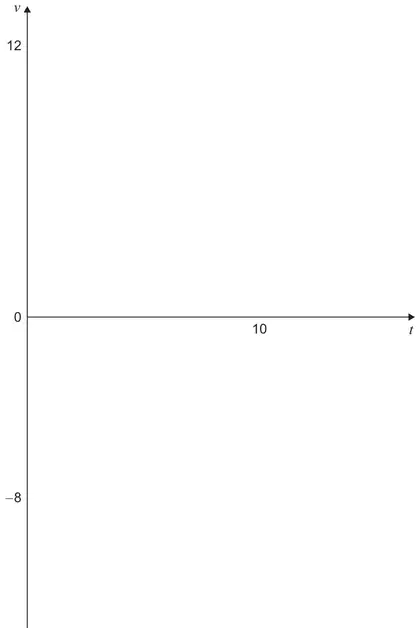
On the axes below sketch a graph, for the first 10 seconds of the journey, which would represent a more realistic model. [2 marks]

Blank axes: v-axis marked 12, 0 and −8; t-axis marked 10

June 2020 Paper 1 Q13

AQACurrent spec3 marksSUVATTime-Series Graphs

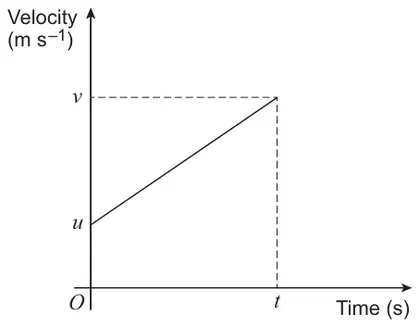
13 An object is moving in a straight line, with constant acceleration \(a\) m s−2, over a time period of \(t\) seconds.

It has an initial velocity \(u\) and final velocity \(v\) as shown in the graph below.

Velocity-time graph: a straight line rising from velocity u at time 0 to velocity v at time t, with dashed lines from the end point to v on the velocity axis and to t on the time axis

Use the graph to show that

\[v = u + at\]

[3 marks]

June 2018 Paper 1 Q13

AQACurrent spec6 marksSUVATTime-Series Graphs

13 A vehicle, which begins at rest at point \(P\), is travelling in a straight line.

For the first 4 seconds the vehicle moves with a constant acceleration of 0.75 m s−2

For the next 5 seconds the vehicle moves with a constant acceleration of \(-1.2\) m s−2

The vehicle then immediately stops accelerating, and travels a further 33 m at constant speed.

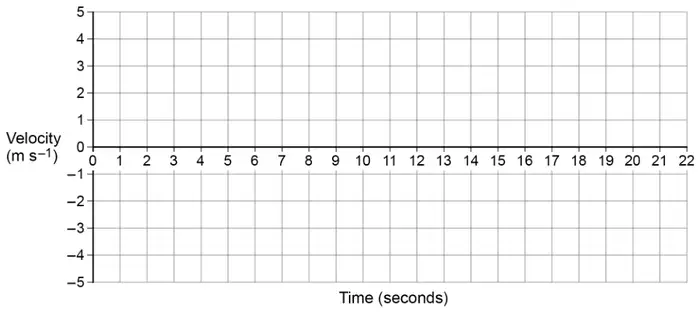
(a) Draw a velocity–time graph for this journey on the grid below. [3 marks]
Blank grid: velocity (m s⁻¹) on the vertical axis from −5 to 5, time (seconds) on the horizontal axis from 0 to 22
(b) Find the distance of the car from \(P\) after 20 seconds. [3 marks]

June 2025 Paper 2 Q10

OCR ACurrent spec6 marksSUVATTime-Series Graphs

10

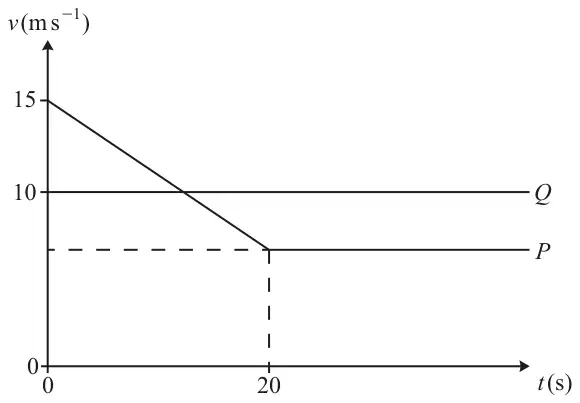
Velocity-time graph: Q is a horizontal line at v = 10; P starts at v = 15 when t = 0 and decreases linearly to t = 20, then stays constant

The velocity-time graph represents the motion of two cyclists \(P\) and \(Q\) who are travelling along a straight, horizontal road. At time \(t = 0\), the cyclists pass the same point on the road with \(P\) cycling at \(15\,\mathrm{m\,s^{-1}}\) and \(Q\) cycling at \(10\,\mathrm{m\,s^{-1}}\).

From time \(t = 0\), \(P\) cycles with constant deceleration \(0.4\,\mathrm{m\,s^{-2}}\) for 20 seconds and \(Q\) cycles at a constant velocity of \(10\,\mathrm{m\,s^{-1}}\). From \(t = 20\) onwards, \(P\)’s velocity remains constant.

(a) Find the value of \(t\) when \(P\) and \(Q\) have the same velocity. [2]
(b) Determine the value of \(t\) when \(Q\) overtakes \(P\). [4]

June 2023 Paper 2 Q9

OCR ACurrent spec4 marksSUVATTime-Series Graphs

9 A cyclist travels along a straight horizontal road between house \(A\) and house \(B\).

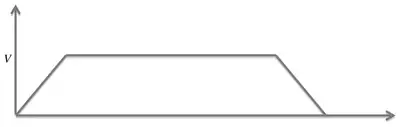
The cyclist starts from rest at \(A\) and moves with constant acceleration for 20 seconds, reaching a velocity of \(15\,\mathrm{m\,s^{-1}}\). The cyclist then moves at this constant velocity before decelerating at \(0.3\,\mathrm{m\,s^{-2}}\), coming to rest at \(B\).

(a) Find the time, in seconds, for which the cyclist is decelerating. [1]
(b) Sketch a velocity-time graph for the motion of the cyclist between \(A\) and \(B\). [Your sketch need not be drawn to scale; numerical values need not be shown.] [1]

The total distance between \(A\) and \(B\) is \(1950\,\mathrm{m}\).

(c) Find the time, in seconds, for which the cyclist is moving at constant velocity. [2]

October 2021 Paper 2 Q10

OCR ACurrent spec8 marksSUVATTime-Series Graphs

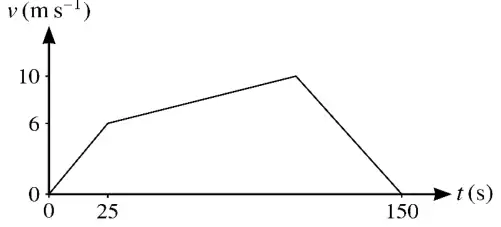
10 A cyclist starts from rest and moves with constant acceleration along a straight horizontal road. The cyclist reaches a speed of \(6\,\mathrm{m\,s^{-1}}\) in 25 seconds. The cyclist then moves with constant acceleration \(0.05\,\mathrm{m\,s^{-2}}\) until the speed is \(10\,\mathrm{m\,s^{-1}}\). The cyclist then moves with constant deceleration until coming to rest. The total time for the cyclist’s journey is 150 seconds.

(a) Sketch a velocity-time graph to represent the cyclist’s motion. [2]
(b) Find the acceleration during the first 25 seconds of the cyclist’s motion. [1]

The cyclist takes \(T\) seconds to decelerate from \(10\,\mathrm{m\,s^{-1}}\) until coming to rest.

(c) Determine the value of \(T\). [2]
(d) Determine the average speed for the cyclist’s journey. [3]

June 2019 Paper 2 Q10

10

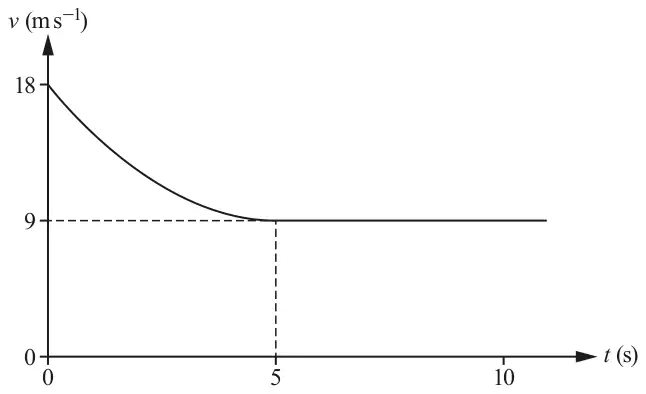
Velocity-time graph: v in m/s against t in s; the curve starts at v = 18 when t = 0 and decreases to v = 9 at t = 5, where it levels off, then a horizontal line at v = 9 beyond t = 10

The diagram shows the velocity-time graph modelling the velocity of a car as it approaches, and drives through, a residential area.

The velocity of the car, \(v\,\text{m}\,\text{s}^{-1}\), at time \(t\) seconds for the time interval \(0 \leqslant t \leqslant 5\) is modelled by the equation \(v = pt^2 + qt + r\), where \(p\), \(q\) and \(r\) are constants.

It is given that the acceleration of the car is zero at \(t = 5\) and the speed of the car then remains constant.

(a) Determine the values of \(p\), \(q\) and \(r\). [5]
(b) Calculate the distance travelled by the car from \(t = 2\) to \(t = 10\). [3]

June 2025 Paper 1 Q13

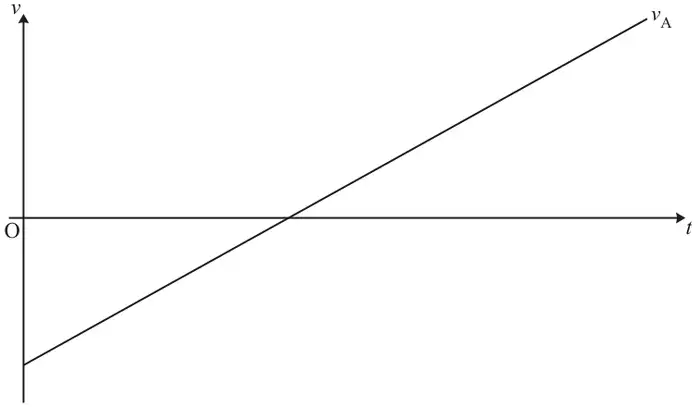
13 Particles A and B are moving along the same straight line. The graph below is the velocity–time graph for particle A with velocity \(v_{\text{A}}\ \text{m s}^{-1}\) at time \(t\) s. Particle A travels with constant acceleration. It has an initial velocity of \(-3\ \text{m s}^{-1}\) and is instantaneously at rest when \(t = 4\).

Velocity–time graph for particle A: a straight line labelled v_A starting below the origin on the v-axis, crossing the t-axis and continuing upwards to the right

The velocity for particle B at time \(t\) s is given by \(v_{\text{B}} = 1.5 + 0.03t^2\ \text{m s}^{-1}\). The particles are first travelling at the same velocity at time \(t = T\) s. You are given that A and B do not collide.

(a) Show that \(T = 10\). [3]
(b) Hence, or otherwise, determine which particle has travelled the greater distance by time \(T\) s and by how much. [6]

June 2024 Paper 1 Q9

OCR MEICurrent spec7 marksSUVATTime-Series Graphs

9 Two trains are travelling in the same direction on parallel straight tracks and train A overtakes train B. At time \(t\) seconds after the front of train A overtakes the front of train B the velocities of trains A and B are \(v_\text{A}\) \(\text{m s}^{-1}\) and \(v_\text{B}\) \(\text{m s}^{-1}\) respectively.

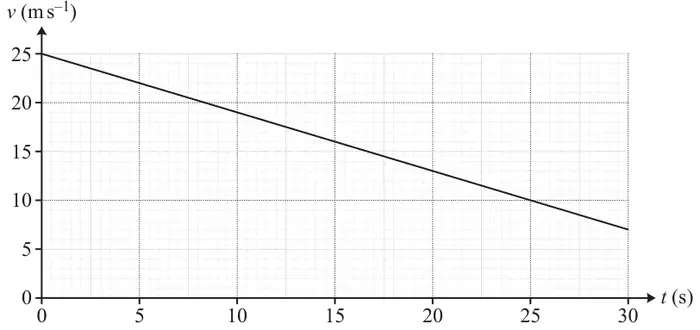
The velocity of train A is modelled by \(v_\text{A} = 25 - 0.6t\). The velocity-time graph of train A is shown below.

Velocity-time graph on a grid: v (m s⁻¹) from 0 to 25 against t (s) from 0 to 30; a straight line falls from 25 at t = 0 to 7 at t = 30
(a) A student argues that the speed of train A changes by \(18\ \text{m s}^{-1}\) in 30 seconds so its acceleration is \(0.6\ \text{m s}^{-2}\).
Comment on the validity of the student’s argument. [1]
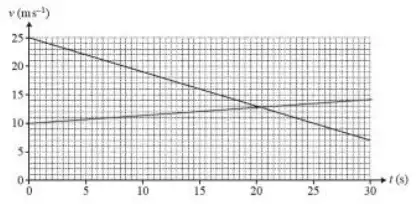
(b) When the front of train A overtakes the front of train B, train B has a velocity of \(10\ \text{m s}^{-1}\). The acceleration of train B is constant and is modelled as \(0.15\ \text{m s}^{-2}\).
Write down the equation for \(v_\text{B}\) in terms of \(t\) that models the velocity of train B. [1]
(c) Draw the velocity-time graph of train B on the copy of the diagram in the Printed Answer Booklet. [1]
(d) Determine the distance between the fronts of the trains at the time when the trains are travelling at the same velocity. [3]
(e) Explain why the model for train A would not be valid for large values of \(t\). [1]

June 2023 Paper 1 Q5

OCR MEICurrent spec5 marksTime-Series Graphs

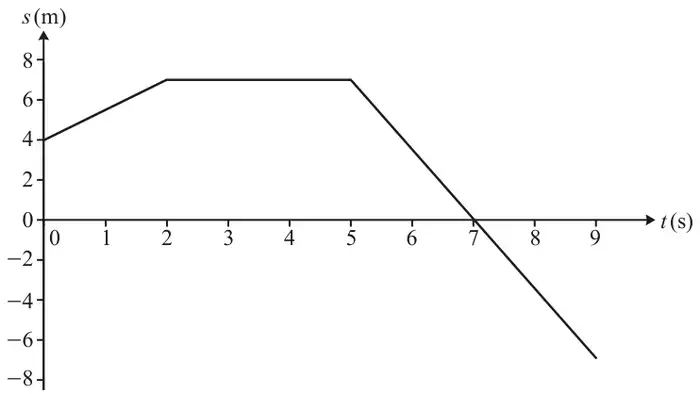
5 The graph shows displacement \(s\) m against time \(t\) s for a model of the motion of a bead moving along a straight wire. The points (0, 4), (2, 7), (5, 7) and (9, −7) are the endpoints of the line segments.

Displacement-time graph: s (m) from −8 to 8 against t (s) from 0 to 9; straight line segments from (0, 4) to (2, 7), horizontal from (2, 7) to (5, 7), then from (5, 7) down through (7, 0) to (9, −7)
(a) Find an expression for the displacement of the bead for \(0 \leqslant t \leqslant 2\). [2]
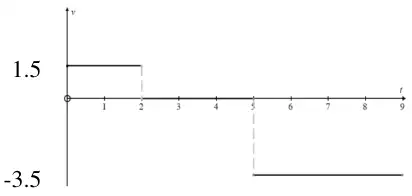
(b) Sketch the velocity-time graph for this model. [2]
(c) Explain why the model may not be suitable at \(t = 2\) and \(t = 5\). [1]

June 2022 Paper 1 Q3

OCR MEICurrent spec3 marksTime-Series Graphs

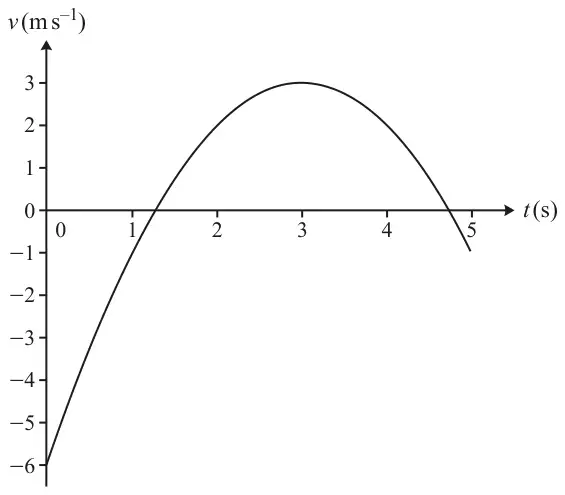
3 The velocity-time graph for the motion of a particle is shown below. The velocity \(v\) \(\text{m s}^{-1}\) at time \(t\) s is given by \(v = -t^2 + 6t - 6\) where \(0 \leqslant t \leqslant 5\).

Velocity-time graph: v (m s^-1) from −6 to 3 against t (s) from 0 to 5; an n-shaped curve starting at (0, −6), crossing the t-axis between 1 and 2, reaching a maximum of 3 at t = 3, and crossing the t-axis again between 4 and 5, ending below the axis at t = 5
(a) Find the times at which the velocity is 2 \(\text{m s}^{-1}\). [2]
(b) Write down the greatest speed of the particle. [1]

October 2021 Paper 1 Q6

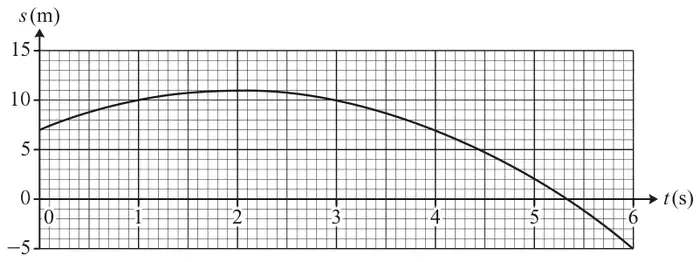
6 The displacement of a particle is modelled by the equation \(s = 7 + 4t - t^2\), where \(s\) metres is the displacement from the origin at time \(t\) seconds. The diagram shows part of the displacement-time graph for the particle. The point (2, 11) is the maximum point on the graph.

Displacement-time graph on a grid: s (m) from −5 to 15 against t (s) from 0 to 6; the curve starts at (0, 7), rises to a maximum at (2, 11), then falls, crossing the t-axis between 5 and 6 and reaching −5 at t = 6
(a) Kai argues that the point (2, 11) is on the graph, so the particle has travelled a distance of 11 metres in the first 2 seconds.

Comment on the validity of Kai’s argument. [1]
(b) Determine the total distance the particle travels in the first 10 seconds. [3]
(c) Find an expression for the velocity of the particle at time \(t\). [2]
(d) Find the speed of the particle when \(t = 10\). [2]

October 2020 Paper 1 Q9

OCR MEICurrent spec6 marksSUVATTime-Series Graphs

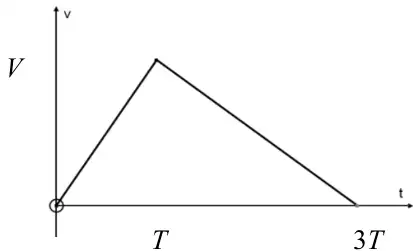
9 A car travelling in a straight line accelerates uniformly from rest to \(V\) \(\text{m s}^{-1}\) in \(T\) s. It then slows down uniformly, coming to rest after a further \(2T\) s.

(a) Sketch a velocity-time graph for the car. [2]

The acceleration in the first stage of the motion is 2.5 \(\text{m s}^{-2}\) and the total distance travelled is 240 m.

(b) Calculate the values of \(V\) and \(T\). [4]

June 2018 Paper 1 Q10

OCR MEICurrent spec9 marksSUVATTime-Series Graphs

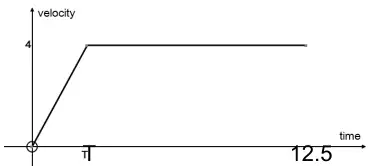
10 Rory runs a distance of 45 m in 12.5 s. He starts from rest and accelerates to a speed of 4 \(\text{m s}^{-1}\). He runs the remaining distance at 4 \(\text{m s}^{-1}\).

Rory proposes a model in which the acceleration is constant until time \(T\) seconds.

(i) Sketch the velocity-time graph for Rory’s run using this model. [2]
(ii) Calculate \(T\). [2]
(iii) Find an expression for Rory’s displacement at time \(t\) s for \(0 \leqslant t \leqslant T\). [2]
(iv) Use this model to find the time taken for Rory to run the first 4 m. [1]

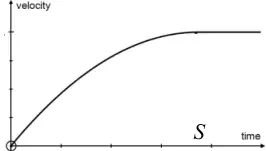
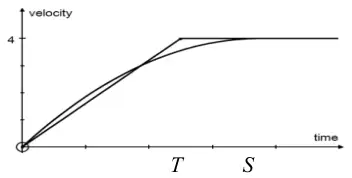
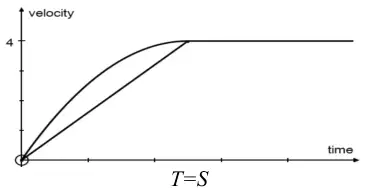
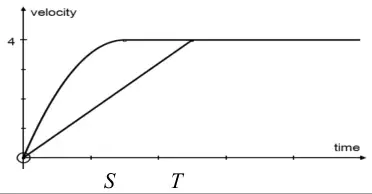
Rory proposes a refined model in which the velocity during the acceleration phase is a quadratic function of \(t\). The graph of Rory’s quadratic goes through \((0, 0)\) and has its maximum point at \((S, 4)\). In this model the acceleration phase lasts until time \(S\) seconds, after which the velocity is constant.

(v) Sketch a velocity-time graph that represents Rory’s run using this refined model. [1]
(vi) State with a reason whether \(S\) is greater than \(T\) or less than \(T\). (You are not required to calculate the value of \(S\).) [1]

June 2025 Unit 2 Q10

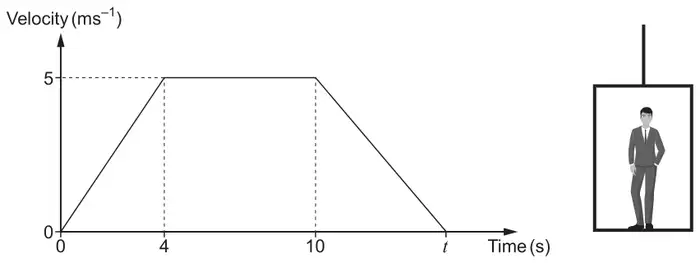
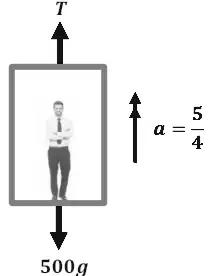
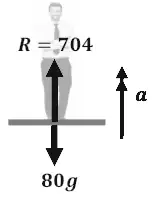
10. A lift is pulled upwards by means of a single cable, as shown in the diagram on the right. A person of mass \(80\text{ kg}\) is standing in the lift. The mass of the lift is \(420\text{ kg}\).

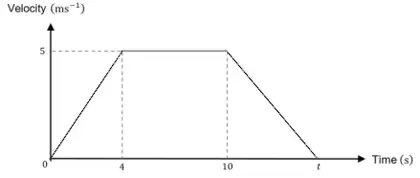
The diagram on the left shows a sketch of the velocity-time graph for the journey of the lift for a period of \(t\) seconds.

Left: velocity-time graph, velocity in ms⁻¹ against time in s, rising from 0 at time 0 to 5 at time 4, constant at 5 until time 10, then falling to 0 at time t. Right: a person standing in a lift hanging from a single cable
(a) Find the tension in the cable while the lift is accelerating. [4]
(b) While the lift is decelerating, the magnitude of the reaction of the floor of the lift on the person is \(704\text{ N}\). Determine the deceleration of the lift and hence show that \(t=15\). [5]
(c) Calculate the distance travelled by the lift during the entire 15 s journey. [2]

June 2024 Unit 2 Q10

WJECCurrent spec11 marksSUVATTime-Series Graphs

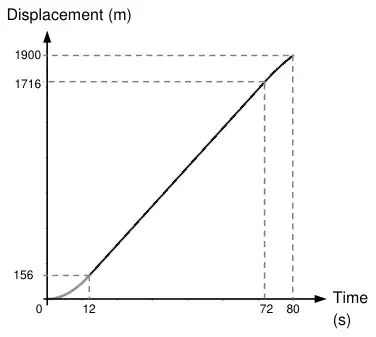
10. A car, starting from rest at a point \(A\), travels along a straight horizontal road towards a point \(B\). The distance between points \(A\) and \(B\) is \(1{\cdot}9\text{ km}\). Initially, the car accelerates uniformly for 12 seconds until it reaches a speed of \(26\text{ ms}^{-1}\). The car continues at \(26\text{ ms}^{-1}\) for 1 minute, before decelerating at a constant rate of \(0{\cdot}75\text{ ms}^{-2}\) until it passes the point \(B\).

(a) Show that the car travels \(156\text{ m}\) while it is accelerating. [2]
(b)
(i) Work out the distance travelled by the car while travelling at a constant speed. [1]
(ii) Hence calculate the length of time for which the car is decelerating until it passes the point \(B\). [5]
(c) Sketch a displacement-time graph for the motion of the car between \(A\) and \(B\). [3]

June 2023 Unit 2 Q11

WJECCurrent spec8 marksTime-Series Graphs

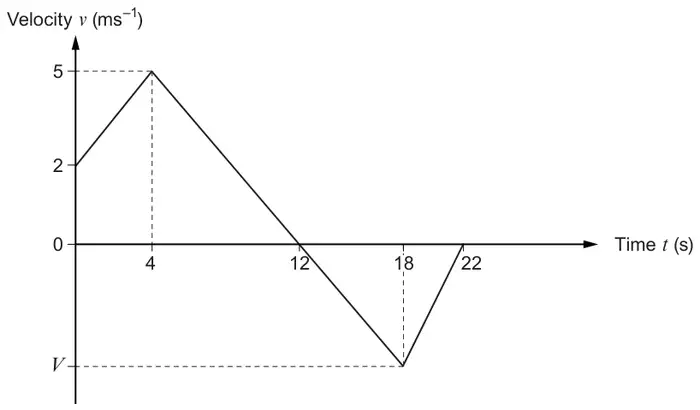
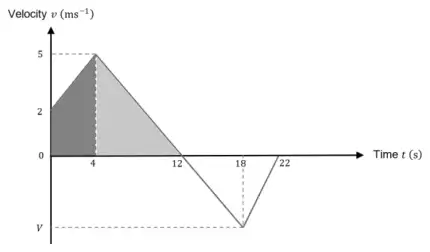
11. A particle, which is initially at the point \(A\), travels in a straight line during the interval \(0\leqslant t\leqslant 22\), where \(t\) is the time in seconds. The diagram below shows a velocity-time graph for the motion of the particle. The velocity of the particle when \(t=18\) is \(V\text{ ms}^{-1}\).

Velocity-time graph, velocity v (ms⁻¹) against time t (s): straight line from (0, 2) to (4, 5), then straight line down to (12, 0), continuing down to (18, V) with V negative, then straight line up to (22, 0)
(a) Find the acceleration of the particle when \(t=1\). [2]
(b) Calculate the distance travelled by the particle during the interval \(0\leqslant t\leqslant 12\). [2]
(c) When \(t=22\), the displacement of the particle from \(A\) is \(14\text{ m}\). Determine the value of \(V\). [3]
(d) Write down the time interval during which the particle is moving towards \(A\) and its speed is increasing. [1]

June 2019 Unit 2 Q7

WJECCurrent spec6 marksTime-Series Graphs

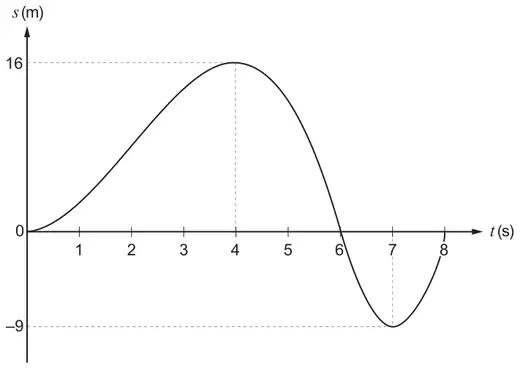
7. An athlete is running along a straight horizontal track during the interval \(0\leqslant t\leqslant 8\), where \(t\) is the time in seconds. The displacement, \(s\) metres, of the athlete relative to the origin \(O\) is modelled by the displacement-time graph shown below.

Displacement-time graph: s rises from 0 at t = 0 to a maximum of 16 at t = 4, falls through 0 at t = 6 to a minimum of –9 at t = 7, then rises to t = 8
(a) Determine the total distance travelled and hence find the average speed of the athlete. [3]
(b) Write down the times when the athlete is instantaneously at rest. [1]
(c) Write down the time interval where
(i) the velocity of the athlete is negative,
(ii) the velocity is increasing and the speed is decreasing. [2]

June 2018 Unit 2 Q11

WJECCurrent spec12 marksSUVATTime-Series Graphs

11. A vehicle moves along a straight horizontal road. Points \(A\) and \(B\) lie on the road.
As the vehicle passes point \(A\), it is moving with constant speed 15 ms–1. It travels with this constant speed for 2 minutes before a constant deceleration is applied for 12 seconds so that it comes to rest at point \(B\).

(a) Find the distance \(AB\). [3]

The vehicle then reverses with a constant acceleration of 2 ms–2 for 8 seconds, followed by a constant deceleration of 1·6 ms–2, coming to rest at the point \(C\), which is between \(A\) and \(B\).

(b) Calculate the time it takes for the vehicle to reverse from \(B\) to \(C\). [4]
(c) Sketch a velocity-time graph for the motion of the vehicle. [3]
(d) Determine the distance \(AC\). [2]