
M1 June 2006 Q1
1.
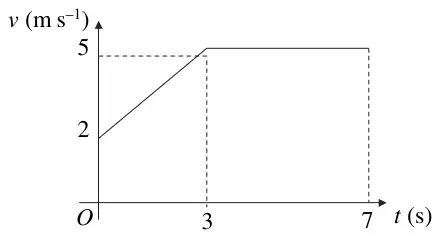
Figure 1 shows the speed-time graph of a cyclist moving on a straight road over a 7 s period. The sections of the graph from \(t = 0\) to \(t = 3\), and from \(t = 3\) to \(t = 7\), are straight lines. The section from \(t = 3\) to \(t = 7\) is parallel to the \(t\)-axis.
State what can be deduced about the motion of the cyclist from the fact that
| Scheme | Marks |
|---|---|
| Constant acceleration | B1 |
| (1) |
Notes
(a) and (b) Accept ‘steady’ instead of ‘constant. Allow ‘o.e.’ (= ‘or equivalent’) within reason! But must have idea of constant.
‘constant speed and constant acceleration’ for (a) or (b) is B0
| Scheme | Marks |
|---|---|
| Constant speed/velocity | B1 |
| (1) |
Notes
(a) and (b) Accept ‘steady’ instead of ‘constant. Allow ‘o.e.’ (= ‘or equivalent’) within reason! But must have idea of constant.
‘constant speed and constant acceleration’ for (a) or (b) is B0
| Scheme | Marks |
|---|---|
| Distance \(= \tfrac{1}{2}(2 + 5) \times 3,\ + (4 \times 5)\) | M1 A1, B1 |
| \(= 30.5\) m | A1 |
| (4) | |
| (6 marks) |
Notes
(c) M1 for valid attempt at area of this trap. as area of a trap. Or this trap. as = triangle + rectangle, i.e. correct formula used with at most a slip in numbers.
B1 for area of rectangle as \(5 \times 4\)
Treating whole as a single const acceln situation, or whole as a single trapezium, is M0.
If assume that top speed is 5.1 or 5.2, allow full marks on f.t. basis (but must be consistent)