
M1 June 2007 Q4
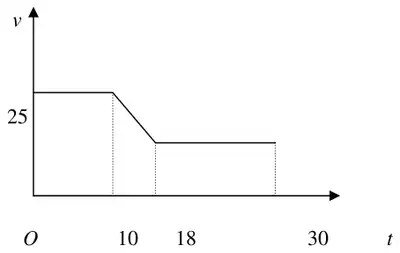
4. A car is moving along a straight horizontal road. At time \(t = 0\), the car passes a point \(A\) with speed 25 m s\(^{-1}\). The car moves with constant speed 25 m s\(^{-1}\) until \(t = 10\) s. The car then decelerates uniformly for 8 s. At time \(t = 18\) s, the speed of the car is \(V\) m s\(^{-1}\) and this speed is maintained until the car reaches the point \(B\) at time \(t = 30\) s.
(a) Sketch, in the space provided, a speed–time graph to show the motion of the car from \(A\) to \(B\). (3)
Given that \(AB = 526\) m, find
(b) the value of \(V\), (5)
(c) the deceleration of the car between \(t = 10\) s and \(t = 18\) s. (3)
| Scheme | Marks |
|---|---|
| 2 horizontal lines | B1 |
| Joined by straight line sloping down | B1 |
| 25, 10, 18, 30 oe | B1 |
| (3) |
| Scheme | Marks |
|---|---|
| \(25 \times 10 + \underline{\tfrac{1}{2}(25 + V) \times 8} + 12 \times V = 526\) | M1 A1 A1 |
| Solving to \(V = 11\) | DM1 A1 |
| (5) |
| Scheme | Marks |
|---|---|
| “\(v = u + at\)” \(\ \Rightarrow\ \ 11 = 25 - 8a\) ft their \(V\) | M1 A1ft |
| \(a = 1.75\ \ (\text{m s}^{-2})\) | A1 |
| (3) | |
| (11 marks) |