June 2022 Paper 1 Q11
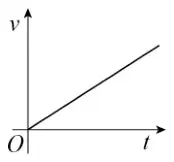
11 A car, initially at rest, moves with constant acceleration along a straight horizontal road.
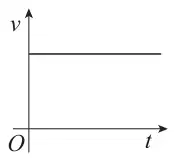
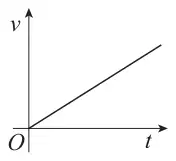
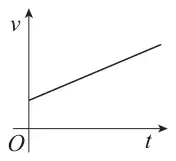
One of the graphs below shows how the car’s velocity, \(v\) m s−1, changes over time, \(t\) seconds.
Identify the correct graph.
Tick (✓) one box. [1 mark]
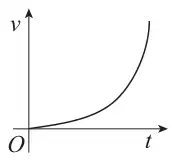
| Scheme | Marks | AO |
|---|---|---|
| Circles correct graph. | B1 | 2.2a |
| (1 mark) |
Typical solution