
M1 June 2012 Q4
4. A car is moving on a straight horizontal road. At time \(t = 0\), the car is moving with speed 20 m s\(^{-1}\) and is at the point \(A\). The car maintains the speed of 20 m s\(^{-1}\) for 25 s. The car then moves with constant deceleration 0.4 m s\(^{-2}\), reducing its speed from 20 m s\(^{-1}\) to 8 m s\(^{-1}\). The car then moves with constant speed 8 m s\(^{-1}\) for 60 s. The car then moves with constant acceleration until it is moving with speed 20 m s\(^{-1}\) at the point \(B\).
Given that the distance from \(A\) to \(B\) is 1960 m,
| Scheme | Marks |
|---|---|
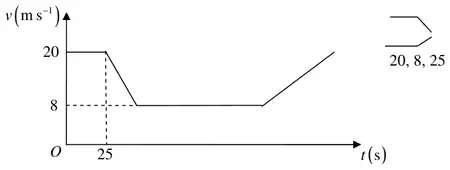 | B1 B1 B1 |
| (3) |
Notes
First B1 for 1st section of graph
Second B1 for 2nd section
Third B1 for the figures 20, 8 and 25
| Scheme | Marks |
|---|---|
| \(v = u + at\ \Rightarrow\ 8 = 20 - 0.4t\) | M1 |
| \(t = 30\) (s) | A1 |
| (2) |
Notes
M1 for a complete method to produce an equation in \(t\) only; allow \((20 - 8)/0.4\)
A1 for 30 N.B.
Give A0 for \(t = -30\), even if changed to 30, but then allow use of 30 in part (c), where full marks could then be scored.
| Scheme | Marks |
|---|---|
| \(1960 = (25 \times 20) + (30 \times 8) + (\tfrac{1}{2} \times 30 \times 12) + (60 \times 8) + 8 \times t + \tfrac{1}{2} \times t \times 12\) | M1A3 ft (2 ,1, 0) |
| \(1960 = 500 + 240 + 180 + 480 + 14t\) | DM1 A1 |
| \(T = 115 + 40\) | DM1 |
| \(= 155\) | A1 |
| N.B. SEE ALTERNATIVES | |
| (8) | |
| (13 marks) |
Notes
First M1 (generous) for clear attempt to find whole area under their graph (must include at least one “1/2”), in terms of a single unknown time (\(t\) say), and equate it to 1960.
First A3, ft on their (b), for a correct equation.
Deduct 1 mark for each numerical error, or omission, in each of the 4 sections of the area corresponding to each stage of the motion. (they may ‘slice’ it, horizontally into 3 sections, or a combination of the two)
Second DM1, dependent on first M1, for simplifying to produce an equation with all their \(t\) terms collected.
Fourth A1 for a correct equation for \(t\) or \(T\)
Third DM1, dependent on second M1. for solving for \(T\)
Fifth A1 155
Please note that any incorrect answer to (b) will lead to an answer of 155 in (c) and can score max 6/8;
Solutions with the correct answer of 155 will need to be checked carefully.
Solutions to 4 (c) N.B. \(t = T - 115\)
A.
| \(1960 = (25 \times 20) + (30 \times 8) + (\tfrac{1}{2} \times 30 \times 12) + (60 \times 8) + 8 \times t + \tfrac{1}{2} \times t \times 12\) | M1 A3 ft |
| \(1960 = 500 + 240 + 180 + 480 + 14t\) | M1 A1 |
| \(T = 115 + 40\) | M1 |
| \(= 155\) | A1 |
B.
| \(1960 = (25 \times 20) + \tfrac{1}{2} \times 30 \times (20 + 8) + (60 \times 8) + \tfrac{1}{2} \times t \times (20 + 8)\) | M1 A3 ft |
| \(1960 = 500 + 420 + 480 + 14t\) | M1 A1 |
| \(T = 115 + 40\) | M1 |
| \(= 155\) | A1 |
C.
| \(1960 = 8T + \tfrac{1}{2} \times 12 \times (55 + 25) + \tfrac{1}{2} \times 12 \times (T - 115)\) | M1 A3 ft |
| \(1960 = 8T + 480 + 6T - 690\) \(1960 = 14T - 210\) | M1 A1 |
| \(155 = T\) | M1 A1 |
D.
| \(1960 = 20T - \tfrac{1}{2} \times 12 \times (60 + T - 25)\) | M1 A3 ft |
| \(1960 = 20T - 6T - 210\) \(1960 = 14T - 210\) | M1 A1 |
| \(155 = T\) | M1 A1 |
E.
| \(1960 = (55 \times 20) - \tfrac{1}{2} \times 30 \times 12 + (60 \times 8) + \tfrac{1}{2} \times t \times (20 + 8)\) | M1 A3 ft |
| \(1960 = 1100 - 180 + 480 + 14t\) | M1 A1 |
| \(T = 115 + 40\) | M1 |
| \(= 155\) | A1 |
F.
| \(1960 = (8 \times 115) + \tfrac{1}{2} \times 12 \times (55 + 25) + \tfrac{1}{2} \times 28 \times (T - 115)\) | M1 A3 ft |
| \(1960 = 920 + 480 + 14T - 1610\) \(1960 = 14T - 210\) | M1 A1 |
| \(155 = T\) | M1 A1 |