
M1 January 2013 Q5
5.
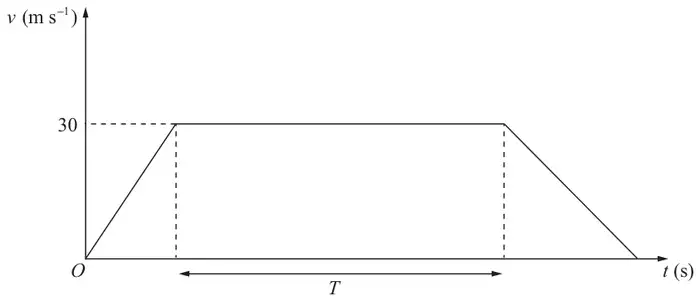
The velocity-time graph in Figure 4 represents the journey of a train \(P\) travelling along a straight horizontal track between two stations which are 1.5 km apart. The train \(P\) leaves the first station, accelerating uniformly from rest for 300 m until it reaches a speed of 30 m s\(^{-1}\). The train then maintains this speed for \(T\) seconds before decelerating uniformly at 1.25 m s\(^{-2}\), coming to rest at the next station.
(a) Find the acceleration of \(P\) during the first 300 m of its journey. (2)
(b) Find the value of \(T\). (5)
A second train \(Q\) completes the same journey in the same total time. The train leaves the first station, accelerating uniformly from rest until it reaches a speed of \(V\) m s\(^{-1}\) and then immediately decelerates uniformly until it comes to rest at the next station.
(c) Sketch on the diagram above, a velocity-time graph which represents the journey of train \(Q\). (2)
(d) Find the value of \(V\). (6)
| Scheme | Marks |
|---|---|
| \(30^2 = 2a.300\) | M1 |
| \(a = 1.5\) | A1 |
| (2) |
| Scheme | Marks |
|---|---|
| \(0^2 = 30^2 - 2 \times 1.25s\) OR \(0 = 30 - 1.25t_2\) | M1 |
| \(s = 360\) \(t_2 = 24\) | A1 |
| \(300 + 30T + 360 = 1500\) \(\dfrac{(20 + T + 24 + T)}{2} \times 30 = 1500\) | M1 A1 |
| \(T = 28\) \(T = 28\) | A1 |
| (5) |
| Scheme | Marks |
|---|---|
| triangle, drawn on the diagram, with base coinciding with base of trapezium, top vertex above line \(v = 30\) and meeting trapezium at least once | B1 |
| \(V\) marked correctly | DB1 |
| (2) |
| Scheme | Marks |
|---|---|
| \(30 = 1.5t_1 \Rightarrow\ t_1 = 20\) | M1 A1 |
| \(30 = 1.25t_2 \Rightarrow t_2 = 24\) | A1 |
| \(\dfrac{1}{2}(20 + 28 + 24)V = 1500\) | M1 A1 |
| \(V = \dfrac{750}{18} = 41.67\) \(= \dfrac{125}{3}\) (oe) or 42 (or better) | A1 |
| (6) | |
| (15 marks) |