
M1 January 2005 Q3
3.
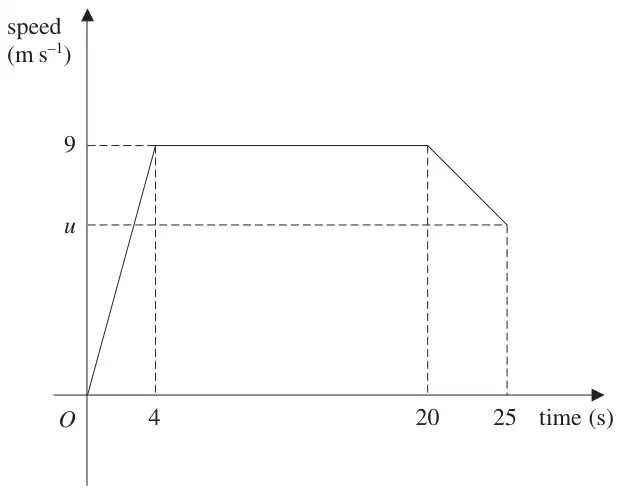
A sprinter runs a race of 200 m. Her total time for running the race is 25 s. Figure 2 is a sketch of the speed-time graph for the motion of the sprinter. She starts from rest and accelerates uniformly to a speed of 9 m s\(^{-1}\) in 4 s. The speed of 9 m s\(^{-1}\) is maintained for 16 s and she then decelerates uniformly to a speed of \(u\) m s\(^{-1}\) at the end of the race. Calculate
(a) the distance covered by the sprinter in the first 20 s of the race, (2)
(b) the value of \(u\), (4)
(c) the deceleration of the sprinter in the last 5 s of the race. (3)
| Scheme | Marks |
|---|---|
| Distance \(= \tfrac{1}{2} \times 4 \times 9 + 16 \times 9\) or \(\tfrac{1}{2}(20 + 16) \times 9\) | M1 |
| \(= 162\) m | A1 |
| (2) |
| Scheme | Marks |
|---|---|
| Distance over last 5 s \(= \tfrac{1}{2}(9 + u) \times 5\) | M1 |
| \(162 + \tfrac{1}{2}(9 + u) \times 5 = 200\) | M1 A1ft |
| \(\Rightarrow u = 6.2\) m s\(^{-1}\) | A1 |
| (4) |
| Scheme | Marks |
|---|---|
| \(6.2 = 9 + 5a\) | M1 A1ft |
| \(a = (-)\,0.56\) m s\(^{-2}\) | A1 |
| (3) | |
| (9 marks) |