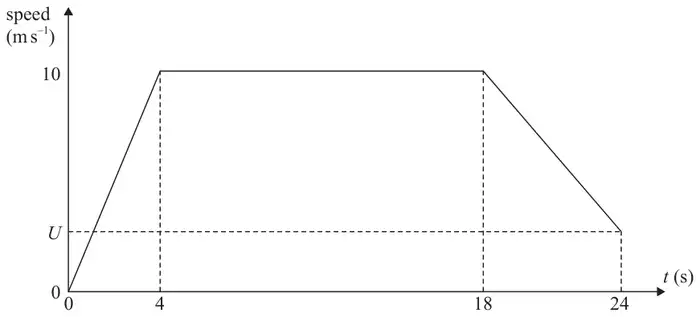
Figure 2 shows a speed-time graph for a model of the motion of an athlete running a 200 m race in 24 s.
The athlete
starts from rest at time \(t = 0\) and accelerates at a constant rate, reaching a speed of \(10\ \text{m s}^{-1}\) at \(t = 4\)
then moves at a constant speed of \(10\ \text{m s}^{-1}\) from \(t = 4\) to \(t = 18\)
then decelerates at a constant rate from \(t = 18\) to \(t = 24\), crossing the finishing line with speed \(U\ \text{m s}^{-1}\)
Using the model,
(a) find the acceleration of the athlete during the first 4 s of the race, stating the units of your answer, (2)
(b) find the distance covered by the athlete during the first 18 s of the race, (3)
(c) find the value of \(U\). (3)
Mark scheme (a)
Scheme
Marks
AO
\(\dfrac{10}{4}\)
M1
3.4
\(2.5,\ \dfrac{5}{2},\ \dfrac{10}{4}\ \text{m s}^{-2}\) units needed.
A1
1.1b
(2)
Notes
M1: Any complete suvat method to find \(a\) e.g. use \(s = 20\) and \(20 = \dfrac{1}{2}a \times 4^2\) N.B. Ignore units at this stage
A1:Any equivalent number with correct units. Accept m/s², m/s/s, m per s per s.
Mark scheme (b)
Scheme
Marks
AO
Find the area, with correct structure, from \(t = 0\) to 18
M1
3.1b
\(\dfrac{1}{2} \times 4 \times 10 + (14 \times 10)\) triangle + rectangle or \(\dfrac{1}{2} \times 10 \times (14 + 18)\) trapezium or \((18 \times 10) - \dfrac{1}{2} \times 4 \times 10\) rectangle – triangle N.B. \(\dfrac{1}{2} \times 4 \times 10\) may be replaced by \(\dfrac{1}{2} \times 2.5 \times 4^2\) using \(s = ut + \dfrac{1}{2}at^2\) or by \(\dfrac{10^2 - 0^2}{2 \times 2.5}\) using \(v^2 = u^2 + 2as\)
A1
1.1b
160 (m)
A1
1.1b
(3)
Notes
M1: Complete method, they may use suvat on one or more sections, to find the TOTAL area. M0 if a single suvat equation is used for the whole motion M0 if \(\dfrac{1}{2}\) not seen used in an area method
A1: Correct unsimplified expression.
A1: cao. Ignore units. N.B. Correct answer, with no working, can score all 3 marks.
Mark scheme (c)
Scheme
Marks
AO
Using area, from \(t = 18\) to \(t = 24\), \(= (200 - \text{their (b)})\) with correct structure OR \(s = (200 - \text{their (b)})\), using suvat to find \(s\) N.B. If their (b) is incorrect and they don’t use it, allow a correct restart.
M1: Complete method, using area or suvat, to give an equation in \(U\) only, with correct structure M0 if \(\dfrac{1}{2}\) not seen used in an area method M0 if 10 is used instead of \((10 - U)\) or \((10 - U)\) is used instead of \((10 + U)\) in any equation
A1ft: Correct unsimplified equation in \(U\) only (allow \(V\) or \(v\) instead of \(U\)), ft on their 160.
A1: Accept 3.3 or better. Ignore units. Allow use of \(V\) throughout instead of \(U\), including in the answer. N.B. Correct answer, with no working, can score all 3 marks.
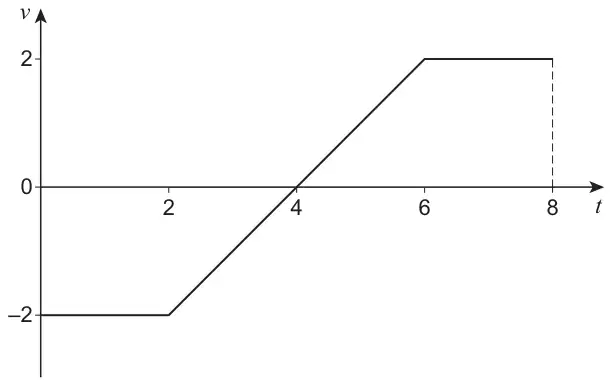
15 A car is moving in a straight line along a horizontal road.
The graph below shows how the car’s velocity \(v\) m s−1 changes with time, \(t\) seconds.
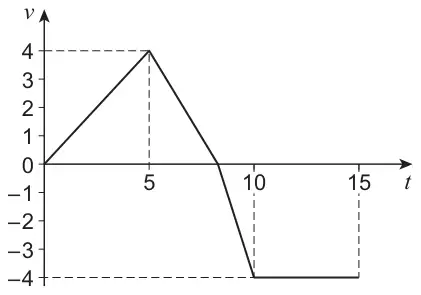
Over the period \(0 \leqslant t \leqslant 15\) the car has a total displacement of \(-7\) metres.
Initially the car has velocity 0 m s−1
Find the next time when the velocity of the car is 0 m s−1[4 marks]
Mark scheme
Scheme
Marks
AO
Obtains a correct expression for the area of a triangle above the time axis in terms of a variable for time
B1
1.1b
Obtains a correct expression for the area of the triangle or trapezium below the time axis in terms of a variable for time accept negative area for displacement
B1
1.1b
Forms equation with a single variable using their expressions for area consistent with area above − area below = \(\pm k\) Or Forms equation with a single variable using their expressions for displacement consistent with disp above + disp below = \(k\) Where \(k\) is one of 3, 7, 13 or 17
M1
3.1b
Obtains 8.25 seconds OE Condone missing or incorrect units
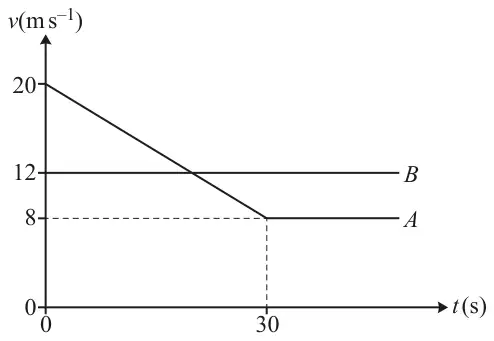
The diagram shows a velocity-time graph representing the motion of two cars \(A\) and \(B\) which are both travelling along a horizontal straight road. At time \(t = 0\), car \(B\), which is travelling with constant speed \(12\,\mathrm{m\,s^{-1}}\), is overtaken by car \(A\) which has initial speed \(20\,\mathrm{m\,s^{-1}}\).
From \(t = 0\) car \(A\) travels with constant deceleration for 30 seconds. When \(t = 30\) the speed of car \(A\) is \(8\,\mathrm{m\,s^{-1}}\) and the car maintains this speed in its subsequent motion.
(a) Calculate the deceleration of car \(A\). [2]
(b) Determine the value of \(t\) when \(B\) overtakes \(A\). [4]
Mark scheme (a)
Scheme
Marks
AO
\(8 = 20 + 30a\)
M1
3.4
\(a = -0.4\) so deceleration is 0.4 (\(\mathrm{m\,s^{-2}}\))
A1
1.1
[2]
Notes
M1: Use of \(v = u + at\) with given values (allow \(v = 20\) and \(u = 8\))
A1: Allow 0.4 or \(-0.4\)
Mark scheme (b)
Scheme
Marks
AO
Distance travelled by \(B\): \(12t\)
B1
1.1
Distance travelled by \(A\): \(\dfrac{1}{2}(8 + 20)(30) + 8(t - 30)\) or \(\dfrac{1}{2}(30)(12) + 8t\)
B1
1.1
\(12t =\) ‘420’ \(+ 8t -\) ‘240’
M1
3.1b
\(t = 45\)
A1
1.1
[4]
Notes
B1: Or first 30 seconds: \(B\) travels \(12(30)\) \((= 360)\)
B1: Or first 30 seconds: \(A\) travels \(0.5(8 + 20)(30)\) \((= 420)\)
M1: M1 for a (possibly unsimplified) correct equation/inequality in \(t\) where ‘360’ and ‘420’ must have been correct unsimplified e.g. ‘420’ − ‘360’ \(= (t - 30)(12 - 8)\), \(12(t - 30) +\) ‘360’ \(= 8(t - 30) +\) ‘420’, ‘420’ \(+ 8(t - 30) = 12t\) etc. Or for a correct equation in another time variable e.g. \(12T +\) ‘360’ \(= 8T +\) ‘420’ and \(T = t - 30\) seen or implied If an inequality used, then allow incorrect direction or strict inequality symbol for this mark
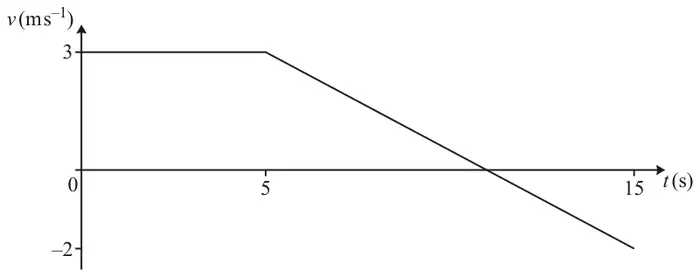
6 A car is travelling along a straight horizontal road. The car’s velocity \(v\,\mathrm{m\,s^{-1}}\) at time \(t\) s is shown in the velocity-time graph below. The points (0, 3) and (5, 3) are joined with a line segment, and the points (5, 3) and (15, \(-2\)) are joined with another line segment.
(a) Calculate the total distance travelled by the car in the first 15 s. [3]
The car is then attached to a caravan by means of a light inextensible horizontal tow bar and continues travelling along the road. You are given the following information.
The car and caravan accelerate at \(1.5\,\mathrm{m\,s^{-2}}\).
The mass of the car is 1400 kg and the mass of the caravan is 900 kg.
The driving force acting on the car is \(D\) N and the tension in the tow bar is \(T\) N.
The resistances to motion acting on the car and caravan are 400 N and 450 N respectively.
(b) Write down the equations of motion for the car and the caravan separately. [2]
M1: Attempt to find the area between the graph and the \(x\)-axis Allow \(\pm 2\) used for height of the triangle below the axis soi Trapezium plus triangle gives \(\frac{1}{2}\times 3(11+5)\) instead of the first two terms
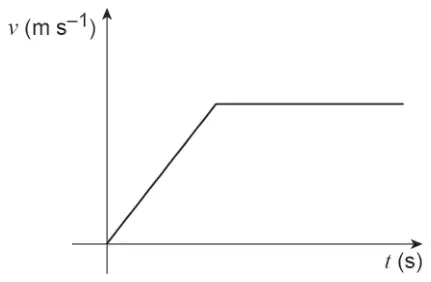
8 A bus is travelling along a straight road at \(5.4\,\mathrm{m\,s^{-1}}\). At \(t = 0\), as the bus passes a boy standing on the pavement, the boy starts running in the same direction as the bus, accelerating at \(1.2\,\mathrm{m\,s^{-2}}\) from rest for 5 s. He then runs at constant speed until he catches up with the bus.
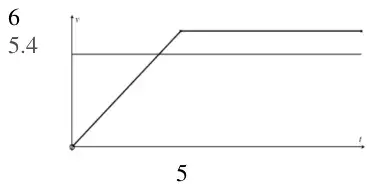
(a) The diagram in the Printed Answer Booklet shows the velocity-time graph for the bus. Draw the velocity-time graph for the boy on this diagram. [3]
(b) Determine the time at which the boy is running at the same speed as the bus. [2]
(c) Find the maximum distance between the bus and the boy. [3]
(d) Find the distance the boy has run when he catches up with the bus. [3]
Mark scheme (a)
Scheme
Marks
AO
B1 B1 B1
3.3 3.3 3.3
[3]
Notes
B1: Straight line segment with positive gradient from the origin
B1: Subsequent line segment horizontal and above the given line
B1: Gradient change in their graph labelled with 5 and 6. (May be on axes)
Mark scheme (b)
Scheme
Marks
AO
velocity of the boy \([t < 5\text{ s}]\) \(v = 1.2t = 5.4\)
M1
3.1b
giving \(t = 4.5\) s
A1
1.1b
[2]
Notes
M1: Equates an expression for boy’s velocity to 5.4
A1: Mark final answer
Mark scheme (c)
Scheme
Marks
AO
Max distance when \(t = 4.5\)
M1
3.1b
boy travels \(\frac{1}{2} \times 1.2 \times 4.5^2 = 12.15\)
M1
3.1b
bus travels \(4.5 \times 5.4 = 24.3\) m Max distance is \(24.3 - 12.15 = 12.15\) m
A1
1.1b
[3]
Notes
M1: recognises that max distance occurs when speeds are equal. Allow for their \(t < 5\) from (b) used. Allow for \(u = 0,\ v = 5.4\) and \(a = 1.2\) in \(v^2 = u^2 + 2as\)
M1: attempt to use suvat or area under the graph and their time \(t \leqslant 5\) to find distance travelled by boy.
A1: Cao
Alternative method 1
Scheme
Marks
Max distance gained by the bus ahead of the boy is represented by the area of the triangle on velocity-time graph
M1
Distance \(= \frac{1}{2} \times 5.4 \times 4.5 = 12.15\) m
M1 A1
M1: recognises that max distance occurs when the speeds are equal. Allow for their time from (b) used
M1: Attempt to find area of the triangle
A1: Cao
Alternative method 2
Scheme
Marks
Distance \(S\) at time \(t\) between \([t < 5]\) \([S =]\ 5.4t - \frac{1}{2} \times 1.2t^2\)
M1
Max occurs when \(\frac{\mathrm{d}S}{\mathrm{d}t} = 5.4 - 1.2t = 0\)
M1
When \(t = 4.5\), max distance is 12.15 m
A1
M1: Combines expressions from suvat equations to find expression for the distance between
M1: Equates the derivative of their expression to zero leading to a value for \(t\)
A1: Cao
Mark scheme (d)
Scheme
Marks
AO
Let the time from start to catch the bus be \(T\) s Boy’s distance is area of trapezium \(\frac{1}{2} \times 6(T + T - 5)\ [= 6T - 15]\)
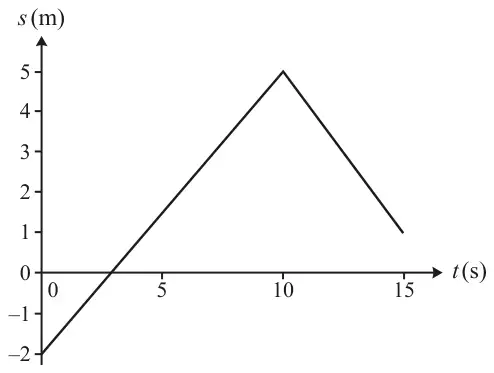
1 A particle moves along a straight line. The displacement \(s\) m at time \(t\) s is shown in the displacement-time graph below. The graph consists of straight line segments joining the points \((0, -2)\), \((10, 5)\) and \((15, 1)\).
(a) Find the distance travelled by the particle in the first 15 s. [2]
(b) Calculate the velocity of the particle between \(t = 10\) and \(t = 15\). [2]
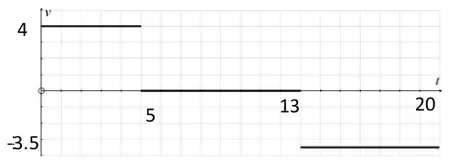
5 A child is running up and down a path. A simplified model of the child’s motion is as follows:
he first runs north for 5 s at \(4\,\mathrm{m\,s^{-1}}\);
he then suddenly stops and waits for 8 s;
finally he runs in the opposite direction for 7 s at \(3.5\,\mathrm{m\,s^{-1}}\).
(a) Taking north to be the positive direction, sketch a velocity-time graph for this model of the child’s motion. [2]
Using this model,
(b) calculate the total distance travelled by the child, [2]
(c) find his final displacement from his original position. [1]
Mark scheme (a)
Scheme
Marks
AO
B1
B1
1.1
1.1
[2]
Notes
B1: Graph from 3 horizontal line segments. Correct velocities labelled Any lines joining the horizontal lines should be vertical
B1: Times seen – either \(t\) = 5, 13, 20 or lengths of line segments 5, 8, 7 seen.
Mark scheme (b)
Scheme
Marks
AO
Distance \(= (4 \times 5) + (7 \times 3.5)\) m
M1
1.1a
\(= 44.5\)
A1
1.1
[2]
Notes
M1: finding the area of at least one region from their graph oe May work directly from the information in the question without reference to their graph
A1: cao
Mark scheme (c)
Scheme
Marks
AO
Displacement \(= 20 - 24.5 = -4.5\) m
B1
1.1
[1]
Notes
B1: Allow for –4.5 m or for 4.5 m south Do not allow -4.5 m south