
June 2024 Paper 3 Mechanics Q2
2.
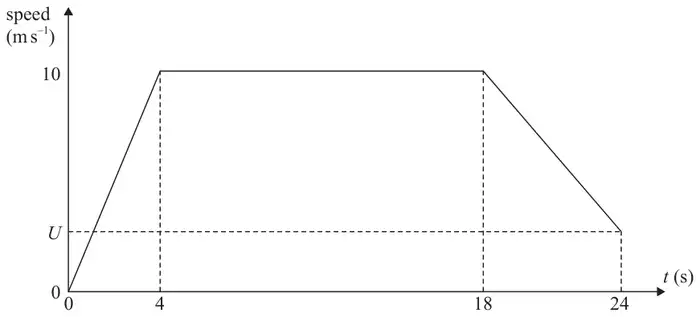
Figure 2 shows a speed-time graph for a model of the motion of an athlete running a 200 m race in 24 s.
The athlete
- starts from rest at time \(t = 0\) and accelerates at a constant rate, reaching a speed of \(10\ \text{m s}^{-1}\) at \(t = 4\)
- then moves at a constant speed of \(10\ \text{m s}^{-1}\) from \(t = 4\) to \(t = 18\)
- then decelerates at a constant rate from \(t = 18\) to \(t = 24\), crossing the finishing line with speed \(U\ \text{m s}^{-1}\)
Using the model,
| Scheme | Marks | AO |
|---|---|---|
| \(\dfrac{10}{4}\) | M1 | 3.4 |
| \(2.5,\ \dfrac{5}{2},\ \dfrac{10}{4}\ \text{m s}^{-2}\) units needed. | A1 | 1.1b |
| (2) |
Notes
M1: Any complete suvat method to find \(a\)
e.g. use \(s = 20\) and \(20 = \dfrac{1}{2}a \times 4^2\)
N.B. Ignore units at this stage
A1: Any equivalent number with correct units.
Accept m/s², m/s/s, m per s per s.
| Scheme | Marks | AO |
|---|---|---|
| Find the area, with correct structure, from \(t = 0\) to 18 | M1 | 3.1b |
| \(\dfrac{1}{2} \times 4 \times 10 + (14 \times 10)\) triangle + rectangle or \(\dfrac{1}{2} \times 10 \times (14 + 18)\) trapezium or \((18 \times 10) - \dfrac{1}{2} \times 4 \times 10\) rectangle – triangle N.B. \(\dfrac{1}{2} \times 4 \times 10\) may be replaced by \(\dfrac{1}{2} \times 2.5 \times 4^2\) using \(s = ut + \dfrac{1}{2}at^2\) or by \(\dfrac{10^2 - 0^2}{2 \times 2.5}\) using \(v^2 = u^2 + 2as\) | A1 | 1.1b |
| 160 (m) | A1 | 1.1b |
| (3) |
Notes
M1: Complete method, they may use suvat on one or more sections, to find the TOTAL area.
M0 if a single suvat equation is used for the whole motion
M0 if \(\dfrac{1}{2}\) not seen used in an area method
A1: Correct unsimplified expression.
A1: cao. Ignore units.
N.B. Correct answer, with no working, can score all 3 marks.
| Scheme | Marks | AO |
|---|---|---|
| Using area, from \(t = 18\) to \(t = 24\), \(= (200 - \text{their (b)})\) with correct structure OR \(s = (200 - \text{their (b)})\), using suvat to find \(s\) N.B. If their (b) is incorrect and they don’t use it, allow a correct restart. | M1 | 3.1b |
| \(6U + \dfrac{1}{2} \times 6 \times (10 - U) = 200 - \text{their (b)}\) rectangle + triangle or \(\dfrac{1}{2} \times 6 \times (10 + U) = 200 - \text{their (b)}\) trapezium \(\left(s = \left(\dfrac{u+v}{2}\right)t\right)\) or \((6 \times 10) - \dfrac{1}{2} \times 6 \times (10 - U) = 200 - \text{their (b)}\) rectangle – triangle or \((10 \times 6) + \dfrac{1}{2}\left(-\dfrac{(10 - U)}{6}\right) \times 6^2 = 200 - \text{their (b)}\) \(s = ut + \dfrac{1}{2}at^2\) or \((U \times 6) - \dfrac{1}{2}\left(-\dfrac{(10 - U)}{6}\right) \times 6^2 = 200 - \text{their (b)}\) \(s = vt - \dfrac{1}{2}at^2\) N.B. Two stage suvat method: \((10 \times 6) + \dfrac{1}{2}a \times 6^2 = 200 - \text{their (b)} \Rightarrow\) AND \(U = 10 + 6 \times \text{their } a\) | A1ft | 1.1b |
| \(\dfrac{10}{3} = 3\dfrac{1}{3}\) oe | A1 | 1.1b |
| (3) | ||
| (8 marks) |
Notes
M1: Complete method, using area or suvat, to give an equation in \(U\) only, with correct structure
M0 if \(\dfrac{1}{2}\) not seen used in an area method
M0 if 10 is used instead of \((10 - U)\) or \((10 - U)\) is used instead of \((10 + U)\) in any equation
A1ft: Correct unsimplified equation in \(U\) only (allow \(V\) or \(v\) instead of \(U\)), ft on their 160.
A1: Accept 3.3 or better. Ignore units.
Allow use of \(V\) throughout instead of \(U\), including in the answer.
N.B. Correct answer, with no working, can score all 3 marks.