
June 2023 Paper 2 Q12
12 A particle moves in a straight line.
After the first 4 seconds of its motion, the displacement of the particle from its initial position is 0 metres.
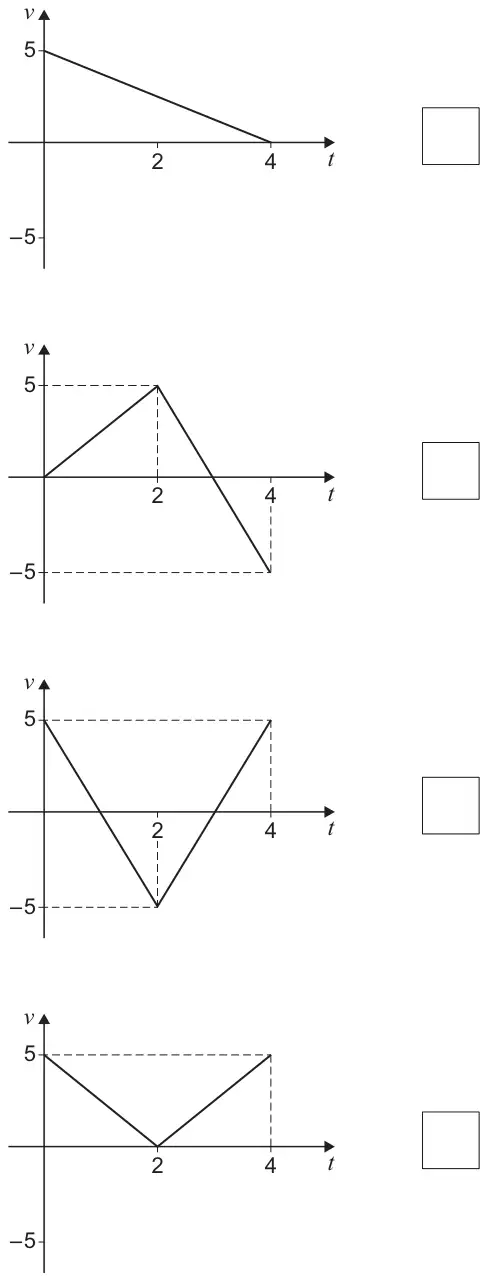
One of the graphs below shows the velocity \(v\) m s−1 of the particle after time \(t\) seconds of its motion.
Identify the correct graph.
Tick (✓) one box. [1 mark]
| Scheme | Marks | AO |
|---|---|---|
| Ticks correct box | B1 | 2.2a |
| (1 mark) |
Typical solution
The third graph: \(v\) decreases from 5 at \(t = 0\) to \(-5\) at \(t = 2\), then increases to 5 at \(t = 4\)