
June 2023 Mechanics Q1
1.
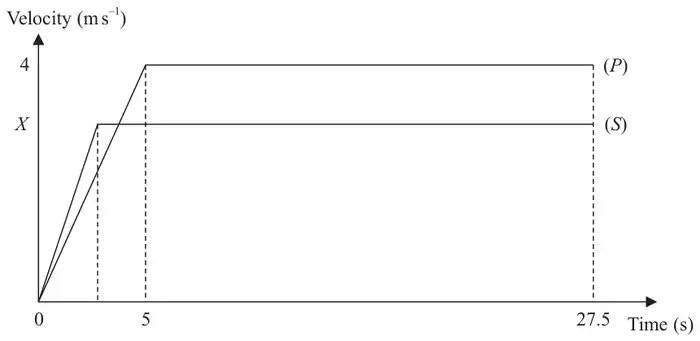
Two children, Pat (\(P\)) and Sam (\(S\)), run a race along a straight horizontal track.
Both children start from rest at the same time and cross the finish line at the same time.
In a model of the motion:
Pat accelerates at a constant rate from rest for 5 s until reaching a speed of \(4\ \mathrm{m\,s^{-1}}\) and then maintains a constant speed of \(4\ \mathrm{m\,s^{-1}}\) until crossing the finish line.
Sam accelerates at a constant rate of \(1\ \mathrm{m\,s^{-2}}\) from rest until reaching a speed of \(X\ \mathrm{m\,s^{-1}}\) and then maintains a constant speed of \(X\ \mathrm{m\,s^{-1}}\) until crossing the finish line.
Both children take 27.5 s to complete the race.
The velocity-time graphs shown in Figure 1 describe the model of the motion of each child from the instant they start to the instant they cross the finish line together.
Using the model,
| Scheme | Marks | AO |
|---|---|---|
| Because the distances travelled or displacements are equal oe. If they mention the times are the same as well, ignore it. | B1 | 2.4 |
| (1) |
Notes
B1 Must mention distances being equal specifically.
| Scheme | Marks | AO |
|---|---|---|
| 0.8 or 4/5 \((\mathrm{m\,s^{-2}})\) | B1 | 1.1b |
| (1) |
Notes
B1 cao
| Scheme | Marks | AO |
|---|---|---|
| \(\tfrac{1}{2} \times 5 \times 4 + (4 \times 22.5)\) OR \(\tfrac{1}{2}(27.5 + 22.5) \times 4\) OR \(27.5 \times 4 - \tfrac{1}{2} \times 5 \times 4\) | M1 | 3.1b |
| 100 (m) | A1 | 1.1b |
| (2) |
Notes
M1 Clear attempt to find the total area under the \(P\) graph, with the correct structure i.e. (triangle + rectangle) OR trapezium OR (rectangle – triangle); must see use of ½ where appropriate.
OR they may use suvat to find the distance covered by \(P\) in one or more of the sections.
N.B. M0 for use of a single suvat formula for the whole motion
A1 cao
| Scheme | Marks | AO |
|---|---|---|
| Total area under graph = their answer for part (c) | M1 | 3.1b |
| \(\tfrac{1}{2}X \times X + X(27.5 - X) = 100\) OR \(\tfrac{1}{2}(27.5 + 27.5 - X) \times X = 100\) OR \(27.5X - \tfrac{1}{2}X^2 = 100\) | A1ft A1ft | 1.1b 1.1b |
| \(X = 3.92\) to 3sf | A1 | 1.1b |
| (4) | ||
| (8 marks) |
Notes
M1 Clear attempt to equate the total area under the \(S\) graph, with the correct structure, i.e. (triangle + rectangle) OR trapezium OR (rectangle – triangle), must see use of ½ where appropriate, to their answer for (c) to give a quadratic equation in \(X\) only
N.B. they may use suvat to find the distance covered by \(S\) in one or more of the sections.
N.B. M0 for use of a single suvat formula for the whole motion
A1ft Correct unsimplified quadratic equation in \(X\) only with at most one error, follow their answer for (c)
A1ft Correct unsimplified quadratic equation in \(X\) only, follow their answer for (c)
A1 cao