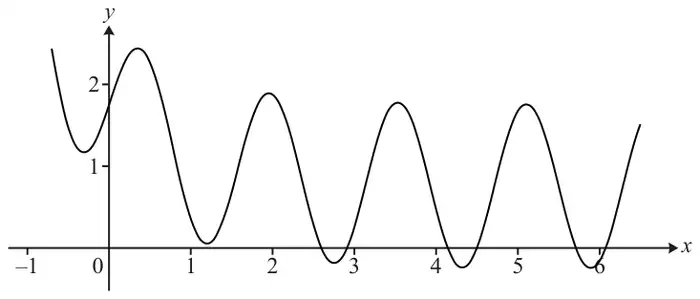
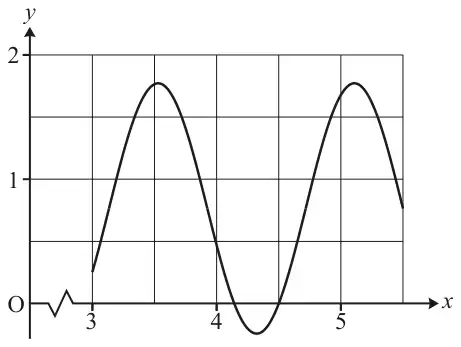
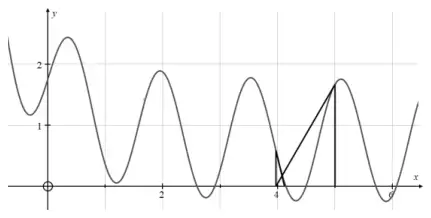
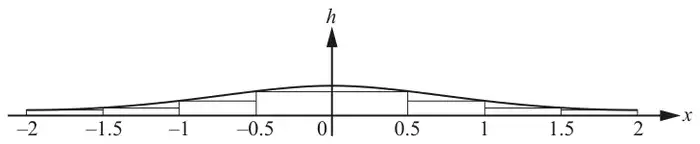
May use \(t\) or another variable which is acceptable.
M1: Uses the model with \(v = 0\) and proceeds to \(\mathrm{e}^{0.2T} = 15\) Do not be concerned by the use of an inequality sign instead of an equals. May be implied by awrt 13.5
A1: \((T =)\) awrt 13.5 units are not required but if given they must be seconds (or e.g. secs or s)
Mark scheme (b)
Scheme
Marks
AO
Attempts to differentiate using the product rule \(\left(\dfrac{\mathrm{d}}{\mathrm{d}t}\left(t\,\mathrm{e}^{0.2t}\right) =\right) 0.2t\,\mathrm{e}^{0.2t} + \mathrm{e}^{0.2t}\)
\(\Rightarrow t = 5\ln\left(\dfrac{75}{t + 5}\right)\) *
A1*
2.1
(4)
Notes
If no attempt is seen for (b) then allow differentiation seen in (a) to score in (b)
M1: Attempts to use the product rule to differentiate \(t\,\mathrm{e}^{0.2t}\) achieving the form \(A\mathrm{e}^{0.2t} + Bt\mathrm{e}^{0.2t}\) (\(A\) and \(B\) both non zero but may be 1) which may be unsimplified. It is likely to be part of an expression.
A1: \(\left(\dfrac{\mathrm{d}v}{\mathrm{d}t} =\right) 15 - \left(0.2t\,\mathrm{e}^{0.2t} + \mathrm{e}^{0.2t}\right)\) o.e. which may be unsimplified. (Condone a missing trailing bracket) Do not allow recovery of signs to score this mark if they initially write e.g. \(15 - 0.2t\,\mathrm{e}^{0.2t} + \mathrm{e}^{0.2t} = 0\) and on a later line correct this. e.g. \(15 - 0.2t\,\mathrm{e}^{0.2t} - \mathrm{e}^{0.2t} = 0\)
dM1: Sets \(15 \pm A\mathrm{e}^{0.2t} \pm Bt\mathrm{e}^{0.2t} = 0\) (the =0 may be implied), attempts to make \(\mathrm{e}^{\pm 0.2t}\) (or \(C\mathrm{e}^{\pm 0.2t}\)) the subject and proceeds to the form \(C\mathrm{e}^{0.2t} = \dfrac{D}{E + Ft}\) or \(C\mathrm{e}^{-0.2t} = \dfrac{E + Ft}{D}\) (where \(C\) can be 1 and \(A, B, C, D, E, F \neq 0\)) It is dependent on the previous method mark. May see \(15 - \text{``}0.2t\,\mathrm{e}^{0.2t} - \mathrm{e}^{0.2t}\text{''} = 0 \Rightarrow \mathrm{e}^{0.2t} = \dfrac{15}{0.2t + 1}\) which scores dM1 They must take out a factor of \(\mathrm{e}^{\pm 0.2t}\) (or \(C\mathrm{e}^{\pm 0.2t}\)) and divide by their bracket. Condone sign slips in their rearrangement, however, if they take logs of both sides first, the rearrangement must be correct (with no sign slips). Allow invisible brackets to be implied by further work which is not the given answer.
A1*: Achieves the given answer with no errors seen including use of invisible brackets (but condone a missing trailing bracket) All previous marks in (b) must have been scored. The = 0 must have been seen somewhere in their solution. Do not allow this mark to be scored for proceeding directly from \(\mathrm{e}^{0.2t}(0.2t + 1) = 15 \Rightarrow t = 5\ln\left(\dfrac{75}{t + 5}\right)\) which is A0* We must see either \(\mathrm{e}^{0.2t} = \dfrac{15}{0.2t + 1}\) o.e. or an unsimplified expression for \(t\) e.g. \(t = 5\ln\left(\dfrac{15}{0.2t + 1}\right)\) before achieving the given answer. Condone \(t = 5\ln\dfrac{75}{t + 5}\)
(c)(i)Check by the question. If there is a contradiction between answers, the answer in the main body of the script takes precedence.
M1: Attempts to use the iteration formula at least once. \(t_2 = 5\ln\left(\dfrac{75}{8 + 5}\right)\). May be implied by awrt 8.76 or awrt 8.48 or awrt 8.58. It is not implied by awrt 8.55
A1: awrt 8.478 (on its own can score M1A1)
(c)(ii)This mark can only be scored provided in (c)(i) M1 has been scored so M0A0A1 is not a possible mark profile.
A1: awrt 8.55 seconds (e.g. s or secs) Requires units. If the candidate lists their iterations but does not select an answer then take the final value, which still requires units to be stated (which in many cases is likely to be omitted) Note that awrt 8.55 does not imply M1.
M1: Eliminates e by setting their \(\mathrm{f}^{\prime}(x) =\) their \(\mathrm{g}^{\prime}(x)\) where \(\mathrm{f}^{\prime}(x) = Ax\mathrm{e}^{4x^2-1}\) oe and \(\mathrm{g}^{\prime}(x) = \dfrac{B}{x}\) oe with \(A \times B \gt 0\) and proceeds via \(\mathrm{e}^{4x^2-1} = \dfrac{\ldots}{x^2}\) or equivalent work (see below) to obtain \(4x^2 - 1 = \ln\dfrac{\ldots}{x^2}\) oe e.g. \(\ln x + 4x^2 - 1 = \ln\dfrac{1}{x}\) Allow if they use \(\alpha\) for \(x\). Note that there are various alternatives for this mark but the derivatives must be of the form defined above and the processing must be correct with coefficient/sign slips only.
A1*: Obtains the printed answer with sufficient working and no errors. Sufficient work would require the “e” eliminated before the given answer. Must follow correct derivatives in part (a). Condone \(4x^2 + 2\ln|x| - 1 = 0\) and condone \(4\alpha^2 + 2\ln\alpha - 1 = 0\) or \(4\alpha^2 + 2\ln|\alpha| - 1 = 0\)
Note that if both derivatives in (a) are correct we will allow fully correct work using the equation in (b) to work backwards to verify that \(p\mathrm{f}^{\prime}(x) = q\mathrm{g}^{\prime}(x)\) for M1 then obtains \(\mathrm{f}^{\prime}(x) = \mathrm{g}^{\prime}(x)\) with a minimal conclusion for A1 If either derivative in (a) is incorrect or missing, candidates who work backwards score no marks in (b).
M1: Attempts to use the iterative formula with \(x_1 = 0.6\) Award this mark for e.g. \((x_2 =)\sqrt{\dfrac{1 - 2\ln 0.6}{4}}\) or may be implied by awrt 0.71 provided no incorrect working is seen. Candidates sometimes find \(x_3\) (or possibly subsequent terms) rather than \(x_2\) in which case the M1 can be implied. (See table below for first few iterations)
3. \[\mathrm{f}(x) = x + \tan\left(\frac{1}{2}x\right) \qquad \pi \lt x \lt \frac{3\pi}{2}\]
Given that the equation \(\mathrm{f}(x) = 0\) has a single root \(\alpha\)
(a) show that \(\alpha\) lies in the interval [3.6, 3.7] (2)
(b) Find \(\mathrm{f}^{\prime}(x)\) (2)
(c) Using 3.7 as a first approximation for \(\alpha\), apply the Newton–Raphson method once to obtain a second approximation for \(\alpha\). Give your answer to 3 decimal places. (2)
Change of sign and function is continuous in the interval \(\Rightarrow\) conclusion e.g. “there is a root in [3.6, 3.7]” *
A1*
2.4
(2)
Notes
M1: Attempts both f(3.6) and f(3.7) or a narrower interval that contains the root 3.672… (which may be implied by sight of f(3.6) = … and f(3.7) = … with at least one correct) and obtains at least one correct to 1 significant figure (rounded or truncated) for their interval and considers their signs. Use of degrees is M0.
Some examples for consideration of sign (which are also sufficient for the change of sign part of reasoning for the A1):
\(\mathrm{f}(3.6) = -0.7,\ \mathrm{f}(3.7) = 0.2\) “change in sign”
For reference \(\mathrm{f}(3.6) = -0.68626\ldots\) and \(\mathrm{f}(3.7) = 0.21194\ldots\)
A1*: This mark requires:
both f(3.6) and f(3.7) correct to 1 significant figure (rounded or truncated) (or their values correct to 1 significant figure if using a narrower interval)
a reference to sign change
a reference to continuity {of \(\mathrm{f}(x)\)}
a (minimal) conclusion, e.g. “hence root”, “proved”, \(\checkmark\), #, QED, \(3.6 \lt \alpha \lt 3.7\)
Accept as a minimum, "change of sign, continuous, root". Do not condone “change in sign therefore continuous” or other incorrect statements such as “\(x\) is continuous”, “the interval is continuous” – these score A0. Condone “the graph is continuous”. Condone reference to \(x\) in place of \(\alpha\) in their conclusion, e.g. “hence \(x\) lies in the interval”. Condone statements such as “there is at least one root” in place of their conclusion.
Mark scheme (b)
Scheme
Marks
AO
Use of \(\tan\left(\dfrac{1}{2}x\right) \rightarrow \ldots\sec^2\left(\dfrac{1}{2}x\right)\)
Note: Their answer to (b) may be seen in part (c) provided that they have not clearly attempted part (b) incorrectly, e.g., an attempt at \(\mathrm{f}^{-1}(x)\) in (b).
M1: For \(\tan\left(\dfrac{1}{2}x\right) \rightarrow \ldots\sec^2\left(\dfrac{1}{2}x\right)\) o.e. The brackets are not required. You may see attempts at the quotient rule but the method should be correct and they should reach something equivalent to \(\ldots\sec^2\left(\dfrac{1}{2}x\right)\).
e.g. \(\tan\left(\dfrac{1}{2}x\right) = \dfrac{\sin\left(\dfrac{1}{2}x\right)}{\cos\left(\dfrac{1}{2}x\right)} \rightarrow \dfrac{k\cos\left(\dfrac{1}{2}x\right)\cos\left(\dfrac{1}{2}x\right) - -k\sin\left(\dfrac{1}{2}x\right)\sin\left(\dfrac{1}{2}x\right)}{\cos^2\left(\dfrac{1}{2}x\right)}\) where \(k\) is a positive constant scores M1. If the formula is seen it must be correct.
A1: \(\{\mathrm{f}^{\prime}(x)=\}\ 1 + \dfrac{1}{2}\sec^2\left(\dfrac{1}{2}x\right)\) o.e. which may be unsimplified and apply isw.
The brackets are not required. There is no need for \(\mathrm{f}^{\prime}(x) =\) just look for the expression.
Note that \(\{\mathrm{f}^{\prime}(x)=\}\ \dfrac{3}{2} + \dfrac{1}{2}\tan^2\left(\dfrac{1}{2}x\right)\) is correct and appears occasionally.
\(\{\mathrm{f}^{\prime}(x)=\}\ 1 + \dfrac{1}{2}\sec\dfrac{1}{2}x^2\) is condoned for M1A0 only but \(1 + \dfrac{1}{2}\left(\sec\dfrac{1}{2}x\right)^2\) scores M1A1.
M1: Attempts \(3.7 - \dfrac{\mathrm{f}(3.7)}{\mathrm{f}^{\prime}(3.7)}\) and obtains a value following through on their \(\mathrm{f}^{\prime}(x)\) as long as it is a “changed” function in terms of \(x\).
Just stating \(3.7 - \dfrac{\mathrm{f}(3.7)}{\mathrm{f}^{\prime}(3.7)} = \ldots\) without evidence of use of 3.7 in \(\mathrm{f}(x)\) (note that this evidence might come from part (a)) and in their \(\mathrm{f}^{\prime}(x)\) is M0 unless implied by a correct value for both \(\mathrm{f}(x)\) and \(\mathrm{f}^{\prime}(x)\) or by their final answer. Must be a correct N-R formula used – you may need to check their values – accuracy of at least 3s.f. rounded or truncated required. Allow if attempted in degrees. For reference in degrees \(\mathrm{f}(3.7) = 3.73\ldots\) and \(\mathrm{f}^{\prime}(3.7) = 1.50\ldots\) and gives \(\alpha = 1.21\ldots\) Note that the full N-R accuracy is 3.672051617. For reference, the value of \(\alpha\) is approximately 3.673194406… and scores M0A0 without other valid work.
A1: For awrt 3.672 Ignore any subsequent iterations.
The point \(P\) on the curve which is closest to the point \(Q\) is shown on the diagram below.
(a) Show that the \(x\)-coordinate of \(P\) satisfies the equation\[2x^3 - 4x - 3 = 0\] [4 marks]
(b) The Newton–Raphson method is to be used to find an approximate solution to the equation\[2x^3 - 4x - 3 = 0\]Show that the Newton–Raphson method generates the iterative formula\[x_{n+1} = \frac{4x_n^3 + 3}{6x_n^2 - 4}\] [4 marks]
(c) Starting with \(x_0 = 3\), use the iterative formula given in part (b) to find the value of \(x_3\)
Give your answer to three decimal places.
[2 marks]
(d) Hence find the distance \(PQ\)
Give your answer to two decimal places.
[2 marks]
Mark scheme (a)
Scheme
Marks
AO
Obtains \(\pm\dfrac{1}{2x} = \dfrac{y - 2.5}{x - 3}\) or \(\pm 2x = \dfrac{y - 2.5}{x - 3}\) OE eg in the form of the equation of the straight line. Or Uses distance formula (may be in terms of \(x\) and \(y\)) \(\left(d^2 =\right)(x - 3)^2 + (y - 2.5)^2\)
M1
3.1a
Obtains \(-\dfrac{1}{2x} = \dfrac{y - 2.5}{x - 3}\) OE May have \(y\) replaced with \(x^2\) Or Obtains \((x - 3)^2 + \left(x^2 - 2.5\right)^2\)
Obtains \(6x^2 - 4\) May be explicit or seen as denominator in their \(\dfrac{2x_n^3 - 4x_n - 3}{6x_n^2 - 4}\)
B1
1.1b
Forms \(x_n - \dfrac{2x_n^3 - 4x_n - 3}{\text{Their ``}6x_n^2 - 4\text{''}}\) Condone missing or inconsistent subscripts FT their \(\mathrm{f}^{\prime}(x) = ax^2 - 4\) if stated explicitly
M1
1.1a
Obtains two correct fractions eg \(\dfrac{x_n\left(6x_n^2 - 4\right)}{6x_n^2 - 4} - \dfrac{2x_n^3 - 4x_n - 3}{6x_n^2 - 4}\) Or obtains a single correct fraction with five terms in the numerator Condone missing or inconsistent subscripts
A1
3.1a
Completes reasoned argument with a single correct fraction before obtaining \(x_{n+1} = \dfrac{4x_n^3 + 3}{6x_n^2 - 4}\) Condone missing or inconsistent subscripts but \(x_{n+1} = \dfrac{4x_n^3 + 3}{6x_n^2 - 4}\) must be stated. AG
(a) Describe a sequence of two transformations which maps the graph with equation\[y = \frac{1}{x}\]onto the graph with equation\[y = \frac{3}{x - 4}\] [2 marks]
(b) State the equation of the vertical asymptote of the graph with equation\[y = \frac{3}{x - 4}\] [1 mark]
(c) A student is attempting to use a change of sign to determine if the equation\[\frac{3}{x - 4} = x\]has a solution between 3 and 5
“Since there is no change of sign, there is no solution between 3 and 5”
Give two reasons why the student’s argument is invalid.
[2 marks]
Mark scheme (a)
Scheme
Marks
AO
States one of the following transformations A Stretch in the \(y\)-direction, scale factor of 3 or B translation \(\begin{bmatrix}4\\0\end{bmatrix}\) or C stretch in the \(x\)-direction, scale factor of 3 or D translation \(\begin{bmatrix}\frac{4}{3}\\0\end{bmatrix}\) Only accept vectors for translations Allow ‘parallel’ or ‘axis’ for direction of stretch
M1
3.1a
Describes the sequence of two transformations in the correct order A followed by B or B followed by A or C followed by B or D followed by C Only accept vectors for translations Allow ‘parallel’ or ‘axis’ for direction of stretch
A1
1.1b
(2)
Typical solution
Stretch in the \(y\)-direction by scale factor 3 and
followed by translation \(\begin{bmatrix}4\\0\end{bmatrix}\)
Mark scheme (b)
Scheme
Marks
AO
States \(x = 4\)
B1
1.1b
(1)
Typical solution
\[x = 4\]
Mark scheme (c)
Scheme
Marks
AO
Explains that there could be more than one solution between the two points (3 and 5)
E1
2.2b
Explains that the two points (3 and 5) are either side of the asymptote or explains that it is discontinuous between the two points (3 and 5)
E1
2.3
(2)
(5 marks)
Typical solution
There could be more than one solution between the two points.
6 The curve with equation \(y = \dfrac{\mathrm{e}^{\frac{x}{2}}}{x - 3}\) is shown in the diagram.
The region shaded is bounded by the curve, the \(x\)-axis, and the lines \(x = 4\) and \(x = 8\)
The trapezium rule with six ordinates (5 strips) is to be used to find an approximate value for the area of the shaded region.
Some of the values required to obtain this approximation are shown in the table below.
\(x\)
4
4.8
5.6
6.4
7.2
8
\(y\)
7.3891
6.1240
6.3249
8.7139
10.9196
(a)
(i) Find the \(y\)-value that is missing from the table. [1 mark]
(ii) Use the trapezium rule with six ordinates (5 strips) to find an approximate value for the area of the shaded region.
Give your answer to five significant figures.
[3 marks]
(b) A student finds an improved approximation for the area of the shaded region by using the trapezium rule with 11 ordinates.
The student correctly obtains 29.759 as their improved approximation.
The student claims that the exact area must be greater than 29.759
Without further calculation, explain whether or not the student is correct.
[2 marks]
Mark scheme (a)
Scheme
Marks
AO
(i) Obtains AWFW [7.2154, 7.2155] May be seen in the table
B1
1.1b
(1)
(ii) States or uses h = 0.8 OE
B1
1.1b
Substitutes all the given \(y\) values and their answer from 6(a)(i) to achieve \(7.3891 + 10.9196 + 2(6.124 + 6.3249 + 7.2155 + 8.7139)\) FT their 7.2155 PI 75.0653 Accept correct exact values or values to more than 4 decimal places. Condone omission of the bracket after 8.7139
16Figure 2 below shows a 1.5 metre length of pipe.
Figure 2
The symmetrical cross-section of the pipe is shown below, in Figure 3, where \(x\) and \(y\) are measured in centimetres.
Figure 3
Use the trapezium rule, with the values shown in the table below, to find the best estimate for the volume of the pipe.
\(x\)
0
0.4
0.8
1.2
1.6
2
\(y\)
\(-3\)
\(-2.943\)
\(-2.752\)
\(-2.353\)
\(-1.572\)
0
[5 marks]
Mark scheme
Scheme
Marks
AO
Uses the symmetry of the curve. Evidenced by doubling area from \(x\) = 0 to \(x\) = 2 Or considering the whole region from \(x = -2\) to \(x\) = 2
M1
3.1a
States or uses \(h\) = 0.4 OE Accept 0.2 as the multiplier. PI by 4.448 or 8.896 Accept use of \(h\)=0.8 or multiplier of 0.4 provided their answer is not then doubled.
B1
2.2a
Substitutes given y values or absolute y values to achieve \(3 + 0 + 2[2.943 + 2.752 + 2.353 + 1.572]\) or \(-3 + 0 + 2[-2.943 - 2.752 - 2.353 - 1.572]\) or \(0 + 0 + 2\begin{bmatrix} 2.943 + 2.752 + 2.353 + 1.572 \\ +3 + 2.943 + 2.752 + 2.353 + 1.572 \end{bmatrix}\) or \(0 + 0 + 2\begin{bmatrix} -2.943 - 2.752 - 2.353 - 1.572 \\ -3 - 2.943 - 2.752 - 2.353 - 1.572 \end{bmatrix}\) Condone missing or misplaced zeros PI by \(\pm 22.24\) or \(\pm 44.48\)
M1
1.1a
Obtains \(\pm 8.896\) or \(\pm 4.448\) Do not award this mark if they go on to obtain \(\pm 17.792\)
A1
1.1b
Obtains AWRT 1300cm3 Or AWRT 0.0013m3 Must include units
(a) The equation\[x^3 = \mathrm{e}^{6 - 2x}\]has a single solution, \(x = \alpha\)
By considering a suitable change of sign, show that \(\alpha\) lies between 0 and 4 [2 marks]
(b) Show that the equation \(x^3 = \mathrm{e}^{6 - 2x}\) can be rearranged to give\[x = 3 - \frac{3}{2}\ln x\] [3 marks]
(c)
(i) Use the iterative formula\[x_{n+1} = 3 - \frac{3}{2}\ln x_n\]with \(x_1 = 4\), to find \(x_2\), \(x_3\) and \(x_4\)
Give your answers to three decimal places. [2 marks]
(ii)Figure 1 below shows a sketch of parts of the graphs of\[y = 3 - \frac{3}{2}\ln x \text{ and } y = x\]On Figure 1, draw a staircase or cobweb diagram to show how convergence takes place.
Label, on the \(x\)-axis, the positions of \(x_2\), \(x_3\) and \(x_4\) [2 marks]
Figure 1
(iii) Explain why the iterative formula\[x_{n+1} = 3 - \frac{3}{2}\ln x_n\]fails to converge to \(\alpha\) when the starting value is \(x_1 = 0\) [1 mark]
Mark scheme (a)
Scheme
Marks
AO
Rearranges the given equation to equal zero and evaluates their non-zero expression in the interval [0,4] at least once. Must have equated to zero.
M1
1.1a
Completes argument with two correct evaluations of their correct expression in the interval [0,4] either side of the solution, with comparison to zero or a comment about change of sign.
AND concludes that the solution \(\alpha\) lies between 0 and 4
Evaluations must be correct to at least two significant figures rounded or truncated. Accept exact evaluation at \(x = 0\).
(i) Obtains any correct value to at least 3 decimal places, ignoring labels.
M1
1.1a
Obtains \(x_2\), \(x_3\) and \(x_4\) correct to at least 3 decimal places If no labels only accept the three correct answers in the correct order with no extras seen beyond \(x_4\) \(x_2 = 0.92055\ldots\) \(x_3 = 3.12416\ldots\) \(x_4 = 1.29125\ldots\)
A1
1.1b
(2)
(ii) Draws correct cobweb diagram Condone missing vertical line at \(x = 4\)
M1
1.1a
Shows positions of \(x_2\), \(x_3\) and \(x_4\) on the \(x\)-axis Accept correct values in place of \(x_n\) AWRT 0.92, 3.12 and 1.29 Do not accept labels on \(y = x\) without indication on \(x\)-axis
A1
1.1b
(2)
(iii) Explains that (it is not possible to evaluate \(x_2\) as) ln 0 has no value or that \(y\) is undefined OE
E1
2.4
(1)
(10 marks)
Typical solution
(i)
\[x_2 = 0.921\]\[x_3 = 3.124\]\[x_4 = 1.291\]
(ii)
(iii)
It is not possible to evaluate \(x_2\) as ln 0 has no value
\[\mathrm{f}(x) = \arccos x \quad \text{for } 0 \leqslant x \leqslant a\]
The curve with equation \(y = \mathrm{f}(x)\) is shown below.
(a) State the value of \(a\) [1 mark]
(b)
(i) On the diagram above, sketch the curve with equation\[y = \cos x \quad \text{for } 0 \leqslant x \leqslant \frac{\pi}{2}\]and
sketch the line with equation
\[y = x \quad \text{for } 0 \leqslant x \leqslant \frac{\pi}{2}\] [4 marks]
(ii) Explain why the solution to the equation\[x - \cos x = 0\]must also be a solution to the equation\[\cos x = \arccos x\] [1 mark]
(c) Use the Newton-Raphson method with \(x_0 = 0\) to find an approximate solution, \(x_3\), to the equation\[x - \cos x = 0\]Give your answer to four decimal places. [3 marks]
Mark scheme (a)
Scheme
Marks
AO
States 1
B1
1.2
(1)
Typical solution
1
Mark scheme (b)
Scheme
Marks
AO
(i) Draws a concave arc for \(0 \leqslant x \leqslant \dfrac{\pi}{2}\) Must intersect \(y\)-axis below \(\dfrac{\pi}{2}\) Condone dotted section
M1
1.1a
Labels the \(y\)-intercept of their concave arc 1 or \(a\).
A1
1.1b
Draws straight line through \(O\) at approximately \(45^\circ\) crossing the given curve \(y = \arccos x\)
M1
1.1b
Shows all three graphs intersecting at a common point with the maximum of the cosine graph in the correct position and \(y = x\) shown as a straight line through \(O\).
A1
2.2a
(4)
(ii) Explains that \(y = \cos x\) and \(y = \arccos x\) are reflections in \(y = x\) Accept \(y = x\) is a line of symmetry. Accept all three graphs meet at the same point. Or Starts with \(x = \cos x\) and obtains \(\arccos x = x\) Accept \(\cos^{-1} x\) for \(\arccos x\) throughout.
E1
2.4
(1)
Typical solution
(i)
(ii)
All three graphs intersect at the same point.
Mark scheme (c)
Scheme
Marks
AO
Obtains \(1 + \sin x\)
PI by \(x_2 = 0.75036\ldots\) AWRT 0.75
B1
1.1b
Obtains \(x_n - \dfrac{x_n - \cos x_n}{1 \pm \sin x_n}\) Ignore subscripts, condone ANS for \(x_n\) PI by \(x_2 = 0.75036\ldots\) AWRT 0.75
M1
1.1a
Obtains AWRT \(x_3 = 0.7391\) condone missing label provided this is their final answer. Must have scored M1.
and the \(x\)-axis is shaded in the diagram below.
(a) Use the trapezium rule with 5 ordinates to find an estimate for the area of the shaded region.
Give your answer correct to three significant figures. [3 marks]
(b) Show that the exact area is given by\[32\ln 2 - \frac{33}{2}\]
Fully justify your answer. [6 marks]
Mark scheme (a)
Scheme
Marks
AO
Finds positive or negative \(y\)-values for 5 \(x\)-values with \(h\) = 0.75 PI by AWRT 5.28 or AWRT \(-5.28\) or Uses 6 \(x\)-values and obtains AWRT 5.42 or AWRT \(-5.42\) In this case maximum mark is M1A0 A0
M1
1.1a
Uses the trapezium rule correctly with \(h\) = 0.75 and correct \(y\)-values Accept rounded or truncated values to 3 significant figures.
Sets up integration by parts Condone \(u\) and \(v^{\prime}\) in wrong order Must have expressions for \(u\), \(u^{\prime}\), \(v\) and \(v^{\prime}\) with evidence of some integration
M1
3.1a
Applies integration by parts correctly to \((2x - 8)\ln x\) to obtain either \((x^2 - 8x)\ln x - \int x - 8\,\mathrm{d}x\) OE or \(\dfrac{1}{4}(2x - 8)^2\ln x - \displaystyle\int x - 8 + \dfrac{16}{x}\,\mathrm{d}x\) Condone missing brackets or omission of \(\mathrm{d}x\)
M1
1.1a
Completes integration fully to obtain either \((x^2 - 8x)\ln x - \dfrac{x^2}{2} + 8x\) OE or \(\dfrac{1}{4}(2x - 8)^2\ln x - \dfrac{x^2}{2} + 8x - 16\ln x\) OE
A1
1.1b
Substitutes limits 1 and 4 into their integrated function and subtracts either way round
M1
1.1a
Completes reasoned argument to correctly obtain \(\dfrac{33}{2} - 32\ln 2\) or \(32\ln 2 - \dfrac{33}{2}\) AG Brackets must be correct throughout
R1
2.1
Explains change of sign due to shaded region being below \(x\)-axis This could be at an earlier stage eg swap limits explained but must still refer to the shaded region being below \(x\)-axis
10 The diagram shows a sector of a circle \(OAB\).
The point \(C\) lies on \(OB\) such that \(AC\) is perpendicular to \(OB\).
Angle \(AOB\) is \(\theta\) radians.
(a) Given the area of the triangle \(OAC\) is half the area of the sector \(OAB\), show that\[\theta = \sin 2\theta\] [4 marks]
(b) Use a suitable change of sign to show that a solution to the equation\[\theta = \sin 2\theta\]lies in the interval given by \(\theta \in \left[\dfrac{\pi}{5}, \dfrac{2\pi}{5}\right]\) [2 marks]
(c) The Newton-Raphson method is used to find an approximate solution to the equation\[\theta = \sin 2\theta\]
(i) Using \(\theta_1 = \dfrac{\pi}{5}\) as a first approximation for \(\theta\) apply the Newton-Raphson method twice to find the value of \(\theta_3\)
Give your answer to three decimal places. [3 marks]
(ii) Explain how a more accurate approximation for \(\theta\) can be found using the Newton-Raphson method. [1 mark]
(iii) Explain why using \(\theta_1 = \dfrac{\pi}{6}\) as a first approximation in the Newton-Raphson method does not lead to a solution for \(\theta\). [2 marks]
Mark scheme (a)
Scheme
Marks
AO
Recalls or uses the area of sector = \(\dfrac{1}{2}r^2\theta\) \(r\) can be any letter or \(OA\) or \(OB\) or any consistent value throughout
B1
1.2
Forms an equation relating the area of the triangle \(OAC\) and sector using \(\dfrac{1}{2}bh = k\dfrac{1}{2}r^2\theta\) where \(k \gt 0\)
M1
3.1a
Deduces area of triangle is \(\dfrac{1}{2}r\cos\theta \times r\sin\theta\) OE Must use trigonometry for height and base
B1
2.2a
Completes reasoned argument with clear use of double angle identity to show that \(\theta = \sin 2\theta\) or \(\sin 2\theta = \theta\)
Rearranges to obtain \(\theta - \sin 2\theta = 0\) or \(\sin 2\theta - \theta = 0\) (which may be seen in conclusion) and evaluates \(\theta - \sin 2\theta\) or \(\sin 2\theta - \theta\) at \(\dfrac{\pi}{5}\) (0.6284) and \(\dfrac{2\pi}{5}\) (1.257) Evaluates using any two other appropriate values inside the interval but either side of root.
M1
1.1a
Completes reasoned argument with reference to change of sign and evidence of correct evaluation accepting values rounded or truncated to 1 sf Must refer to \(\dfrac{\pi}{5}\) and \(\dfrac{2\pi}{5}\) in the conclusion
Hence solution lies between \(\dfrac{\pi}{5}\) and \(\dfrac{2\pi}{5}\)
Mark scheme (c)
Scheme
Marks
AO
(i) Differentiates \(\sin 2\theta\) to obtain \(2\cos 2\theta\) OE
PI by correct \(\theta_2\) or \(\theta_3\) PI by sight of \(2\cos\dfrac{2\pi}{5}\)
B1
1.1b
Obtains a correct expression for \(\theta_n - \dfrac{\theta_n - \sin 2\theta_n}{1 - 2\cos 2\theta_n}\) Accept use of ANS or \(\dfrac{\pi}{5}\) Condone missing or incorrect subscript PI by correct \(\theta_2\) or \(\theta_3\) AWRT \(\theta_2\) 1.473
(a) Use the substitution \(u = \cos x\) to show that \(\displaystyle\int \frac{1 + \cos x}{\sin x}\,\mathrm{d}x = \ln(1 - \cos x) + c\). [4]
Fig. 1
Fig. 1 shows part of the curve \(y = \dfrac{1 + \cos x}{\sin x}\).
The shaded region is bounded by the curve, the \(x\)-axis, and the line \(x = a\).
You are given that the area of the shaded region is \(a\) square units.
(b) Show that the value of \(a\) satisfies the equation \(a - \cos^{-1}\left(1 - 2\mathrm{e}^{-a}\right) = 0\). [4]
(c) Show by calculation that the value of \(a\) lies between 1.1 and 1.2. [2]
(d) Use the iterative formula \(a_{n+1} = \cos^{-1}\left(1 - 2\mathrm{e}^{-a_n}\right)\), with starting value \(a_1 = 1.2\), to find the value of \(a\) correct to 2 decimal places. Show the result of each step of the iterative process. [2]
Fig. 2
Fig. 2 shows the curve \(y = \cos^{-1}\left(1 - 2\mathrm{e}^{-x}\right)\).
(e) Explain why the gradient of the curve \(y = \cos^{-1}\left(1 - 2\mathrm{e}^{-x}\right)\) at the point where \(x = a\), where \(a\) is the value found in part (d), lies in the interval \((-1, 0)\). [2]
Mark scheme (a)
Scheme
Marks
AO
\(u = \cos x \Rightarrow \mathrm{d}u = -\sin x\,\mathrm{d}x\)
B1:B1 for \(\dfrac{\mathrm{d}u}{\mathrm{d}x} = -\sin x\) oe
M1*: Obtain an integral in terms of \(u\) only – must be of the form \(\displaystyle\pm\int \frac{\pm 1 \pm u}{\pm 1 \pm u^2}\,(\mathrm{d}u)\)
Allow \(\mathrm{d}u\) missing throughout but M0 if implying \(\mathrm{d}u = \mathrm{d}x\)
M1dep*:Explicit use of \(1 - u^2 = (1 + u)(1 - u)\) or \(u^2 - 1 = (u + 1)(u - 1)\) and simplify to an integral of the form \(\displaystyle\pm\int \frac{1}{\pm 1 \pm u}\,(\mathrm{d}u)\)
A1:AG www – condone \(\ln|1 - \cos x| + c\) Allow A1 for \(\displaystyle-\int \frac{1}{1 - u}\,\mathrm{d}u = \ln(1 - u) = \ln(1 - \cos x) + c\) (must see \(\ln(1 - u)\) as AG) However, \(\displaystyle\int \frac{1}{u - 1}\,\mathrm{d}u = \ln|\cos x - 1| = \ln(1 - \cos x) + c\) is A0 without further correct working or correct explanation/justification Note that \(\displaystyle\int \frac{1}{u - 1}\,\mathrm{d}u = \ln(\cos x - 1) = \ln(1 - \cos x) + c\) is A0 regardless of any further explanation/justification
\(+c\) must be present in the final given answer e.g. as a minimum \(\ln|\cos x - 1| = \ln|(-1)(1 - \cos x)| = \ln(1 - \cos x) + c\)
Mark scheme (b)
Scheme
Marks
AO
Curve intersects the \(x\)-axis at \(\pi\)
B1
3.1a
\(\left[\ln(1 - \cos x)\right]_a^{\pi} = a \Rightarrow \ln(1 - \cos\pi) - \ln(1 - \cos a) = a\)
\(1 - \cos a = 2\mathrm{e}^{-a} \Rightarrow \cos a = 1 - 2\mathrm{e}^{-a}\) so \(a = \cos^{-1}\left(1 - 2\mathrm{e}^{-a}\right)\) and therefore \(a - \cos^{-1}\left(1 - 2\mathrm{e}^{-a}\right) = 0\)
A1
2.1
[4]
Notes
B1: Possibly implied by later working – condone (use of) 180 (in degrees) or \(\cos^{-1}(-1)\) (so do not need to see this evaluated to \(\pi\))
e.g. as a limit on an integral
M1*: Correct use of their upper limit and correct lower limit to form an equation in \(a\) only so must be of the form \(\ln k - \ln(1 - \cos a) = a\) following through their value of \(k \gt 0\)
Setting equal to \(a^2\) rather than \(a\) is M0
M1dep*: Correct use of log laws and correctly remove natural log to form an equation in \(\mathrm{e}^a\) from \(\ln k - \ln(1 - \cos a) = a\) following through their \(k \gt 0\) and \(k \neq 1\)
A1:AG – sufficient working must be shown and must be \(= 0\)
allow arccos for \(\cos^{-1}\)
Mark scheme (c)
Scheme
Marks
AO
Let \(\mathrm{f}(a) = a - \cos^{-1}\left(1 - 2\mathrm{e}^{-a}\right)\) \(\mathrm{f}(1.1) = -0.129\ldots \lt 0\), \(\mathrm{f}(1.2) = 0.038\ldots \gt 0\)
M1
1.1
Change of sign indicates that \(a\) lies between 1.1 and 1.2
A1
2.4
[2]
Notes
M1: Obtain correct value for either f(1.1) or f(1.2) to at least 1 sf rot
A1: Both correct values to at least 1 sf rot, ‘change of sign’ either shown or stated + conclusion (minimum e.g. ‘root’)
Allow, for example,’ \(-0.1 \lt 0 \lt 0.03\) therefore \(1.1 \lt a \lt 1.2\)’ for A1
B1: At least the first three values of \(a_i\) stated correctly to at least 2 decimal places rot e.g. \(a_3 = 1.18\) or \(a_3 = 1.19\)
Ignore values after the first three
B1: cao (must be to exactly 2 decimal places) – final answer must be 1.18 or \(a = 1.18\) and not a term of a sequence e.g. \(a_9 = 1.18\)
Not dependent on the previous B1. A correct answer without the correct first three terms is B0 B1
Mark scheme (e)
Scheme
Marks
AO
The diagram shows that the gradient of all points on the curve \(y = \cos^{-1}\left(1 - 2\mathrm{e}^{-x}\right)\) are negative and therefore the gradient at \(a\) lies in the interval \((-\infty, 0)\)
B1
2.4
As the iterative formula in part (d) converged to the value of \(a\) this implies that \(\left|\dfrac{\mathrm{d}}{\mathrm{d}x}\left(\cos^{-1}\left(1 - 2\mathrm{e}^{-x}\right)\right)\Big|_{x = a}\right| \lt 1\) and so the gradient of the curve at the point \(x = a\) lies in the interval \((-1, 0)\).
B1
2.4
[2]
Notes
B1: Correct explanation that the graph or diagram or curve (in Fig. 2) implies that the gradient (either at \(a\) or implying all points) is negative.
Must mention ‘the graph’ oe for this mark but mention of Fig. 1 is B0
B1: Correct justification that as the iterative formula \(\left(a_{n+1} = \mathrm{F}(a_n)\right)\) converged to \(a \Rightarrow |\mathrm{F}^{\prime}(a)| \lt 1\). As a minimum must state/mention ‘convergence’ and EITHER that the gradient at \(a\) is between \(-1\) and 1 OR that the gradient at \(a\) is between \(-1\) and 0 but only following a correct explanation that the graph (oe) implies a negative gradient
Not \(\Rightarrow |\mathrm{F}^{\prime}(a_n)| \lt 1\). For both marks to be awarded the interval of (–1,0) must be mentioned
B2 for ‘graph shows negative gradient, and there is convergence, therefore the gradient at \(a\) lies in the interval (–1,0)’
Implying that \(a\) is between –1 and 1 and not the gradient is B0 for the second B mark
M1: Correct formula oe with \(\geqslant 4\) \(y\)-values correct or omitting the \(2 \times\) May see \(\frac{1}{2} \times 0.5 \times \{1.732\ldots + 2.645\ldots + 2(1.803\ldots + 2 + 2.291\ldots)\}\)
A1: All correct. May see \(\sqrt{\frac{13}{4}}\) and \(\sqrt{\frac{21}{4}}\) oe
A1: awrt 4.14 Answer only without working scores 0/3
Allow B1B1 for these values seen anywhere (e.g. may see lower/upper switched). Must be evaluated.
Mark scheme (b)
Scheme
Marks
AO
M1
1.2
\(\displaystyle\lim_{\delta x \to 0} \sum_{[x=]0}^{2} \left(\sqrt{x^2 + 3}\right)\delta x\)
A1
2.5
[2]
Notes
M1: M1 for a partial or incomplete expression, e.g. missing (0,2) \(\displaystyle\lim_{\delta x \to 0} \sum \left(\sqrt{x^2 + 3}\right)\delta x\). Allow any expression involving \(\lim\), \(\Sigma\), \(\sqrt{x^2 + 3}\) (or \(y\)) and \(\delta x\) for this mark.
4 The diagram shows part of the graph of \(y = x\mathrm{e}^{1-3x}\).
(a) Use the sign change method to determine, correct to 2 decimal places, the root of the equation \(x\mathrm{e}^{1-3x} - 0.2 = 0\), that lies between \(x = 0.5\) and \(x = 1\). [3]
(b) Determine the exact \(x\)-coordinate of the maximum point of the curve \(y = x\mathrm{e}^{1-3x}\). [3]
(c)In this question you must show detailed reasoning. Determine the exact area of the region enclosed by the curve \(y = x\mathrm{e}^{1-3x}\), the \(x\)-axis and the line \(x = 1\). [4]
Mark scheme (a)
Scheme
Marks
AO
\(x\mathrm{e}^{1-3x} - 0.2\) evaluated for any two values of \(x\) that give results with opposite signs.
M1
3.1a
\(x = 0.79\) (2dp)
B1
1.1
(\(x = 0.79\) to 2 dp) because the change of sign occurs between 0.785 and 0.795.
A1
2.2a
[3]
Notes
M1: Values of iterates not needed, i.e. condone \(\lt 0\) and \(\gt 0\) etc. but signs (and values if given) must be correct to 1sf – see table.
B1: cao (Allow this mark even with no/insufficient working).
A1: By showing two values between 0.785-0.795 with opposite signs Values of iterates not needed, i.e. condone \(\lt 0\) and \(\gt 0\) etc, but if given must be correct to 1sf e.g. \(x = 0.79 \Rightarrow y = 0.0007\) and \(x = 0.795 \Rightarrow y = -0.0009\)
\(\mathrm{e}^{1-3x}\) is never 0, hence can divide by it \(\left(\mathrm{e}^{1-3x}(1 - 3x) = 0\right)\) \((\rightarrow\ 1 - 3x = 0)\)
B1
2.1
\(x = \dfrac{1}{3}\)
A1
1.1
[3]
Notes
M1: For an attempt at differentiating using the product rule, with at least one term correct (their derivative must have two terms).
B1: May be implied by not giving a corresponding solution (provided another solution for \(x\) is reached). (NB this mark can be gained following M0 provided their derivative has \(\mathrm{e}^{1-3x}\) as a factor)
A1: Not decimal, www (i.e. must come from a correct derivative)
Mark scheme (c)
Scheme
Marks
AO
DR \(\displaystyle\int_0^1 x\mathrm{e}^{1-3x}\,\mathrm{d}x = \left[x\frac{\mathrm{e}^{1-3x}}{-3}\right]_0^1 - \int_0^1 \frac{\mathrm{e}^{1-3x}}{-3}\,\mathrm{d}x\) oe
\(= \dfrac{1}{9}\mathrm{e} - \dfrac{4}{9}\mathrm{e}^{-2}\) or \(\dfrac{\mathrm{e}^3 - 4}{9\mathrm{e}^2}\) oe
A1
1.1
[4]
Notes
M1: M1 for attempting integration by parts with at least one term correct, must see limits (condone swapped limits, may appear later). Must have two terms.
A1: A1 for both terms correct after 2nd integral performed
A1: Need not be simplified, isw any incorrect attempts to simplify
The diagram shows part of the curve \(y = x^2\mathrm{e}^{-x}\).
(a) Use the trapezium rule with 4 intervals of equal width to find an estimate for \(\displaystyle\int_0^2 x^2\mathrm{e}^{-x}\,\mathrm{d}x\). Give your answer correct to 3 significant figures. [4]
(b) Explain how the trapezium rule could be used to obtain a more accurate estimate for \(\displaystyle\int_0^2 x^2\mathrm{e}^{-x}\,\mathrm{d}x\). [1]
(c) Explain why it is not clear from the diagram whether the value from part (a) is an under-estimate or an over-estimate for \(\displaystyle\int_0^2 x^2\mathrm{e}^{-x}\,\mathrm{d}x\). [2]
Attempt to find area between \(x = 0\) and \(x = 2\), using \(k\{y_0 + y_n + 2(y_1 + \ldots + y_{n-1})\}\)
M1*
1.1a
Use \(k = 0.5 \times 0.5\) soi
M1d*
1.1a
\(= 0.646\)
A1
1.1
[4]
Notes
B1: State the 4 correct non-zero \(y\)-values and no others. Exact values (including unsimplified) or decimal equivs (0, 0.1516, 0.3679, 0.5020, 0.5413), which could be truncated or rounded. For the first value, if \(0\mathrm{e}^0 = 1\) is seen then allow credit for the unsimplified value; if however it is only ever seen as 1 then this is B0 but M1M1 could still be awarded. B0 if other ordinates seen, unless clearly not intended to be used.
M1*: Big brackets need to be seen or implied. Attempts at \(y\)-values must be correctly placed (but no need to see \(y = 0\) explicitly). If no earlier evidence of \(y\)-values seen (eg in a table) then allow M1 for the correct structure with 4 of the 5 values being correct. Condone using more than 4 intervals as long as values equally spaced between \(x = 0\) and \(x = 2\).
M1d*: Dep on previous M1. Or using \(k = 0.5h\), with \(h\) consistent with their different number of intervals.
A1: Obtain 0.646. Allow answers > 3sf, as long as they round to 0.646. A0 if not using 4 strips, even if 0.646 is obtained. No credit if no evidence of using the trapezium rule shown.
Using separate strips (a triangle and then trapezia) is an acceptable method, and marks should be awarded as per the main MS (ie \(y\)-values / structure / widths / final answer).
Mark scheme (b)
Scheme
Marks
AO
Use more trapezia, of a lesser width, over the same interval
B1
2.4
[1]
Notes
B1: Convincing reason. Allow just ‘more trapezia’ or ‘narrower trapezia’. Could refer to strips or intervals.
Mark scheme (c)
Scheme
Marks
AO
E.g. There is a point of inflection within the given range…
B1
2.4
… so the trapezia initially over-estimate but then under-estimate
B1
2.2a
[2]
Notes
B1: Curve is both convex and concave. Comment about the shape Referring to increasing and decreasing gradients is correct, but increasing and decreasing curve is not. Allow BOD if muddles about which part of the curve is convex and which is concave.
B1: The tops of trapezia are both above and below the curve. Comment about the estimates If candidates refer to ‘it’ rather than ‘trapezia’ then allow BOD.
B marks are independent. See appendix for further examples (below).
Appendix: exemplar responses for Q1(c)
Response
Mark
Comment
The graph is both convex & concave in the range. Therefore, the trapezia do not strictly all lie under or over the graph.
B1 B1
At the beginning the graph is convex and then concave, therefore some of the trapezia are overestimating and some underestimating.
B1 B1
Condone if the order of convex and concave becomes muddled.
Part of the graph is concave, and part of the graph is convex and so you cannot tell as some of the over/underestimates would cancel out.
B1 B1BOD
Comment about curve is sufficient. BOD for some recognition that this is leading to both over and underestimates within the range.
The concavity of the function changes in the range 0 to 2
B1 B0
Acceptable first comment about the shape. No comment about the estimate.
Because the gradient increases and decreases, so can’t tell if under or overestimate.
B1 B0
The first comment is acceptable as it describes the nature of the curve in the range. No reason why it may be both an overestimate and underestimate.
As the trapezia lines go both over the curve and under the curve, there are parts which are overestimating and parts which are underestimating.
B0 B1
No comment about the shape of the curve.
When concave it is an underestimate, when convex it is an overestimate.
B0 B1 BOD
No specific comment about the shape of this curve. Allow BOD for the statement about the nature of the estimate.
The trapezia will both go over and under the curve, given its shape so hard to tell if over or underestimate,
B0 B1
No details about the nature of ‘its shape’. Second comment is fine.
At the beginning the curve is curving upwards so it will be an overestimate and later curve is curving downwards so will be an underestimate.
B0 B1
‘Curving downwards’ is too vague. Second comment is fine.
Because the rectangles go over and under the curve.
B0 B0
No comment made about the shape of the graph. ‘Rectangles’ not acceptable as it is the Trapezium Rule.
The diagram has an unequal slope so can’t tell if over or underestimate.
B0 B0
Comment about shape not sufficient. Comment about estimate is not sufficient.
The diagram shows part of the curve \(\mathrm{f}(x) = \dfrac{\mathrm{e}^x}{4x^2 - 1} + 2\). The equation \(\mathrm{f}(x) = 0\) has a positive root \(\alpha\) close to \(x = 0.3\).
(a) Explain why using the sign change method with \(x = 0\) and \(x = 1\) will fail to locate \(\alpha\). [1]
(b) Show that the equation \(\mathrm{f}(x) = 0\) can be written as \(x = \dfrac{1}{4}\sqrt{\left(4 - 2\mathrm{e}^x\right)}\). [2]
(c) Use the iterative formula \(x_{n+1} = \dfrac{1}{4}\sqrt{\left(4 - 2\mathrm{e}^{x_n}\right)}\) with a starting value of \(x_1 = 0.3\) to find the value of \(\alpha\) correct to 4 significant figures, showing the result of each iteration. [3]
(d) An alternative iterative formula is \(x_{n+1} = \mathrm{F}(x_n)\), where \(\mathrm{F}(x_n) = \ln\left(2 - 8x_n^{\,2}\right)\). By considering \(\mathrm{F}'(0.3)\) explain why this iterative formula will not find \(\alpha\). [3]
Mark scheme (a)
Scheme
Marks
AO
Both \(\mathrm{f}(0)\) and \(\mathrm{f}(1)\) are positive so no sign change will be seen
B1
2.3
[1]
Notes
B1: Identify both \(y\)-values being positive and state ‘no sign change’ or equiv Could also evaluate \(\mathrm{f}(0)\) as 1 and \(\mathrm{f}(1)\) as 2.9 (or better), and refer to no sign change – these are both positive so no need to include \(\gt 0\) Could also refer to the asymptote / discontinuity within this range (\(x = 0\) to \(x = 1\)) Also allow ‘graph is not continuous in this interval’ B0 for no reference to interval Could say that the two points chosen are not on the same part of the curve
M1: Attempt rearrangement, as far as \(kx^2 = \ldots\) Allow sign error(s) only
A1: Obtain given answer convincingly If \(x = \sqrt{\dfrac{1}{4} - \dfrac{1}{8}\mathrm{e}^x}\) then an additional line of working needed before given answer (eg show common denominator of 16)
B1: Correct first iterate (at least 4sf) State 0.2851 or better
M1: Correct iterative process (at least 3 more values) Allow M1 for 3sf – expect 0.289, 0.288 and then 0.288 or 0.289 depending whether truncating or rounding
A1: Correct root, given to 4sf, following 2 iterates that agree to 4sf ie at least 7 iterations needed, given to at least 4sf A0 for eg \(x_8 = 0.2885\) (implies 8th iterate and not root) Process self corrects so B0M1A1 possible; or B1M1A1 if error in term other than \(x_2\)
Mark scheme (d)
Scheme
Marks
AO
\(\mathrm{F}'(x) = \dfrac{-16x}{2 - 8x^2}\)
M1
1.1a
\(\mathrm{F}'(0.3) = -3.75\)
M1
1.1
For convergence \(|\mathrm{F}'(\alpha)| \lt 1\), but \(-3.75 \lt -1\), so iteration will not find root
A1
2.5
[3]
Notes
M1: Attempt differentiation using the chain rule Obtain derivative of form \(\dfrac{kx}{2 - 8x^2}\) Condone subscripts still present in derivative
M1: Attempt \(\mathrm{F}'(0.3)\) – not dependent on previous M1, but must follow some attempt at differentiation M1 can be implied by correct \(-3.75\) (from correct derivative), but explicit substitution must be seen if \(\mathrm{F}'(x)\) is incorrect Must come from differentiating \(\mathrm{F}(x)\) and not a different function
A1: Correct reasoning, following correct \(\mathrm{F}'(0.3)\) Allow \(\mathrm{F}'(\alpha) \lt -1\), hence will not converge Condone \(\mathrm{F}'(x)\) not \(\mathrm{F}'(\alpha)\) No credit for just testing the given iterative formula
7 A car \(C\) is moving horizontally in a straight line with velocity \(v\,\mathrm{m\,s^{-1}}\) at time \(t\) seconds, where \(v \gt 0\) and \(t \geqslant 0\). The acceleration, \(a\,\mathrm{m\,s^{-2}}\), of \(C\) is modelled by the equation
(a)In this question you must show detailed reasoning. Find the times when the acceleration of \(C\) is zero. [3]
At \(t = 0\) the velocity of \(C\) is \(17.5\,\mathrm{m\,s^{-1}}\) and at \(t = T\) the velocity of \(C\) is \(5\,\mathrm{m\,s^{-1}}\).
(b) By setting up and solving a differential equation, show that \(T\) satisfies the equation \(T = 2\ln\left(\dfrac{7 + 4T^2}{2}\right).\) [6]
(c) Use an iterative formula, based on the equation in part (b), to find the value of \(T\), giving your answer correct to 4 significant figures. Use an initial value of 11.25 and show the result of each step of the iteration process. [2]
(d) The diagram below shows the velocity-time graph for the motion of \(C\). Find the time taken for \(C\) to decelerate from travelling at its maximum speed until it is travelling at \(5\,\mathrm{m\,s^{-1}}\). [1]
M1*: Setting equation for \(a\) equal to zero and removing \(t^2\) correctly from the denominator e.g. \(8t - \frac{1}{2}(7 + 4t^2) = 0\) to obtain the equivalent of a 3TQ in \(t\) only This mark can be implied by a correct 3TQ in \(t\)
M1dep*: Correct method for solving their 3TQ in \(t\) If factorising: \(at^2 + bt + c \Rightarrow (mt + n)(pt + q)\) where \(a = mp\) and one of \(mq + np = b\) or \(c = nq\) so note that \(4t^2 - 16t + 7 = (t - 0.5)(t - 3.5)\) is M0 but e.g. \((-2t + 7)(2t - 1)\) is M1 bod If using the formula: must apply the correct formula for their three-term quadratic in \(t\) (no errors) If completing the square: The M mark is not awarded until correctly getting to the stage \(t - 2 = \pm\sqrt{\dfrac{9}{4}}\) for their 3TQ in \(t\) (must include \(\pm\) so implying two roots) with no errors (so consistent with applying the formula correctly) Must see the method – the correct answers do not imply this mark therefore \(4t^2 - 16t + 7 = 0 \Rightarrow t = 0.5\) and 3.5 scores M1 M0 B1 As a minimum must see (if correct) \(\dfrac{16 \pm \sqrt{144}}{8}\)
B1: This mark is not dependent on the previous M mark(s) So M1 M0 B1 is common or M0 M0 B1 if no working seen
B1*: Stating the correct differential equation Possibly implied by correct separation of variables
B1dep*: Correct lhs
B1dep*: Correct rhs – not multiplied by \(v\) or 5 (or any other constant) Condone lack of \(+c\) for both B marks
M1*: Uses correct initial conditions to find \(c\) from an equation of the form \(k_1\ln v = k_2\ln(7 + 4t^2) + k_3t + c\) (note that e.g. \(+\,c\) may appear on the lhs) With non-zero values of \(k_i\) - accept any equivalent form e.g. \(v = A(7 + 4t^2)\mathrm{e}^{-0.5t}\) and then use initial conditions to find \(A\) (if correct then \(A = 2.5\))
M1dep*: Uses \(t = T\), \(v = 5\) to obtain an equation in \(T\) only – dependent on previous M mark Condone use of \(t\) for \(T\) throughout the remainder of the question
A1:AG so at least one step of intermediate working from substitution of \(t = T\) and \(v = 5\) Condone \(T = 2\ln\left|\dfrac{7 + 4T^2}{2}\right|\)
B1: Uses given result and given starting value to obtain correct \(T_1\) and \(T_2\) (so the first two iterations after the initial value of 11.25) to at least 4 sf (rot) – but all stated values in these two terms must be correct
B1: Must be stated to 4 sf only – not dependent on the first B mark – can be awarded if either of \(T_2\) and/or \(T_3\) incorrect (assume that the iterative process corrected itself or a slip in the candidate writing down an earlier value) Must be clear that \(T\) is 11.01 (and not the final term shown in the iterative process) – this mark can be awarded from using alternative iterative methods e.g. Newton-Raphson
Mark scheme (d)
Scheme
Marks
AO
\(11.01 - 3.5 = 7.51\) (s)
B1
2.2a
[1]
Notes
B1: awrt 7.51 No follow through from incorrect earlier values
The diagram shows a sector \(OAB\) of a circle with centre \(O\) and radius \(OA\). The angle \(AOB\) is \(\theta\) radians. \(M\) is the mid-point of \(OA\). The ratio of areas \(OMB : MAB\) is 2:3.
(a) Show that \(\theta = 1.25\sin\theta\). [4]
The equation \(\theta = 1.25\sin\theta\) has only one root for \(\theta \gt 0\).
(b) This root can be found by using the iterative formula \(\theta_{n+1} = 1.25\sin\theta_n\) with a starting value of \(\theta_1 = 0.5\).
Write down the values of \(\theta_2\), \(\theta_3\) and \(\theta_4\).
Hence find the value of this root correct to 3 significant figures. [3]
(c) The diagram in the Printed Answer Booklet shows the graph of \(y = 1.25\sin\theta\), for \(0 \leqslant \theta \leqslant \pi\).
Use this diagram to show how the iterative process used in (b) converges to this root.
State the type of convergence. [3]
(d) Draw a suitable diagram to show why using an iterative process with the formula \(\theta_{n+1} = \sin^{-1}(0.8\theta_n)\) does not converge to the root found in (b). [2]
Mark scheme (a)
Scheme
Marks
AO
area \(OMB = \tfrac{1}{2}\left(\tfrac{1}{2}r\right)r\sin\theta\)
B1
1.1
\(2\left(\tfrac{1}{2}r^2\theta - \tfrac{1}{4}r^2\sin\theta\right) = 3\left(\tfrac{1}{4}r^2\sin\theta\right)\) OR \(2\left(\tfrac{1}{2}r^2\theta\right) = 5\left(\tfrac{1}{4}r^2\sin\theta\right)\) OR \(3\left(\tfrac{1}{2}r^2\theta\right) = 5\left(\tfrac{1}{2}r^2\theta - \tfrac{1}{4}r^2\sin\theta\right)\)
M1
3.1a
Correct equation, in two variables (ie \(\theta\) and their \(r\))
B1: Correct (possibly unsimplified) area of \(OMB\) Could use other than \(r\) for the radius Could set their variable equal to \(OM\), giving a radius that is double this eg \(OM = x\) so area \(= x^2\sin\theta\)
M1: Attempt to use ratio on two correct areas Using two of \(OMB\) \(\left(\tfrac{1}{4}r^2\sin\theta\right)\), \(MAB\) \(\left(\tfrac{1}{2}r^2\theta - \tfrac{1}{4}r^2\sin\theta\right)\) and \(OAB\) \(\left(\tfrac{1}{2}r^2\theta\right)\) oe with their variable Must be two correct areas Must be using the correct ratio for their two areas ie 2:3 if using \(OMB\) and \(MAB\), 2:5 if using \(OMB\) and \(OAB\) or 3:5 if using \(MAB\) and \(OAB\) Allow ratio to be used the wrong way around eg \(2OMB = 3MAB\)
A1: Any correct statement linking the two areas Could use other than \(r\) for the radius Or \(2x^2\theta - x^2\sin\theta\)
A1: Simplify to given answer At least one line of working once ratio used
Mark scheme (b)
Scheme
Marks
AO
0.599
B1
1.1a
0.705, 0.810
M1
1.1a
root \(= 1.13\)
A1
1.1
[3]
Notes
B1: Obtain correct first iterate 3sf or better – more accurate answer is 0.599281923... Condone truncating if more sig fig given
M1: Attempt correct iterative process to find at least 2 more values M1 is for the correct process for finding \(\theta_3\) and \(\theta_4\), but these may be incorrect M0 if working in degrees
A1: Obtain 1.13 Possibly following B0 if first iterate is wrong but process then self corrects Must follow M1 ie a clear attempt to use the correct iterative process Must be 3sf Once M1 is awarded, allow A1 for 1.13 even if an incorrect iterate seen, as process will recover
Mark scheme (c)
Scheme
Marks
AO
Draw \(y = \theta\) on diagram
B1*
3.1a
Draw correct iterative process on diagram
B1dep*
2.1
State ‘staircase’ convergence
B1
1.2
[3]
Notes
B1*: Draw straight line, starting at the origin which intersects the graph Allow point of intersection to be greater than \(\theta = \frac{1}{2}\pi\) Ignore incorrect labels, such as \(y = x\)
B1dep*: Vertically into the curve, then horizontally into the straight line, as far as the root Initial value should be before root Needs point of intersection to be before \(\theta = \frac{1}{2}\pi\)
B1: Mark independently from other parts of question, including an incorrect diagram, as staircase can be deduced from the iterates in (b)
Mark scheme (d)
Scheme
Marks
AO
Draw graph of \(y = \sin^{-1}0.8\theta\), for \(\theta \geqslant 0\)
B1*
3.1a
Draw \(y = \theta\), and show staircase divergence from the root found in (b), on at least one side of the root
B1dep*
3.2a
[2]
Notes
B1*: Just need correct shape for \(y = \sin^{-1}k\theta\) graph – a one to one function that starts at the origin (ignore any \(\theta \lt 0\)) and has increasing gradient for all \(\theta\)
B1dep*: Straight line from the origin to intersect their graph Diagram is sufficient for B1 – no comment or explanation required
M1*: Attempt use of quotient rule or equivalent (e.g. product rule). Condone one incorrect term only (of the five terms) but must be subtraction in the numerator (but allow subtraction the wrong way round); condone absence of brackets; no denominator (if using quotient rule) is M0 By the five terms we mean the four in the numerator and the fifth is the term in the denominator
A1: cao must include brackets as necessary Any correct equivalent form
M1dep*: Sets their derivative (in any form) equal to 2 (M0 if equating to normal gradient) May equate at any stage (even after incorrect manipulation of their derivative)
M1: Multiply both sides by \((4x^2 + 1)^2\) and simplify (so combining like terms) to obtain a quartic equation (must be expanded with at least three terms – condone lack of = 0 if all terms on the same side) – allow sign errors/minor slips but the expansion of \((4x^2 + 1)^2\) must be three terms of the form \(16x^4 + ax^2 + 1\) where \(a = \pm 4, \pm 8\) Dependent on both previous M marks
A1:AG with explicit rejection of \(x = 0\) – as a minimum must indicate that \(x\) cannot equal 0 Just cancelling \(x\) is A0
Mark scheme (b)
Scheme
Marks
AO
DR Consider both \(\mathrm{f}(0.5)\) and \(\mathrm{f}(1)\) Where \(\mathrm{f}(x) = \pm(4x^3 + 3x - 3)\)
M1
1.1
\(\mathrm{f}(0.5) = -1 \lt 0\) and \(\mathrm{f}(1) = 4 \gt 0\) (or \(\mathrm{f}(0.5) = 1 \gt 0\) and \(\mathrm{f}(1) = -4 \lt 0\)) Change of sign indicates that the \(x\)-coordinate lies between 0.5 and 1
A1
2.4
[2]
Notes
M1: Working or correct answer for one value is sufficient evidence of correct method but both 0.5 and 1 must be seen Just stating that \(\mathrm{f}(0.5) \lt 0\) and \(\mathrm{f}(1) \gt 0\) is M0
A1: Correct values together with explanation (change of sign) and correct conclusion (as a minimum ‘root’ oe)
Alternative
Scheme
Marks
Considers both \(\mathrm{g}(0.5)\) and \(\mathrm{g}(1)\) where \(\mathrm{g}(x) = \dfrac{(4x^2 + 1)(2) - (2x - 3)(8x)}{(4x^2 + 1)^2}\)
M1
\(\mathrm{g}(0.5) = 3 \gt 2\) and \(\mathrm{g}(1) = 0.72 \lt 2\) Values either side of 2 indicates that the \(x\)-coordinate lies between 0.5 and 1
A1
M1: Must be using the correct derivative. Working or correct answer for one value is sufficient evidence of correct method but both 0.5 and 1 must be seen Just stating that \(\mathrm{g}(0.5) \gt 2\) and \(\mathrm{g}(1) \lt 2\) is M0
A1: Correct values together with explanation (values either side of 2) and correct conclusion (as a minimum ‘root’ oe)
Mark scheme (c)
Scheme
Marks
AO
DR Let \(\mathrm{h}(x) = \dfrac{3 - 4x^3}{3} \Rightarrow \mathrm{h}'(x) = -4x^2\)
B1*
2.1
As the root \(\alpha\) lies in the interval \((0.5, 1) \Rightarrow \mathrm{h}'(\alpha) \lt -1\) so iterative formula cannot converge to the \(x\)-coordinate of \(P\)
B1dep*
2.2a
[2]
Notes
B1*: Calculates correct derivative of rhs of given iterative formula
B1dep*: Correct explanation that any value in the given interval gives a gradient which is less than \(-1\) No marks for just showing that the iteration doesn’t converge using different starting values
\(x_0 = 0.5\), \(x_1 = \frac{2}{3}\) or 0.666666…, \(x_2 = \frac{29}{45}\) or 0.644444…, \((x_3 = 0.64395510\ldots)\)
A1
1.1
\(x\) coordinate of \(P\) is 0.64395
A1
2.2a
\(y\) coordinate of \(P\) is \(-0.64395\)
B1
1.1
[5]
Notes
B1: Correct derivative (possibly seen in N-R formula) Condone \(x\) for \(x_n\) oe
M1: Correct N-R formula seen with correct \(\mathrm{f}(x_n)\) and their \(\mathrm{f}'(x_n)\) substituted Condone \(x\) for \(x_n\) oe
A1: First two iterations correctly stated to at least 5 decimal places (or exact) (truncated or rounded) The correct first two iterations can imply B1 M1
A1: Independent of previous A mark (but must have scored B1 M1) – must be stated to exactly 5 decimal places This A mark does not imply the previous A mark
B1: Independent of all previous marks – must be stated to exactly 5 decimal places The correct answers with no evidence of N-R (e.g. no iterations stated and no N-R formula) then B0M0A0A0B1 max.
The diagram shows part of the curve \(y = \sqrt{x^2 - 1}\).
(a) Use the trapezium rule with 4 intervals to find an estimate for \(\displaystyle\int_1^3 \sqrt{x^2 - 1}\,\mathrm{d}x\). Give your answer correct to 3 significant figures. [4]
(b) State whether the value from part (a) is an under-estimate or an over-estimate, giving a reason for your answer. [1]
(c) Explain how the trapezium rule could be used to obtain a more accurate estimate. [1]
Attempt to find area between \(x = 1\) and \(x = 3\), using \(k\{y_0 + y_n + 2(y_1 + \ldots + y_{n-1})\}\)
M1*
1.1a
Use \(k = 0.5 \times 0.5\) soi
M1d*
1.1a
\(= 3.28\)
A1
1.1
[4]
Notes
B1: State the 4 correct non-zero \(y\)-values and no others. Exact values (including unsimplified) or decimal equivs (0, 1.12, 1.73, 2.29, 2.83) – 3sf or better B0 if other ordinates seen unless clearly not intended to be used
M1*: Big brackets need to be seen or implied \(y\)-values must be correctly placed Must be using attempts for at least 4 \(y\)-values (but no need to see \(y = 0\) explicitly) Condone using other than 4 intervals as long as values equally spaced between \(x = 1\) and \(x = 3\)
M1d*: Dep on previous M1 Or using \(k = 0.5h\), \(h\) consistent with their different number of intervals
A1: Obtain 3.28, or better Allow answers to > 3sf, as long as they round to 3.28
Mark scheme (b)
Scheme
Marks
AO
Under-estimate, as the tops of the trapezia are below the curve
B1
3.2b
[1]
Notes
B1: Under-estimate, with any valid explanation Condone just ‘trapezia under curve’ Or curve is concave / decreasing gradient (not decreasing function) Accept explanation on diagrams Allow comparing to true value (3.36) B0 if any additional incorrect or contradictory statements
Mark scheme (c)
Scheme
Marks
AO
Use more trapezia, of a lesser width, between the same limits
B1
3.2b
[1]
Notes
B1: Convincing reason Condone just ‘more trapezia’ or ‘narrower trapezia’ Could refer to strips or intervals
7 The curve \(y = (x^2 - 2)\ln x\) has one stationary point which is close to \(x = 1\).
(a) Show that the \(x\)-coordinate of this stationary point satisfies the equation \(2x^2\ln x + x^2 - 2 = 0\). [2]
(b) Show that the Newton-Raphson iterative formula for finding the root of the equation in part (a) can be written in the form \(x_{n+1} = \dfrac{2x_n^2\ln x_n + 3x_n^2 + 2}{4x_n(\ln x_n + 1)}\). [4]
(c) Apply the Newton-Raphson formula with initial value \(x_1 = 1\) to find \(x_2\) and \(x_3\). [1]
(d) Find the coordinates of this stationary point, giving each coordinate correct to 3 decimal places. [2]
Mark scheme (a)
Scheme
Marks
AO
\(2x\ln x + \dfrac{x^2 - 2}{x}\)
M1
3.1a
\(2x\ln x + \dfrac{x^2 - 2}{x} = 0\) \(2x^2\ln x + x^2 - 2 = 0\) A.G.
A1
1.1
[2]
Notes
M1: Attempt differentiation using product rule May expand first to give \(2x\ln x + \dfrac{x^2}{x} - \dfrac{2}{x}\) (allow middle term as just \(x\))
A1: Equate to 0 and obtain given answer Must be equated to 0 before clearing the fractions Must be equation ie … = 0
Mark scheme (b)
Scheme
Marks
AO
\(\mathrm{f}'(x) = 4x\ln x + 2x^2 . \frac{1}{x} + 2x\)
B1: Correct derivative seen Allow simplified middle term of \(2x\)
M1: Use correct Newton-Raphson formula, with numerator correct and their derivative in the denominator Allow fractional term without subscripts SC Condone use of N-R on \((x^2 - 2)\ln x\)
M1: Attempt rearrangement into single fraction with brackets expanded Allow without subscripts N-R not necessarily correct, but must be recognisable attempt SC Rearrange their N-R on \((x^2 - 2)\ln x\)
A1: Obtain given answer, with no errors seen Subscripts needed on RHS at least one step before AG LHS needs \(x_{n+1}\) seen
Mark scheme (c)
Scheme
Marks
AO
\(x_2 = 1.25\), \(x_3 = 1.2075\)
B1
1.1
[1]
Notes
B1: Condone 1.21, or better, for \(x_3\) \(x_3 = 1.207515437\ldots\)
M1: Uses their iterative formula with correct starting value to produce terms up to at least \(x_2\) to at least 4 significant figures Allow degrees for M1 only: For reference: \(x_1 = 0.5003636\ldots\) \(x_2 = 0.5003641\ldots\) \(x_3 = 0.5003641\ldots\)
A1: Must be stated to exactly 4 significant figures
2 The diagram shows part of the graph of \(y = \mathrm{f}(x)\), where \(\mathrm{f}(x)\) is a cubic polynomial in \(x\).
Explain why one of the roots of the equation \(\mathrm{f}(x) = 0\) cannot be found by the sign change method. [2]
Mark scheme
Scheme
Marks
\(\mathrm{f}(x)\) is positive on both sides of the 1st root oe Curve does not cross the \(x\)-axis (near root) Sign does not change (near the root) No negative value (near the root)
B2
[2]
Notes
B1 for "The graph touches the \(x\)-axis" or “repeated root” or “It is a stationary point”
B1: Correct derivative of \(\mathrm{e}^{x^2}\) seen
M1: Uses quotient rule with their \(\frac{\mathrm{d}u}{\mathrm{d}x}\) and \(\frac{\mathrm{d}v}{\mathrm{d}x}\) oe
A1: Fully correct. Any form
Also allow use of the product rule with \((x+1)^{-1}\) giving \(\dfrac{\mathrm{d}y}{\mathrm{d}x} = \dfrac{2x\mathrm{e}^{x^2}}{x+1} - \dfrac{\mathrm{e}^{x^2}}{(x+1)^2}\)
Mark scheme (b)
Scheme
Marks
AO
Negative when \(2x^2 + 2x - 1 \lt 0\) as the denominator and \(\mathrm{e}^{x^2}\) are always positive
M1
2.1
B1
1.1a
So \(-1 \lt x \lt \dfrac{-1+\sqrt{3}}{2}\)
A1
2.5
[3]
Notes
M1: Simplifies the problem to a quadratic inequality FT their \(\frac{\mathrm{d}y}{\mathrm{d}x}\) Also allow for algebraic attempt to find the stationary point if used to define a range of values Allow if their \(\frac{\mathrm{d}y}{\mathrm{d}x}\) leads to linear or cubic inequality
B1: \(\dfrac{-1+\sqrt{3}}{2}\) or 0.366 seen
A1: oe \(-1 \lt x \lt 0.366\ldots\) Do not allow for \(\leqslant\) used in final answer
Area \(\approx \frac{1}{2}\times 0.25\times 7.78014\ldots\)
B1
1.1
\(= 0.9725\ldots\)
A1
1.1
[3]
Notes
M1: Uses 5 values in an attempt to find the total for trapezium rule with correct \(x\)-values soi Also allow for the total area of four trapeziums attempted See table below for values
B1: \(\frac{h}{2} = \frac{0.25}{2}\) or 0.125 soi
x
0
0.25
0.5
0.75
1
f(x)
1
0.851596
0.856017
1.002888
1.359141
contribution
1
1.703191
1.712034
2.005777
1.359141
Mark scheme (d)
Scheme
Marks
AO
Trapezium rule gives an over-estimate because the curve is concave upwards (or convex downwards, or gradient increasing)
B1
2.4
[1]
Notes
B1: Also allow an explanation that involves extra area under the line that is not in the region. Condone incorrect description of the curve, if the explanation of additional area is clear. See appendix Allow for comparing exact value of area found BC to their estimate and stating over-estimate
Appendix: exemplar responses for Q10(d)
Response
Mark
Overestimate because the curve is convex/concave
B0
Overestimate because the trapeziums would go over the curve line
B1
Overestimate because there are gaps between the trapeziums and the graph
6 The diagram shows the curve with equation \(y = \mathrm{f}(x)\), where \(\mathrm{f}(x) = 13x - 34\ln(x) - 1.5\) for \(x > 0\).
(a) A student attempts to locate a root of \(\mathrm{f}(x) = 0\) by using a spreadsheet to calculate the values of \(\mathrm{f}(x)\) for positive integer values of \(x\). Explain why the student’s method may lead to the conclusion that \(\mathrm{f}(x) = 0\) has no roots. [1]
(b) Determine the exact value of the \(x\)-coordinate of the turning point of the curve. [2]
Mark scheme (a)
Scheme
Marks
AO
Explanation, e.g. • The function is positive for all integers so there will be no change of sign • There are two roots between 2 and 3 but the student only checks integers
B1
2.4
[1]
Notes
B1: See appendix Or f(2) and f(3) both positive so no change of sign Or there are two roots between 2 and 3 which will be missed Must mention integers if they don’t explicitly state 2 and 3 ignore attempts to evaluate f(2) and f(3) Must have either ‘no sign change’ or ‘two roots’
Appendix: exemplar responses for Q6(a)
Response
Mark
The following comments earn B1
The graph has two roots between 2 and 3 but since the \(y\) values and both 2 and 3 are positive, no change in sign will be detected so the student will not find the roots.
B1
The change of sign would go unnoticed between 2 and 3 on the \(x\) axis
B1
Both roots are between the positive integers 2 and 3 therefore a change of sign will not be observed.
B1
\(x=2\), \(\mathrm{f}(x) = 0.933\) \(x = 3\), \(\mathrm{f}(x) = 0.147\) so there is no change of sign so no roots determined
B1
The following comments earn B0
Student uses integer which when you use f(2) and f(3) both values are positive therefore it could not be used to locate a root
B0 as no explicit mention of change of sign
As he may skip over the exact moment \(\mathrm{f}(x)=0\) due to the interval change/resolution of the spreadsheet data.
B0 as change of sign not mentioned or that there are two roots between 2 and 3
She uses integer values the roots are between the integers 2 and 3 the graph \(\mathrm{f}(x)\) is always positive at these values.
B0 as no explicit mention of change of sign or 2 roots
It has 2 roots.
B0 as no explicit mention of change of sign or 2 roots between integers 2 and 3
Because there is a ln term in the equation.
B0 as no mention of change of sign or 2 roots
The student might miss an \(x\) value that correlates to \(\mathrm{f}(x)=0\)
B0 as no mention of change of sign or 2 roots between 2 and 3.
M1: Differentiation and setting equal to zero. Constant must differentiate to zero; sign errors condoned. Allow for \(13 + \frac{k}{x} = 0\) where \(k\) is a non-zero constant Condone poor/no notation
A1: Exact fraction or recurring decimal \(2.\dot{6}1538\dot{4}\) (if given as a decimal correct dot notation oe must be used) Ignore \(y\) value if seen isw decimals after correct answer seen
5 The diagram shows the curve with equation \(y = x^4 - 2^x\), for values of \(x\) close to zero.
(a)In this question you must show detailed reasoning. Show that the equation \(x^4 - 2^x = 0\) has a root which lies between 1 and 2. [2]
(b) Show that the equation \(x^4 - 2^x = 0\) can be written in the form \(x = 2^{0.25x}\) for positive values of \(x\). [1]
(c) Use the iterative formula \(x_{n+1} = 2^{0.25x_n}\) with \(x_0 = 0.4\) to determine a root of \(x^4 - 2^x = 0\) to 2 decimal places. [2]
(d) The diagram in the Printed Answer Booklet shows the line with equation \(y = x\) and the curve with equation \(y = 2^{0.25x}\). Sketch a cobweb or staircase diagram, on the diagram in the Printed Answer Booklet, for the iterative formula \(x_{n+1} = 2^{0.25x_n}\) starting with \(x_0 = 0.4\). Show at least two iterations. [2]
(e) Show that the equation \(x^4 - 2^x = 0\) can be written in the form \(x = 4\log_2 x\) for positive values of \(x\). [1]
(f)In this question you must show detailed reasoning. Show that the iteration \(x_{n+1} = 4\log_2 x_n\), with \(x_0 = 1\), will not find a root of \(x^4 - 2^x = 0\). [2]
Mark scheme (a)
Scheme
Marks
AO
DR \(1^4 - 2^1\ \ (= -1 < 0)\) and \(2^4 - 2^2\ \ (= 12 > 0)\)
M1
1.1
Values are \(-1\) and 12 so there is a change of sign (and hence a root between 1 and 2)
A1
2.4
[2]
Notes
DR: This question included the instruction: In this question you must show detailed reasoning.
M1: See appendix Allow \(1^4 - 2^1\) or 1 – 2 and \(2^4 - 2^2\) or 16 – 4 Ignore ‘= 0’ Condone \(-1\) and 12 only provided clearly linked to \(x = 1\) and \(x = 2\) e.g. as coordinates or in a table of values Allow for using two values between 1 and 2 that are either side of 1.24 e.g. 1.2 and 1.3
A1: Correct values of function and comment on change of sign, allow e.g. \(-1 < 0\) and \(12 > 0\) Condone no mention of function being sufficiently well-behaved (or continuous) e.g. 1.2 and 1.3 leading to \(-0.22\) and 0.39 (2 s.f. is sufficient)
Appendix: exemplar responses for Q5(a)
REMEMBER: It is not possible to have an award of M0A1
Response
Mark
After M1 has been awarded the following comments would earn A1
There is a sign change therefore the curve crosses the \(x\)-axis therefore a root is between 1 and 2
A1
Change of sign and root must be between 1 and 2
A1
\(-1 < 0\) and \(12 > 0\)
A1
\(-1\) is negative and 12 is positive
A1
Change of sign then there is a root between 1.2 and 1.3, which also lies between 1 and 2
A1
After M1 has been awarded the following comments would earn A0
\(x = 1, y = -1\) and \(x = 2, y = 8\), sign change suggests a root between these values
B1: AG Convincing rearrangement to given result Must show one step of working and no incorrect work seen Must not work backwards e.g. \(4\log_2(x) - x = 0\) is B0 as not convincingly from a correct process unless \(4\log_2(x) = x\) is seen first
Mark scheme (c)
Scheme
Marks
AO
\(x_1 = 1.07\ldots\)
M1
1.1
1.24
A1
2.2a
[2]
Notes
M1: \(x_1 =\) awrt 1.07 (= 1.07177...). soi by any of these values: 1.204…, 1.232…, 1.237…
A1: cao Must have shown at least one iteration e.g. \(x_1 = 1.07\)
Mark scheme (d)
Scheme
Marks
AO
B1 B1
1.1 1.1
[2]
Notes
B1: Vertical line \(x = 0.4\) drawn to meet the curve, could start line from \(y = x\)
B1: Correct completion of staircase diagram to head towards root with at least two vertical and two horizontal lines seen (lines need not extend beyond region between line and curve) Condone good freehand lines, mark intent SC B1B0 for using a different starting value e.g. \(x = 0\) with at least two vertical and two horizontal lines seen. Correct staircase diagram converging to root from their starting value.
B1: AG Convincing rearrangement to given result Must show at least one step of working and no incorrect work seen e.g. \(\log_2(x^4) - \log_2(2^x) = 0\) is B0 as not convincingly from a correct process unless \(\log_2(x^4) = \log_2(2^x)\) is seen first Must not work backwards
Mark scheme (f)
Scheme
Marks
AO
DR \(x_1 = 0\)
M1
1.1
Not possible to find log of zero
A1
2.4
[2]
Notes
DR: This question included the instruction: In this question you must show detailed reasoning.
M1: Or \(4\log_2 1 = 0\)
A1: Condone e.g. math error or \(x_2\) is invalid or \(x_2\) has no solution provided log 0 is mentioned
11Fig. 11.1 shows the curve with equation \(y = \mathrm{g}(x)\) where \(\mathrm{g}(x) = x\sin x + \cos x\) and the curve of the gradient function \(y = \mathrm{g}^{\prime}(x)\) for \(-2\pi \leqslant x \leqslant 2\pi\).
Fig. 11.1
(a) Show that the \(x\)-coordinates of the points on the curve \(y = \mathrm{g}(x)\) where the gradient is 1 satisfy the equation \(\dfrac{1}{x} - \cos x = 0\). [3]
Fig. 11.2 shows part of the curve with equation \(y = \dfrac{1}{x} - \cos x\).
Fig. 11.2
(b) Use the Newton-Raphson method with a suitable starting value to find the smallest positive \(x\)-coordinate of a point on the curve \(y = x\sin x + \cos x\) where the gradient is 1. You should write down at least the following.
The iteration you use
The starting value
The solution correct to 4 decimal places
[4]
(c) Explain why \(x_1 = 3\) is not a suitable starting value for the Newton-Raphson method in part (b). [1]
Mark scheme (a)
Scheme
Marks
AO
\(\dfrac{\mathrm{d}y}{\mathrm{d}x} = x\cos x\) oe
B1
1.1
\(x\cos x = 1\)
M1
1.1
\(\dfrac{1}{x} = \cos x\) so \(\dfrac{1}{x} - \cos x = 0\)
A1
2.1
[3]
Notes
M1: For their \(\dfrac{\mathrm{d}y}{\mathrm{d}x} = 1\)
A1: Convincing completion to given answer
Additional guidance
The B1 is for differentiating and can be given for seeing x cos x or the unsimplified version sin x + x cos x – sin x.
The M1 is given for x cos x =1 and the final A1 for finishing it off convincingly. If there is no differentiation, then the M1 is not available.
M1: Differentiation (for this mark look for a power of \(x\) and a term in \(\sin x\) or \(\cos x\) with at least one term correct)
A1: oe, e.g. \(x_{n+1} = x_n - \dfrac{\left(x_n - x_n^2\cos x_n\right)}{\left(-1 + x_n^2\sin x_n\right)}\) (The subscripts are needed)
M1: Starting values from 3.6 to 6.1 inclusive work for the given iteration but there may be other values which also give the required root and should be awarded.
A1: BC – candidates need not show intermediate iterations If a value outside the expected starting value is used and it converges to 4.9172 then M1A1 is awarded (no need to check) awrt 4.9172
Alternative method
Scheme
Marks
AO
For \(\mathrm{f}(x) = x\cos x - 1\), \(\mathrm{f}^{\prime}(x) = \cos x - x\sin x\)
M1: Starting values from 3.6 to 6.1 inclusive work for the given iteration but there may be other values which also give the required root.
A1: BC – candidates need not show intermediate iterations If a value outside the expected starting value is used and it converges to 4.9172 then M1A1 is awarded awrt 4.9172
Additional guidance
There are two methods given.
The first M mark is for attempting to differentiate either 1/x – cos x or x cos x -1.
The first A mark is for setting up the iteration function and it must include the subscripts.
The next M mark is for choosing a suitable starting value (accept values between 3.6 and 6.1). They might use \(x_0\) or \(x_1\) or just say ‘starting value’ – but it will be their first value.
The final A mark is for getting the root 4.9172. The question asked for 4dps. They do not need to show all the working (BC means ‘by calculator’) to get the A1. If they choose a value outside the range and it gives 4.9172 then give M1 A1. A value outside the range giving the wrong answer will get M0 A0.
Mark scheme (c)
Scheme
Marks
AO
The gradient is close to zero so the next iteration is a long way from the root or As it is a turning point, the starting value is invalid as you cannot divide by 0 or The iteration converges to a different root.
B1
3.2b
[1]
Notes
B1: Explanation referring to gradient of curve or to convergence to a different root. Not just that it is close to another root isw after a correct answer
Additional guidance
The comment needs to be more than just ‘it is close to another root’.
9 This question is about the equation \(\mathrm{f}(x) = 0\), where \(\mathrm{f}(x) = x^4 - x - \dfrac{1}{3x - 2}\).
Fig. 9.1 shows the curve \(y = \mathrm{f}(x)\).
Fig. 9.1
(a) Show, by calculation, that the equation \(\mathrm{f}(x) = 0\) has a root between \(x = 1\) and \(x = 2\). [2]
(b)Fig. 9.2 shows part of a spreadsheet being used to find a root of the equation.
Fig. 9.2
A
B
1
x
f(x)
2
1.5
3.1625
3
1.25
0.619977679
4
1.125
-0.250466087
5
Write down a suitable number to use as the next value of \(x\) in the spreadsheet. [1]
(c) Determine a root of the equation \(\mathrm{f}(x) = 0\). Give your answer correct to 1 decimal place. [1]
(d)Fig. 9.3 shows a similar spreadsheet being used to search for another root of \(\mathrm{f}(x) = 0\).
Fig. 9.3
A
B
1
x
f(x)
2
0
0.5
3
1
-1
4
0.5
1.5625
5
0.75
-4.4336
6
0.6
4.5296
7
0.7
-10.4599
8
0.65
19.5285
9
0.675
-40.4674
10
0.6625
79.5301
11
0.66875
-160.4687
12
(i) Explain why it looks from rows 2 and 3 of the spreadsheet as if there is a root between 0 and 1. [1]
(ii) Explain why this process will not find a root between 0 and 1. [1]
Mark scheme (a)
Scheme
Marks
AO
\(\mathrm{f}(1) = -1\)
B1
1.1
\(\mathrm{f}(2) = 13.75\) or \(\dfrac{55}{4}\) so there is a change of sign
B1
1.1
[2]
Notes
B1: Finding \(\mathrm{f}(1)\) or \(\mathrm{f}(2)\)
B1: Completion to show change of sign with explanation.
Additional guidance
The first B mark is for finding either f(1) or f(2). The second B mark is for finding the other value AND saying there is a sign change.
Mark scheme (b)
Scheme
Marks
AO
Value of \(x\) in the range \(1.125 \lt x \lt 1.25\)
B1
2.2a
[1]
Notes
B1: Any value in this range. Candidates may give the range.
Additional guidance
Any value between 1.125 and 1.25 will do for this mark. Some candidates are just halving the range and using 1.0625 which scores B0.
Mark scheme (c)
Scheme
Marks
AO
\(\mathrm{f}(1.15) = -0.09\) so \(x \approx 1.2\) (cao)
B1
2.2a
[1]
Notes
B1: Justified by their calculations (which may not necessarily use 1.15).
Additional guidance
They must give a value for, say f(1.15) = -0.09,(or f(1.15625) = -0.0496, f(1.16) = -0.025, f(1.163) = -0.05, f(1.164) = 0.0015), and a final value of 1.2. The question asks for 1dp so only accept 1.2. 1.2 with no other working scores B0. Other values for f are possible.
Mark scheme (d)
(i)
Scheme
Marks
AO
There is a change of sign;
E1
2.4
[1]
Notes
E1: Incorrect maths (e.g. it implies a y-intercept) B0
Additional guidance
A change is sign is all that is required here.
(ii)
Scheme
Marks
AO
Clear and correct explanation
E1
2.4
[1]
Notes
E1: E.g.
The function is undefined for \(x = \frac{2}{3}\) [and it looks as if the spreadsheet is homing in on this value]
Accept ‘discontinuous’ or ‘asymptote’ for ‘undefined’
Fig. 9.1 shows that there is only one root.
Could refer to the table (e.g. \(\mathrm{f}(x)\) values diverging)
isw after a correct answer
Additional guidance
We are allowing various comments. See the MS guidance. ISW after a correct answer has been seen.
The questions in this section refer to the article on the Insert. You should read the article before attempting the questions.
The relevant parts of the article “Approximating series” are reproduced below; the line numbers are those printed on the Insert.
Lines 17–19 Euler’s formula relates a sum of terms to an integral, and this can be illustrated by considering a suitable graph. For the sum of the squares of natural numbers, this is the graph of \(y = x^2\). The diagram shows this curve, with four shaded rectangles of areas \(1^2\), \(2^2\), \(3^2\) and \(4^2\).
Lines 20–21 Euler’s approximate formula for this case is as follows. \(\displaystyle\sum_{r=1}^{4} r^2 \approx \int_1^4 x^2\,\mathrm{d}x + \frac{4^2 + 1^2}{2} + \frac{1^2 - 2^2}{12} - \frac{4^2 - 5^2}{12}\)
Lines 22–25 The integral gives the area under the curve between \(x = 1\) and \(x = 4\). It is clear that the integral is smaller than \(\sum_{r=1}^{4} r^2\) so something needs to be added to the integral to get the same answer as the series. The rectangle for \(1^2\) needs to be added on and so do the parts of the other three rectangles that are above the curve.
Lines 26–27 Approximating the curve by a series of straight lines gives three triangles to be added on. These have areas \(\dfrac{2^2 - 1^2}{2}\), \(\dfrac{3^2 - 2^2}{2}\) and \(\dfrac{4^2 - 3^2}{2}\).
Lines 28–30 This gives an approximation for the series of \(\displaystyle\int_1^4 x^2\,\mathrm{d}x + 1^2 + \frac{2^2 - 1^2}{2} + \frac{3^2 - 2^2}{2} + \frac{4^2 - 3^2}{2}\) which simplifies to \(\displaystyle\int_1^4 x^2\,\mathrm{d}x + \frac{4^2 + 1^2}{2}\). The final two terms in Euler’s approximate formula are to correct for the curve not being a series of straight lines.
With the aid of a suitable diagram, show that the three triangles referred to in line 26 have the areas given in line 27. [3]
Mark scheme
Scheme
Marks
AO
B1 B1
3.2a 2.2a
Each triangle has area half base times height so \(\dfrac{\left(2^2 - 1^2\right)}{2}\), \(\dfrac{\left(3^2 - 2^2\right)}{2}\) and \(\dfrac{\left(4^2 - 3^2\right)}{2}\).
B1
2.4
[3]
Notes
B1: Correct triangles identified
B1: At least one height correctly found and related to diagram
B1: Correct completion (including base =1 either labelled on at least one triangle or stated (probably in calculation)) Dep on B2
14Fig. 14.1 shows the curve with equation \(y = \dfrac{1}{1+x^2}\), together with 5 rectangles of equal width.
Fig. 14.1
Fig. 14.2 shows the coordinates of the points A, B, C, D, E and F.
Point
A
B
C
D
E
F
\(x\)
0
0.2
0.4
0.6
0.8
1
\(y\)
1
0.96154
0.86207
0.73529
0.60976
0.5
Fig. 14.2
(a) Use the 5 rectangles shown in Fig. 14.1 and the information in Fig. 14.2 to show that a lower bound for \(\displaystyle\int_0^1 \frac{1}{1+x^2}\,\mathrm{d}x\) is 0.7337, correct to 4 decimal places. [2]
(b) Use the 5 rectangles shown in Fig. 14.1 and the information in Fig. 14.2 to calculate an upper bound for \(\displaystyle\int_0^1 \frac{1}{1+x^2}\,\mathrm{d}x\) correct to 4 decimal places. [2]
(c) Hence find the length of the interval in which your answers to parts (a) and (b) indicate the value of \(\displaystyle\int_0^1 \frac{1}{1+x^2}\,\mathrm{d}x\) lies. [1]
Amit uses \(n\) rectangles, each of width \(\dfrac{1}{n}\), to calculate upper and lower bounds for \(\displaystyle\int_0^1 \frac{1}{1+x^2}\,\mathrm{d}x\), using different values of \(n\). His results are shown in Fig. 14.3.
\(n\)
10
20
40
upper bound
0.80998
0.79779
0.79162
lower bound
0.75998
0.77279
0.77912
Fig. 14.3
(d) Find the length of the smallest interval in which Amit now knows \(\displaystyle\int_0^1 \frac{1}{1+x^2}\,\mathrm{d}x\) lies. [2]
(e)Without doing any calculation, explain how Amit could find a smaller interval which contains the value of \(\displaystyle\int_0^1 \frac{1}{1+x^2}\,\mathrm{d}x\). [1]
10In this question you must show detailed reasoning.
The questions in this section refer to the article on the Insert. You should read the article before attempting the questions.
The relevant parts of the article “Approximating the sine function” are reproduced below; the line numbers are those printed on the Insert.
Lines 12–14 Fig. C2.1 shows the curve \(y = \sin x\) and the quadratic curve which goes through the points \((0, 0)\), \(\left(\frac{\pi}{2}, 1\right)\) and \((\pi, 0)\). The equation of this curve is \(y = \dfrac{4x(\pi - x)}{\pi^2}\). Fig. C2.2 shows the curve \(y = \dfrac{4x(\pi - x)}{\pi^2} - \sin x\).
Fig. C2.1Fig. C2.2
Fig. C2.2 indicates that the curve \(y = \dfrac{4x(\pi - x)}{\pi^2} - \sin x\) has a stationary point near \(x = 3\).
Verify that the \(x\)-coordinate of this stationary point is between 2.6 and 2.7.
Show that this stationary point is a maximum turning point. [5]
Mark scheme
Scheme
Marks
AO
DR \(\dfrac{\mathrm{d}y}{\mathrm{d}x} = \dfrac{4}{\pi} - \dfrac{8x}{\pi^2} - \cos x\)
M1: Attempt to differentiate. Both an \(x\) term and a cos term needed condone other errors. If \(\pi^2\) is treated as a variable and incorrectly differentiated eg to \(2\pi\) then M0. Similarly with \(\pi\).
M1: At least one substitution into their expression
A1: Both correct (at least 2d.p., rounded or truncated)
E1: Can be implied by ‘sign change’ or sketch Dependent on M2 but can be earned following M2A0
B1: Allow 2nd derivative used at turning point found BC (\(x = 2.67\), 2nd deriv \(= -0.356\)) or 2 relevant values eg \(-0.295\) and \(-0.383\) seen and stated as \(< 0\) therefore max
8 Kareem wants to solve the equation \(\sin 4x + \mathrm{e}^{-x} + 0.75 = 0\). He uses his calculator to create the following table of values for \(\mathrm{f}(x) = \sin 4x + \mathrm{e}^{-x} + 0.75\).
\(x\)
0
1
2
3
4
5
6
\(\mathrm{f}(x)\)
1.750
0.361
1.875
0.263
0.480
1.670
\(-0.153\)
He argues that because \(\mathrm{f}(6)\) is the first negative value in the table, there is a root of the equation between 5 and 6.
(a) Comment on the validity of his argument. [1]
The diagram shows the graph of \(y = \sin 4x + \mathrm{e}^{-x} + 0.75\).
(b) Explain why Kareem failed to find other roots between 0 and 6. [1]
Kareem decides to use the Newton-Raphson method to find the root close to 3.
(c)
(i) Determine the iterative formula he should use for this equation. [2]
(ii) Use the Newton-Raphson method with \(x_0 = 3\) to find a root of the equation \(\mathrm{f}(x) = 0\). Show three iterations and give your answer to a suitable degree of accuracy. [3]
Kareem uses the Newton-Raphson method with \(x_0 = 5\) and also with \(x_0 = 6\) to try to find the root which lies between 5 and 6. He produces the following tables.
\(x_0\)
5
\(x_1\)
3.97288
\(x_2\)
4.12125
\(x_0\)
6
\(x_1\)
6.09036
\(x_2\)
6.07110
(d)
(i) For the iteration beginning with \(x_0 = 5\), represent the process on the graph in the Printed Answer Booklet. [2]
The graph in the Printed Answer Booklet:
(ii) Explain why the method has failed to find the root which lies between 5 and 6. [2]
(iii) Explain how Kareem can adapt his method to find the root between 5 and 6. [1]
Mark scheme (a)
Scheme
Marks
AO
Karim has a valid argument that there is a root between 5 and 6 because there is a change of sign on his table
E1
2.3
[1]
Notes
E1: Argues from change of sign that this argument is valid Allow argument is not valid as he does not state that the function is continuous
Mark scheme (b)
Scheme
Marks
AO
There are two roots between 2 and 3 (and/or between 4 and 5) so there is no change of sign in the table
E1
2.3
[1]
Notes
E1: Allow for a comment that implies changes of sign are missed
So N-R formula is \(x_{n+1} = x_n - \dfrac{\sin 4x_n + \mathrm{e}^{-x_n} + 0.75}{4\cos 4x_n - \mathrm{e}^{-x_n}}\)
A1
1.1b
[2]
(ii)
\(x_0\)
3
\(x_1\)
2.920853…
\(x_2\)
2.908274…
\(x_3\)
2.907846…
The root is 2.908 to 4 s.f.
M1 A1 A1
1.1b 1.1b 2.2a
[3]
Notes
(i) M1: Attempt to differentiate
A1: cao, but condone missing subscripts in the fraction
(ii) M1: Produces at least two iterations
A1: Three iterations with correct values either rounded or truncated to at least 3 decimal places
A1: Correct to at least 3 s.f. FT their values if their sequence seems to converge
(root is 2.907845109 to 10 sf)
Mark scheme (d)
Scheme
Marks
AO
(i)
B1 B1
1.1b 1.1b
[2]
(ii) The start value is close to a stationary point, [so the gradient is very small] and the tangent meets the \(x\)-axis far away from the required root
B1
2.4
The sequence converges to a root, but not the required root
B1
2.4
[2]
(iii) Use \(x_0\) any value [between 5.28 and 5.85] which is nearer to the required root.
E1
2.4
[1]
Notes
(i) B1: Attempt to draw a tangent at \(x = 5\) as far as the \(x\)-axis
B1: Drawing the second tangent approximately at the point where \(x = 3.97\) as far as the \(x\)-axis.
(ii) B1: Conveys the idea that the stationary point or the value of the gradient causes the problem
B1: Conveys the idea that the wrong root is found
(iii) E1: Allow for a ‘starting value between 5 and 6’ oe
10In this question you must show detailed reasoning.
The equation of a curve is
\(y = \dfrac{\sin 2x - x}{x\sin x}\).
(a) Use the small angle approximation given in the list of formulae on pages 2–3 of this question paper to show that \(\displaystyle\int_{0.01}^{0.05} y\,\mathrm{d}x \approx \ln 5\). [4]
(b) Use the same small angle approximation to show that \(\dfrac{\mathrm{d}y}{\mathrm{d}x} \approx -10000\) at the point where \(x = 0.01\). [2]
The equation \(y = 0\) has a root near \(x = 1\). Joan uses the Newton-Raphson method to find this root. The output from the spreadsheet she uses is shown in Fig. 10.1.
\(n\)
0
1
2
3
4
5
6
7
\(x_n\)
1
0.958509
0.950084
0.948261
0.94786
0.947772
0.947753
0.947748
Fig. 10.1
Joan carries out some analysis of this output. The results are shown in Fig. 10.2.
\(x\)
\(y\)
0.9477475
–7.79967E–07
0.9477485
–2.90821E–06
\(x\)
\(y\)
0.947745
4.54066E–06
0.947755
–1.67417E–05
Fig. 10.2
(c) Consider the information in Fig. 10.1 and Fig. 10.2.
Write 4.54066E–06 in standard mathematical notation.
State the value of the root as accurately as you can, justifying your answer.
[3]
Mark scheme (a)
Scheme
Marks
AO
\(\sin 2x \approx 2x\) or \(\sin x \approx x\) used
M1
3.1a
\(\displaystyle\int \left(\frac{1}{x}\right)\mathrm{d}x\) or \(\displaystyle\int \left(\frac{1}{x} - x\right)\mathrm{d}x\) obtained oe nfww
A1
1.1
\(\mathrm{F}[x] = \ln x\) oe or \(\mathrm{F}[x] = \ln x - \frac{1}{2}x^2\) oe
A1: intermediate step needed from here to earn final mark
(corrected from the printed mark scheme: the last line is printed as \(\ln(0.05) - \ln(0.01) + 0.0012 \approx \ln 5\); with \(\mathrm{F}[x] = \ln x - \frac{1}{2}x^2\) the 0.0012 is subtracted)
Mark scheme (b)
Scheme
Marks
AO
differentiation of their \(\frac{1}{x}\)
M1
2.1
substitution of 0.01 and \(-10\,000\) correctly obtained
A1
1.1
[2]
Notes
M1: or differentiation of \(y\) using quotient rule and use of small angle approximation
A1: from \(-\frac{1}{x^2}\) or \(-\frac{1}{x^2} - 1\) oe
Mark scheme (c)
Scheme
Marks
AO
\(4.54066 \times 10^{-6}\) or 0.00000454066 cao
B1
2.5
(no sign change for 6 dp), but sign change for 5 dp or last two iterates agree to 5dp
E1
3.1a
0.94775
B1
3.2a
[3]
Notes
E1: allow sign change between 0.947745 and 0.9477475
8 Fig. 8.1 shows the cross-section of a straight driveway 4 m wide made from tarmac.
Fig. 8.1
The height \(h\) m of the cross-section at a displacement \(x\) m from the middle is modelled by \(h = \dfrac{0.2}{1+x^2}\) for \(-2 \leqslant x \leqslant 2\).
A lower bound of \(0.3615\,\mathrm{m^2}\) is found for the area of the cross-section using rectangles as shown in Fig. 8.2.
Fig. 8.2
(a) Use a similar method to find an upper bound for the area of the cross-section. [3]
(b) Use the trapezium rule with 4 strips to estimate \(\displaystyle\int_0^2 \frac{0.2}{1+x^2}\,\mathrm{d}x\). [2]
(c) The driveway is 10 m long. Use your answer in part (b) to find an estimate of the volume of tarmac needed to make the driveway. [2]
Mark scheme (a)
Scheme
Marks
AO
\(x\)
0
\(\pm 0.5\)
\(\pm 1\)
\(\pm 1.5\)
2
\(h\)
\(\frac{1}{5}\)
\(\frac{4}{25}\)
\(\frac{1}{10}\)
\(\frac{4}{65}\)
\(\frac{1}{25}\)
\(h\)
0.2
0.16
0.1
0.061538
0.04
M1
3.4
\(= 2 \times 0.5(0.2 + 0.16 + 0.1 + 0.061538)\)
M1
1.1a
\(= 0.522\) to 3sf
A1
1.1
[3]
Notes
M1: Finding at least 2 distinct values for \(h\) Need not be a table of values
M1: Using rectangles forming UB for area with width 0.5. Need not be drawn Allow both M marks if only half the area considered.
5 Fig. 5 shows part of the curve \(y = \operatorname{cosec} x\) together with the \(x\)- and \(y\)-axes.
Fig. 5
(a) For the section of the curve which is shown in Fig. 5, write down
(i) the equations of the two vertical asymptotes, [2]
(ii) the coordinates of the minimum point. [1]
(b) Show that the equation \(x = \operatorname{cosec} x\) has a root which lies between \(x = 1\) and \(x = 2\). [2]
(c) Use the iteration \(x_{n+1} = \operatorname{cosec}(x_n)\), with \(x_0 = 1\), to find
(i) the values of \(x_1\) and \(x_2\), correct to 5 decimal places, [1]
(ii) this root of the equation, correct to 3 decimal places. [1]
(d) There is another root of \(x = \operatorname{cosec} x\) which lies between \(x = 2\) and \(x = 3\). Determine whether the iteration \(x_{n+1} = \operatorname{cosec}(x_n)\) with \(x_0 = 2.5\) converges to this root. [1]
(e) Sketch the staircase or cobweb diagram for the iteration, starting with \(x_0 = 2.5\), on the diagram in the Printed Answer Booklet. [3]
Diagram from the Printed Answer Booklet:
Mark scheme (a)
Scheme
Marks
AO
(i) \(x = 0\)
B1
1.1
\(x = \pi\)
B1
1.1
[2]
(ii) \(\left(\dfrac{\pi}{2},\ 1\right)\)
B1
2.2a
[1]
Notes
(i): If answers given in both degrees and radians follow inst 2g
(i) B1: 180 gets 0
(ii) B1: (90, 1) or (1.57, 1) get 0
Mark scheme (b)
Scheme
Marks
AO
\(1 - \operatorname{cosec} 1 = -0.188\ldots\) or ‘negative’ \(2 - \operatorname{cosec} 2 = 0.900\) or ‘positive’
B1
1.1a
Change of sign so root between 1 and 2
E1
2.4
[2]
Notes
B1: Both correct OE E,g, may use \(\operatorname{cosec} x - x\)
E1: Condone no mention of continuity AG Dep on B mark
Mark scheme (c)
Scheme
Marks
AO
(i) BC 1.18840…, 1.07785…
B1
1.1a
[1]
(ii) BC 1.114
B1
2.2a
[1]
Notes
(i) B1: Both correct to at least 3dp.
Mark scheme (d)
Scheme
Marks
AO
No, it converges to 1.114
E1
1.1
[1]
Notes
E1: OR same as their(c) (ii) or ‘the root between 1 and 2’ etc Just ‘No’ gets 0 ‘Yes’ with anything gets 0
Mark scheme (e)
Scheme
Marks
AO
B1 B1 B1
3.2a 2.2a 1.1
[3]
Notes
B1: Starting point between min and right asymptote

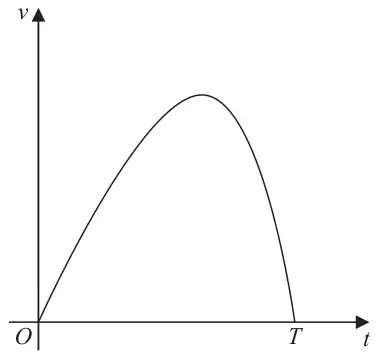
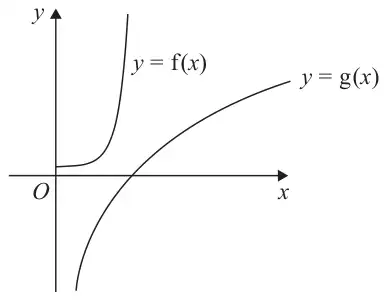
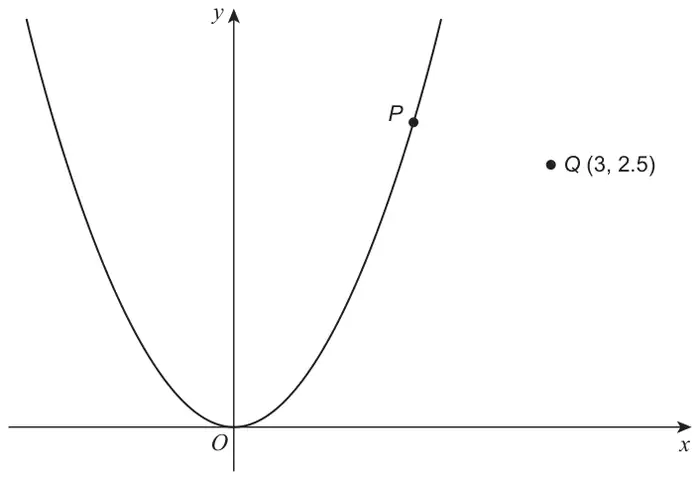
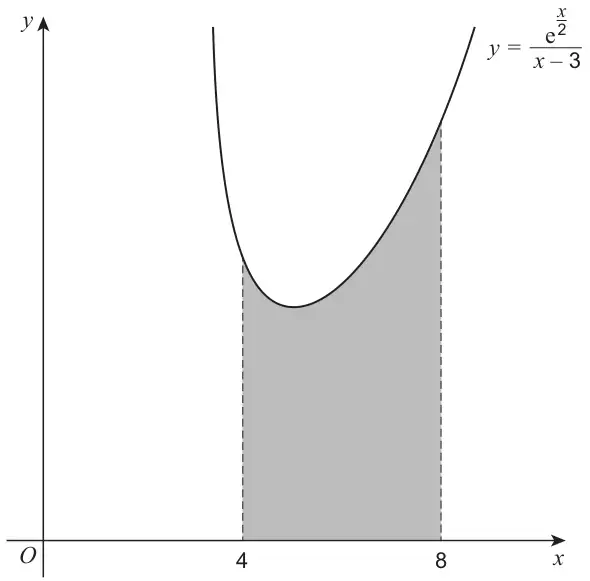
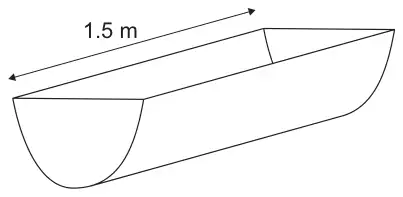
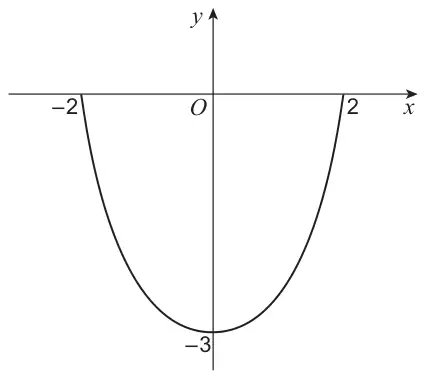
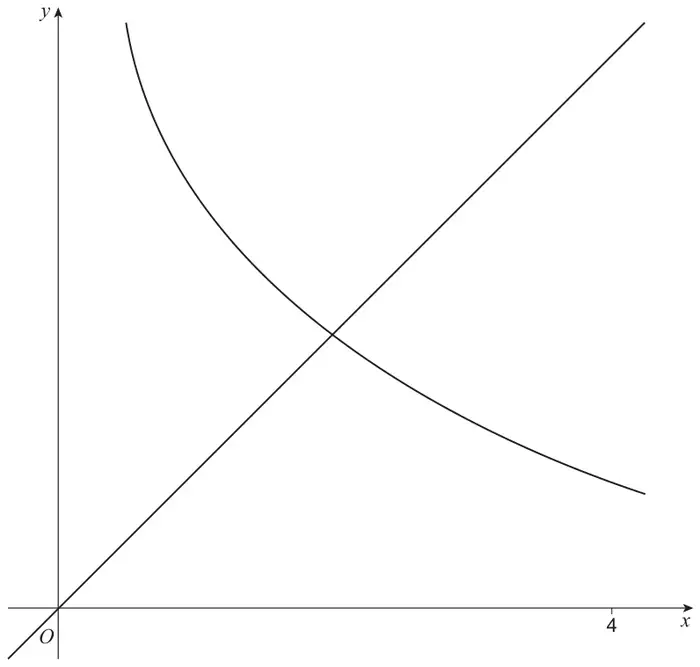
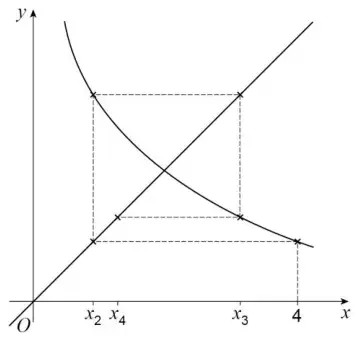
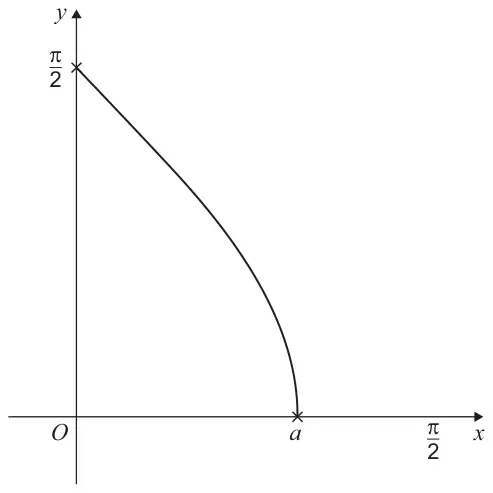
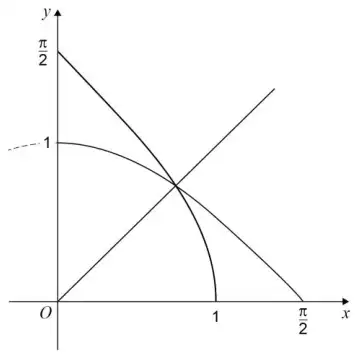
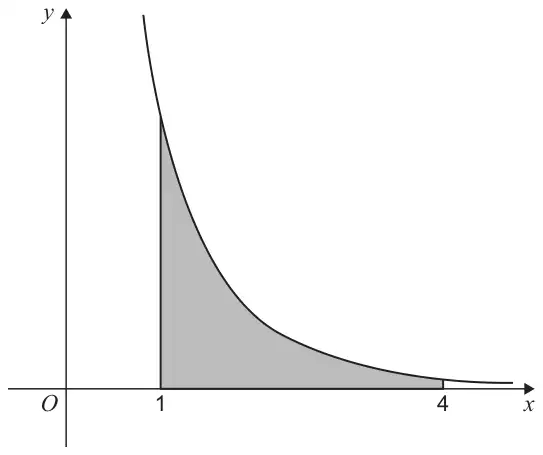
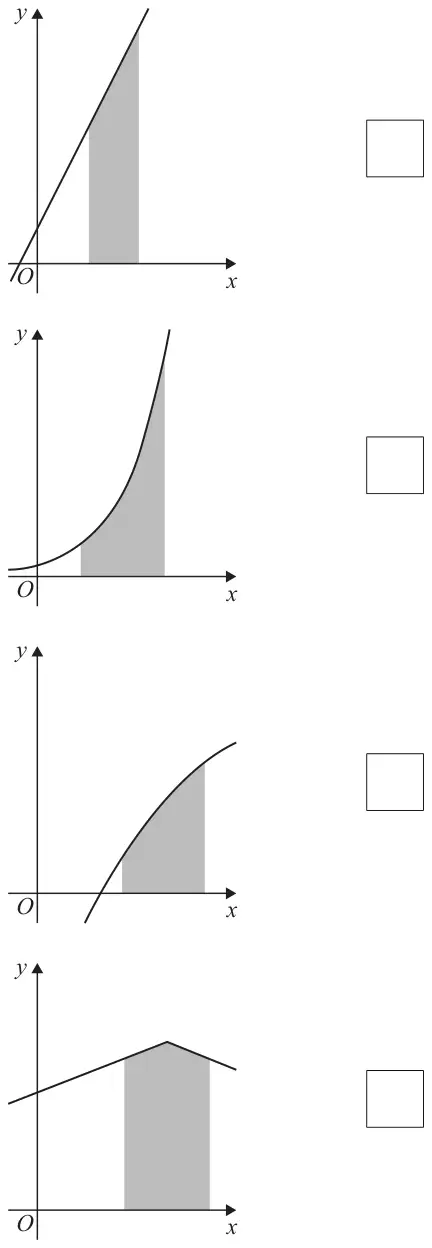
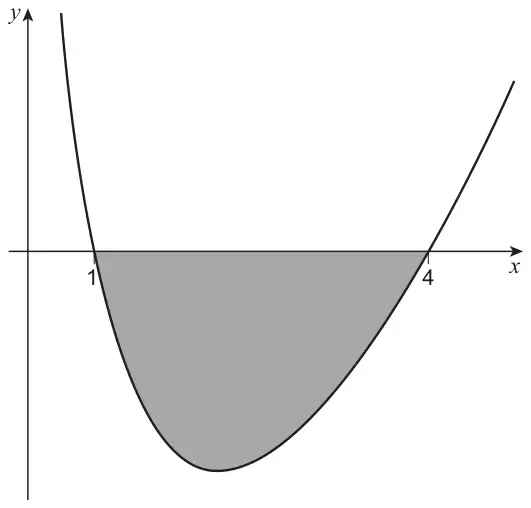
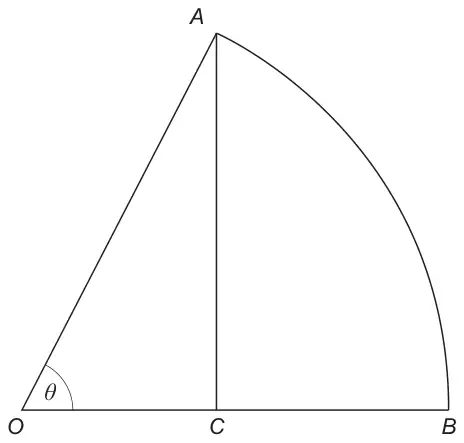
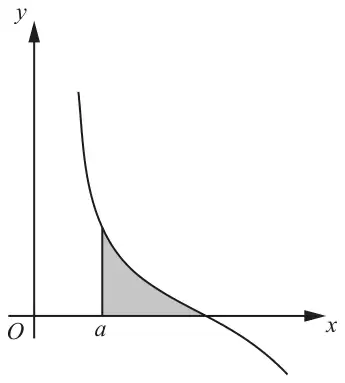
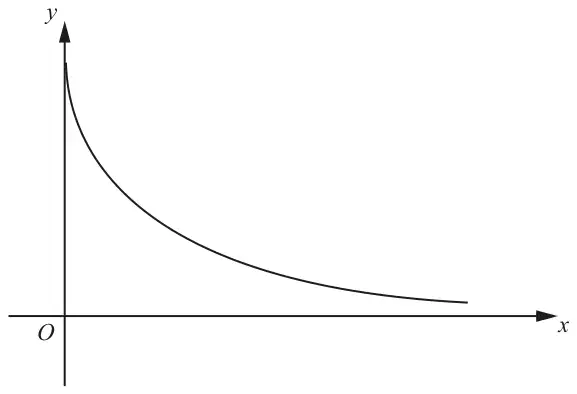
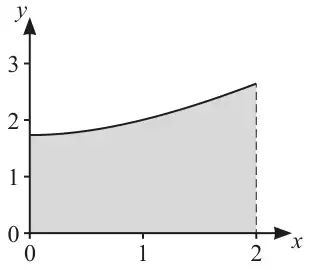
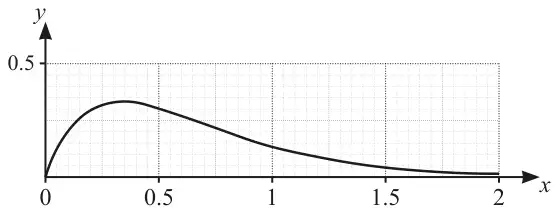
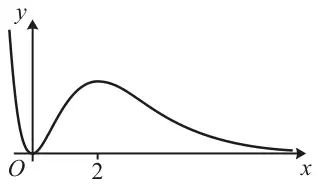
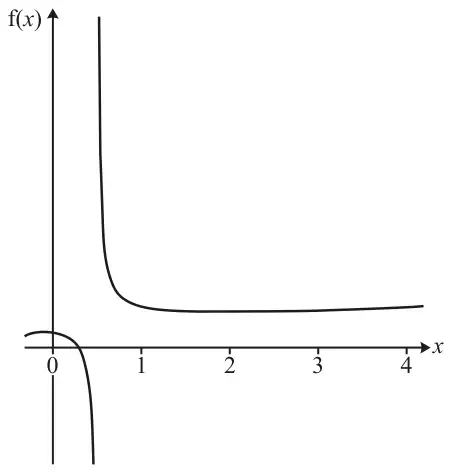
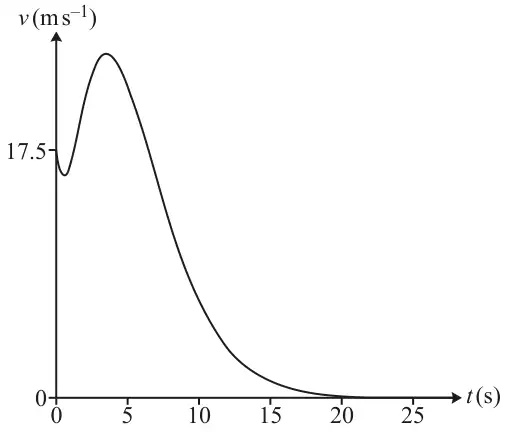
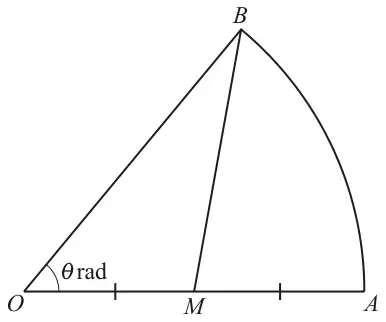
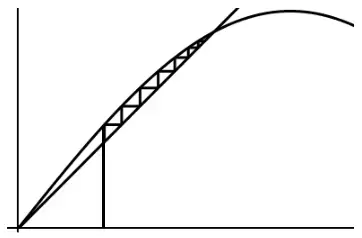
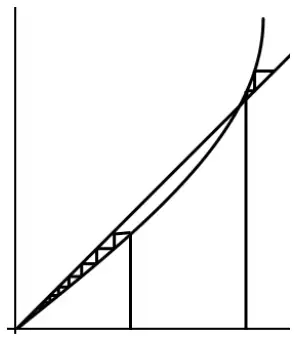
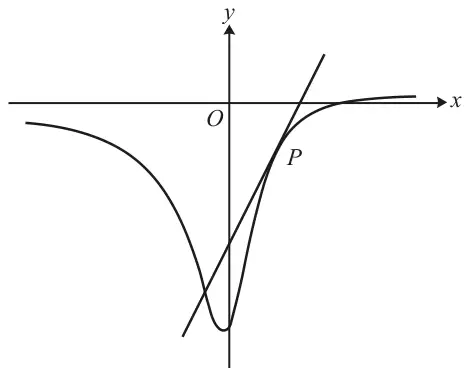
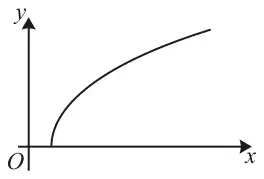
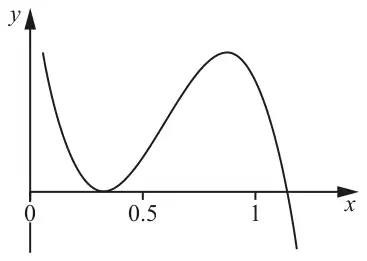
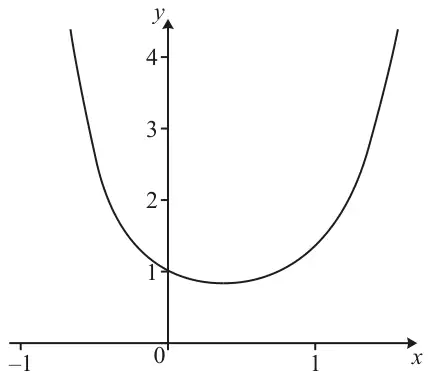
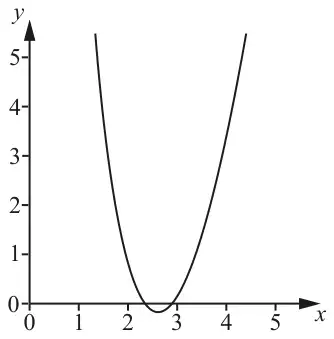
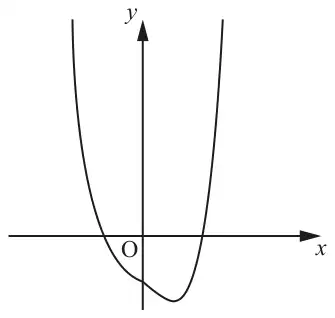
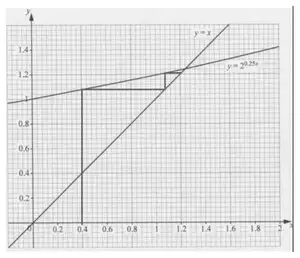
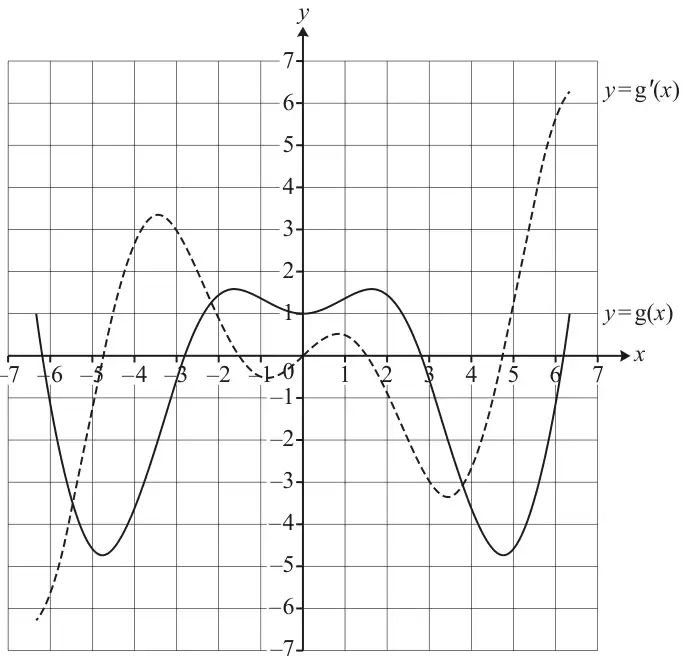
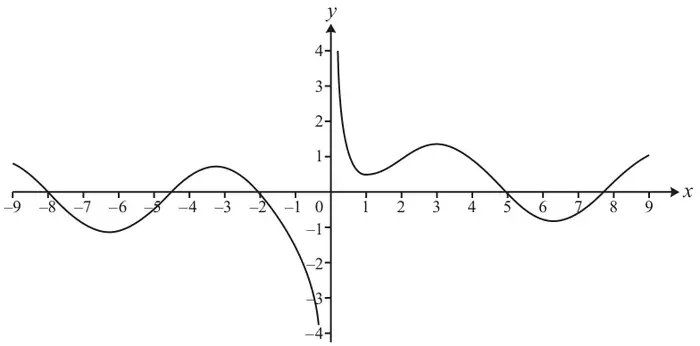
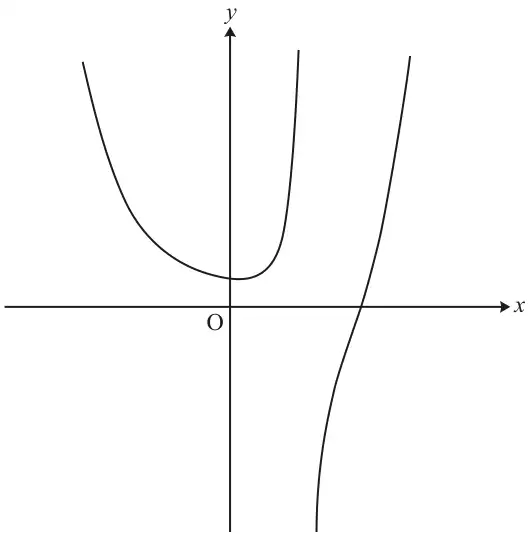
![Graph of y = x squared for x from −2 to 5 with four shaded rectangles of width 1 on [0, 1], [1, 2], [2, 3] and [3, 4], of heights 1, 4, 9 and 16, each with its top-right corner on the curve](https://www.westiesworkshop.com/wp-content/uploads/question-bank/a2-mei/mei-h64003-jun23-q12-fig1.webp)