
June 2023 Paper 3 Q2
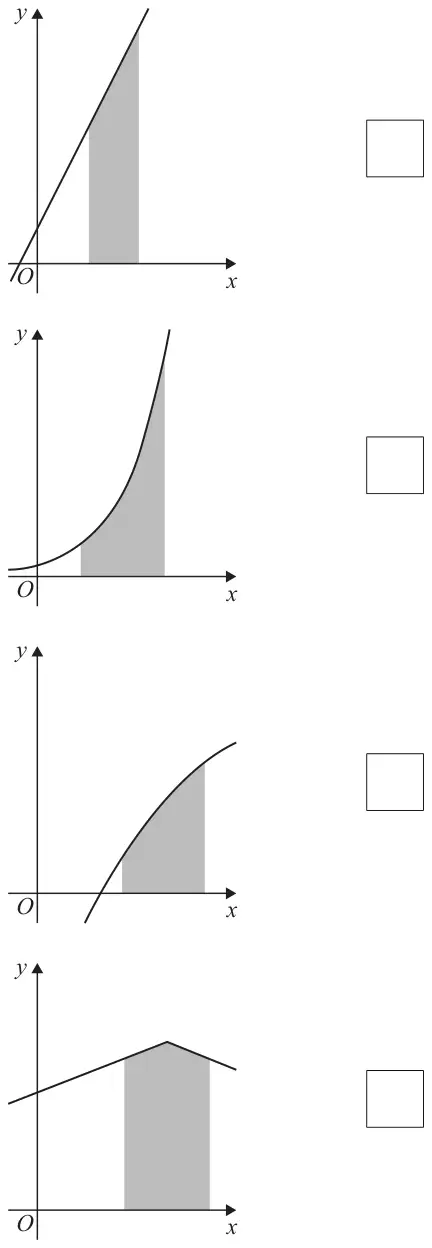
2 The trapezium rule is used to estimate the area of the shaded region in each of the graphs below.
Identify the graph for which the trapezium rule produces an overestimate.
Tick (✓) one box. [1 mark]
| Scheme | Marks | AO |
|---|---|---|
| Ticks correct box | R1 | 2.2a |
| (1 mark) |
Typical solution
The second graph: the increasing curve that gets steeper, starting just above \(O\) on the \(y\)-axis