Logs & Exponentials

Edexcel

AQA

OCR A

OCR MEI

June 2025 Paper 1 Q11

EdexcelCurrent spec8 marksLogs & ExponentialsModelling

11.

In this question you must show all stages of your working.

Solutions relying entirely on calculator technology are not acceptable.

The value of a car, £\(V\), is modelled by the equation

\[V = 1500 + A\,\mathrm{e}^{-kt}\]

where \(A\) and \(k\) are positive constants and \(t\) is the age of the car in years.

Given that

  • the initial value of the car was £20 000
  • the value of the car was £12 000 when it was 2.5 years old
(a) find a complete equation for the model, giving the exact value of \(A\) and the value of \(k\) to 3 significant figures. (4)
(b) Show that the rate of change in the value of the car can be expressed in the form\[-k(V - 1500)\] (3)
(c) State a limitation of this model. (1)

June 2025 Paper 2 Q9

EdexcelCurrent spec8 marksLogs & ExponentialsModelling

9.

In this question you must show all stages of your working.

Solutions relying entirely on calculator technology are not acceptable.

A new type of car is released for sale.

The total number of this type of car sold, \(N\), in a particular region, \(t\) months after the cars were released for sale, is modelled by the equation\[N = 5000 - 5000\mathrm{e}^{-0.075t} \qquad t \geqslant 0\]

Use the equation of the model to answer parts (a), (b), (c) and (d).

(a) Find the total number of cars sold in the first 3 months. (2)

Given that \(N = 3000\) when \(t = T\)

(b) find the value of \(T\) giving the answer to 2 decimal places. (3)
(c) Find the rate of increase in the total number of cars sold when \(t = 3\), giving the answer to 3 significant figures. (2)

After a marketing campaign, the total number of cars sold is expected to rise and have an upper limit of 6500

(d) Using this information, suggest one refinement to the model. (1)

June 2025 Paper 2 Q3

EdexcelCurrent spec2 marksLogs & Exponentials

3. Given that\[3^x = 7^y\]find the exact value of \(\dfrac{x}{y}\) (2)

June 2024 Paper 2 Q13

EdexcelCurrent spec9 marksLogs & ExponentialsModelling

13. The world human population, \(P\) billions, is modelled by the equation

\[P = ab^t\]

where \(a\) and \(b\) are constants and \(t\) is the number of years after 2004

Using the estimated population figures for the years from 2004 to 2007, a graph is plotted of \(\log_{10}P\) against \(t\).

The points lie approximately on a straight line with

  • gradient 0.0054
  • intercept 0.81 on the \(\log_{10}P\) axis
(a) Estimate, to 3 decimal places, the value of \(a\) and the value of \(b\). (4)

In the context of the model,

(b)
(i) interpret the value of the constant \(a\),
(ii) interpret the value of the constant \(b\). (2)
(c) Use the model to estimate the world human population in 2030 (2)
(d) Comment on the reliability of the answer to part (c). (1)

June 2024 Paper 1 Q9

EdexcelCurrent spec6 marksLogs & ExponentialsSequences & Series

9. The first 3 terms of a geometric sequence are

\[3^{4k-5} \qquad 9^{7-2k} \qquad 3^{2(k-1)}\]

where \(k\) is a constant.

(a) Using algebra and making your reasoning clear, prove that \(k = \dfrac{5}{2}\) (3)
(b) Hence find the sum to infinity of the geometric sequence. (3)

June 2025 Paper 1 Q17

AQACurrent spec10 marksIntegrationLogs & Exponentials

17

(a) Use the substitution \(u = \mathrm{e}^{x} + 1\) to show that\[\int \frac{\mathrm{e}^{2x}}{\mathrm{e}^{x} + 1}\,\mathrm{d}x = \mathrm{e}^{x} - \ln\left(\mathrm{e}^{x} + 1\right) + k\] [5 marks]
(b) Solve the differential equation\[\left(\frac{\mathrm{e}^{x} + 1}{\mathrm{e}^{2x}}\right)\frac{\mathrm{d}y}{\mathrm{d}x} = \cos^2 y\]given that \(y = \pi\) when \(x = 0\)

Write your answer in the form

\[\tan y = \mathrm{e}^{x} + \ln\left(\frac{A}{\mathrm{e}^{x} + 1}\right) + B\]

where \(A\) and \(B\) are constants to be found.

[5 marks]

June 2025 Paper 2 Q10

AQACurrent spec13 marksDifferentiationLogs & Exponentials

10 A curve \(C\) has equation

\[y = x^{k}\ln x \quad \text{for } x \gt 0\]

where \(k\) is a positive integer.

(a) Show that\[\frac{\mathrm{d}y}{\mathrm{d}x} = x^{k-1}\left[A + k\ln x\right]\]where \(A\) is a constant to be found. [4 marks]
(b) Hence show that the \(y\)-coordinate of the stationary point of \(C\) can be written as \(-\dfrac{1}{k\mathrm{e}}\)

Fully justify your answer.

[5 marks]
(c) Given that the stationary point of \(C\) has coordinates \(\left(\dfrac{1}{\mathrm{e}}, -\dfrac{1}{\mathrm{e}}\right)\) state the value of \(k\) [1 mark]
(d) Prove that \(C\) does not have a point of inflection. [3 marks]

June 2025 Paper 1 Q10

AQACurrent spec12 marksLogs & ExponentialsModelling

10 A researcher working for a frozen-food manufacturer uses the formula

\[\theta = 21 - A\mathrm{e}^{-kt}\]

to model the temperature of a dessert once it is taken out of a freezer.

In this model:

  • \(\theta\) is the temperature of the dessert in \(^\circ\)C
  • \(t\) is the time in hours since the dessert was removed from the freezer
  • \(A\) and \(k\) are positive constants.
(a) Show how\[\theta = 21 - A\mathrm{e}^{-kt}\]can be rearranged to obtain\[\ln(21 - \theta) = -kt + \ln A\] [3 marks]
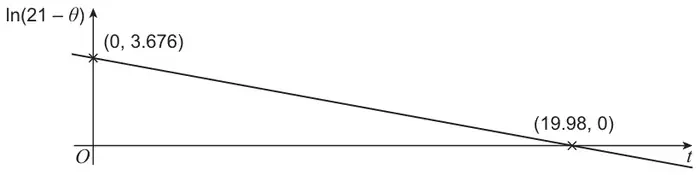
(b) The researcher uses measurements they have recorded to plot the graph of \(\ln(21 - \theta)\) against \(t\) as shown in the diagram below.
Straight line graph of ln(21 − θ) against t, with negative gradient, crossing the vertical axis at (0, 3.676) and the t-axis at (19.98, 0)
(i) Use the information on the graph to find the value of \(A\)

Give your answer to three significant figures.

[2 marks]
(ii) Use the information on the graph to find the value of \(k\)

Give your answer to three significant figures.

[2 marks]
(iii) Find the temperature of the dessert when it is initially removed from the freezer.

Give your answer to three significant figures.

[2 marks]
(c) The dessert is ready to be eaten when its temperature reaches 4\(^\circ\)C

Use the model to determine the time, after being removed from the freezer, for the dessert to reach this temperature.

Give your answer to the nearest 10 minutes.

[3 marks]

June 2025 Paper 1 Q7

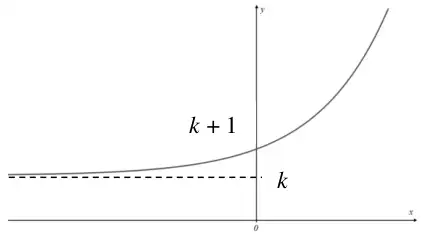
7 It is given that \(0 \lt a \lt 1\)

Sketch the graph with equation

\[y = a^{x}\]

on the axes below. [2 marks]

Blank axes: x-axis and y-axis meeting at the origin O

June 2025 Paper 2 Q4

AQACurrent spec2 marksLogs & Exponentials

4 Solve the equation

\[5^{x-1} = 20\]

Give your answer in an exact form. [2 marks]

June 2025 Paper 3 Q4

AQACurrent spec3 marksLogs & Exponentials

4

(a) State the value of\[\log_a a^2\]

where \(a \gt 0\)

[1 mark]
(b) Find the value of\[\log_a \sqrt{a} - \log_a \frac{1}{a^2}\]

where \(a \gt 0\)

[2 marks]

June 2025 Paper 3 Q3

3 The function \(\mathrm{f}\) is defined by

\[\mathrm{f}(x) = \mathrm{e}^x \quad \text{for } x \in \mathbb{R}\]

Identify which one of the following statements describes the function \(\mathrm{f}\)

Tick (✓) one box. [1 mark]

  • Decreasing and concave
  • Decreasing and convex
  • Increasing and concave
  • Increasing and convex

June 2025 Paper 2 Q1

1 Describe the single transformation which maps the curve with the equation

\[y = \ln x\]

onto the curve with the equation

\[y = 2\ln x\]

Tick (✓) one box. [1 mark]

  • Stretch, scale factor 2, parallel to the \(y\)-axis
  • Stretch, scale factor \(\dfrac{1}{2}\), parallel to the \(x\)-axis
  • Translation \(\begin{bmatrix}2\\0\end{bmatrix}\)
  • Translation \(\begin{bmatrix}0\\2\end{bmatrix}\)

June 2024 Paper 1 Q14

14

(a) The equation\[x^3 = \mathrm{e}^{6 - 2x}\]has a single solution, \(x = \alpha\)

By considering a suitable change of sign, show that \(\alpha\) lies between 0 and 4 [2 marks]

(b) Show that the equation \(x^3 = \mathrm{e}^{6 - 2x}\) can be rearranged to give\[x = 3 - \frac{3}{2}\ln x\] [3 marks]
(c)
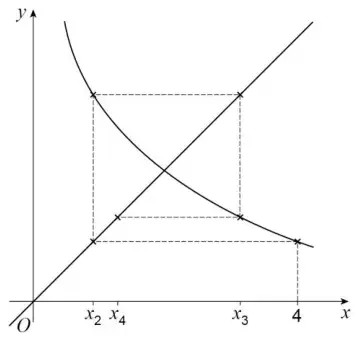
(i) Use the iterative formula\[x_{n+1} = 3 - \frac{3}{2}\ln x_n\]with \(x_1 = 4\), to find \(x_2\), \(x_3\) and \(x_4\)

Give your answers to three decimal places. [2 marks]

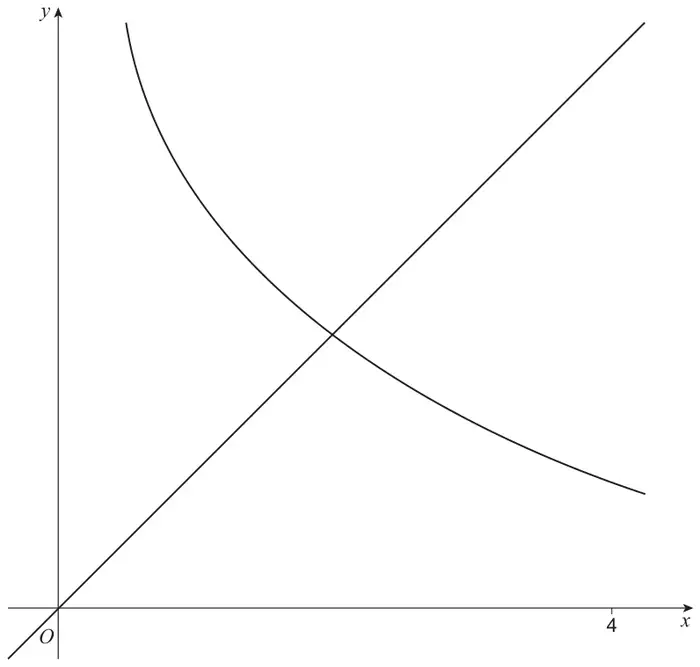
(ii) Figure 1 below shows a sketch of parts of the graphs of\[y = 3 - \frac{3}{2}\ln x \text{ and } y = x\]On Figure 1, draw a staircase or cobweb diagram to show how convergence takes place.

Label, on the \(x\)-axis, the positions of \(x_2\), \(x_3\) and \(x_4\) [2 marks]

Figure 1: graphs of the decreasing curve y = 3 − (3/2) ln x and the line y = x through O, intersecting once, with x = 4 marked on the x-axis
Figure 1
(iii) Explain why the iterative formula\[x_{n+1} = 3 - \frac{3}{2}\ln x_n\]fails to converge to \(\alpha\) when the starting value is \(x_1 = 0\) [1 mark]

June 2024 Paper 2 Q8

AQACurrent spec7 marksLogs & ExponentialsModelling

8 A zookeeper models the median mass of infant monkeys born at their zoo, up to the age of 2 years, by the formula

\[y = a + b\log_{10} x\]

where \(y\) is the median mass in kilograms, \(x\) is age in months and \(a\) and \(b\) are constants.

The zookeeper uses the data shown below to determine the values of \(a\) and \(b\).

Age in months (\(x\))324
Median mass (\(y\))6.412
(a) The zookeeper uses the data for monkeys aged 3 months to write the correct equation\[6.4 = a + b\log_{10} 3\]
(i) Use the data for monkeys aged 24 months to write a second equation. [1 mark]
(ii) Show that\[b = \frac{5.6}{\log_{10} 8}\] [3 marks]
(iii) Find the value of \(a\).

Give your answer to two decimal places. [1 mark]

(b) Use a suitable value for \(x\) to determine whether the model can be used to predict the median mass of monkeys less than one week old. [2 marks]

June 2024 Paper 3 Q8

AQACurrent spec8 marksLogs & ExponentialsModelling

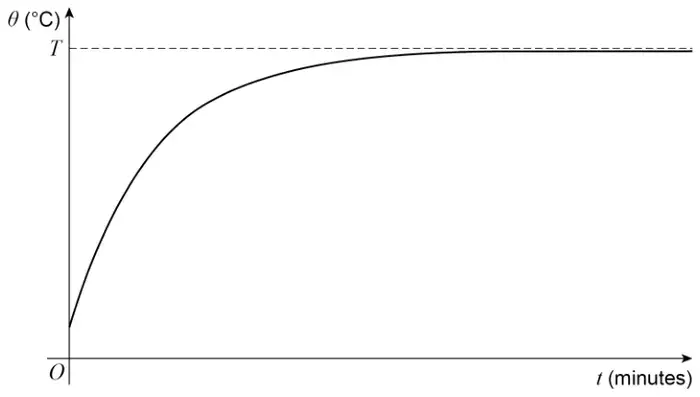
8 The temperature \(\theta\) °C of an oven \(t\) minutes after it is switched on can be modelled by the equation

\[\theta = 20\left(11 - 10\mathrm{e}^{-kt}\right)\]

where \(k\) is a positive constant.

Initially the oven is at room temperature.

The maximum temperature of the oven is \(T\) °C

The temperature predicted by the model is shown in the graph below.

Graph of θ (°C) against t (minutes): the curve starts on the positive θ-axis and increases, levelling off towards a horizontal dashed asymptote at θ = T
(a) Find the room temperature. [2 marks]
(b) Find the value of \(T\) [2 marks]
(c) The oven reaches a temperature of 86 °C one minute after it is switched on.
(i) Find the value of \(k\). [2 marks]
(ii) Find the time it takes for the temperature of the oven to be within 1 °C of its maximum. [2 marks]

June 2024 Paper 2 Q4

AQACurrent spec3 marksLogs & Exponentials

4 Use logarithms to solve the equation

\[5^{x-2} = 7^{1570}\]

Give your answer to two decimal places. [3 marks]

June 2024 Paper 3 Q3

AQACurrent spec1 markLogs & Exponentials

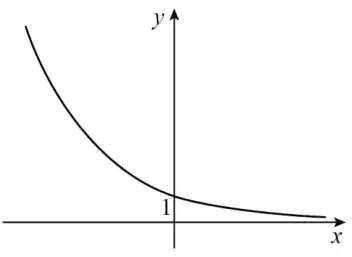
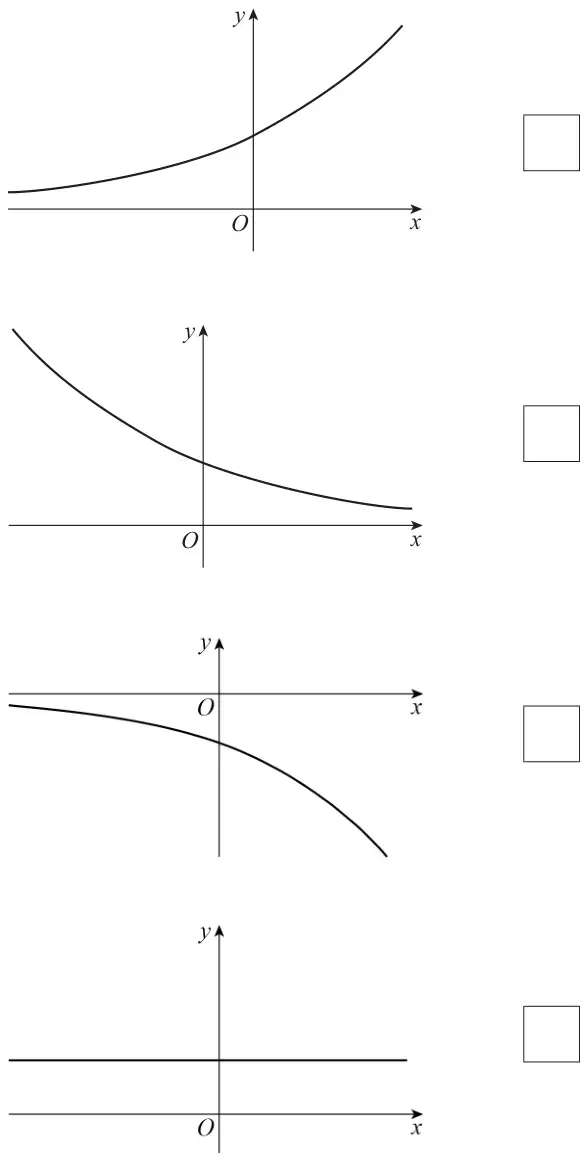
3 One of the graphs shown below cannot have an equation of the form

\[y = a^x \qquad \text{where } a \gt 0\]

Identify this graph.

Tick (✓) one box. [1 mark]

Four graphs, each with a tick box: 1st an increasing curve above the x-axis; 2nd a decreasing curve above the x-axis; 3rd a decreasing curve below the x-axis, crossing the negative y-axis; 4th a horizontal line above the x-axis

June 2023 Paper 1 Q6

AQACurrent spec5 marksLogs & Exponentials

6 Show that the equation

\[2\log_{10} x = \log_{10} 4 + \log_{10}(x + 8)\]

has exactly one solution.

Fully justify your answer. [5 marks]

June 2023 Paper 2 Q6

AQACurrent spec6 marksLogs & ExponentialsModelling

6 Victoria, a market researcher, believes the average weekly value, £\(V\) million, of online grocery sales in the UK has grown exponentially since 2009.

Victoria models the incomplete data, shown in the table, using the formula

\[V = a \times b^N\]

where \(N\) is the number of years since 2009 and \(a\) and \(b\) are constants.

Year20092010201120122013201420152016
Average Weekly Sales
£\(V\) million
56.474.586.997.7109.3141.9
(a) Victoria wishes to determine the values of \(a\) and \(b\) in her formula.

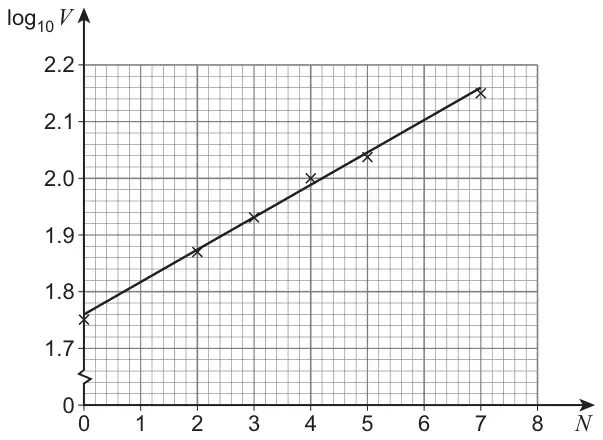
To do this she plots a graph of \(\log_{10} V\) against \(N\) and then draws a line of best fit as shown in the diagram below.

Graph of log10 V against N on grid paper, N from 0 to 8 and log10 V from 1.7 to 2.2, with plotted points at N = 0, 2, 3, 4, 5 and 7 and a straight line of best fit

The equation of Victoria’s line of best fit is

\[\log_{10} V = 0.057N + 1.76\]
(i) Use the equation of Victoria’s line of best fit to show that, correct to three significant figures, \(a = 57.5\) [1 mark]
(ii) Use the equation of Victoria’s line of best fit to find the value of \(b\)

Give your answer to three significant figures. [1 mark]

(b) According to Victoria’s model, state the yearly percentage increase in the average weekly value of online grocery sales. [1 mark]
(c)
(i) Use Victoria’s model to predict the average weekly value of online grocery sales in 2025. [2 marks]
(ii) Explain why the prediction made in part (c)(i) may be unreliable. [1 mark]

June 2023 Paper 3 Q5

5 A curve has equation \(y = 3\mathrm{e}^{2x}\)

Find the gradient of the curve at the point where \(y = 10\) [3 marks]

June 2023 Paper 1 Q3

3 The curve with equation \(y = \ln x\) is transformed by a stretch parallel to the \(x\)-axis with scale factor 2

Find the equation of the transformed curve.

Circle your answer. [1 mark]

  • \(y = \dfrac{1}{2}\ln x\)
  • \(y = 2\ln x\)
  • \(y = \ln\dfrac{x}{2}\)
  • \(y = \ln 2x\)

June 2022 Paper 2 Q9

AQACurrent spec4 marksLogs & Exponentials

9 Given that

\[\log_2 x^3 - \log_2 y^2 = 9\]

show that

\[x = Ay^p\]

where \(A\) is an integer and \(p\) is a rational number. [4 marks]

June 2022 Paper 3 Q7

AQACurrent spec7 marksLogs & ExponentialsModelling

7 A planet takes \(T\) days to complete one orbit of the Sun.

\(T\) is known to be related to the planet’s average distance \(d\), in millions of kilometres, from the Sun.

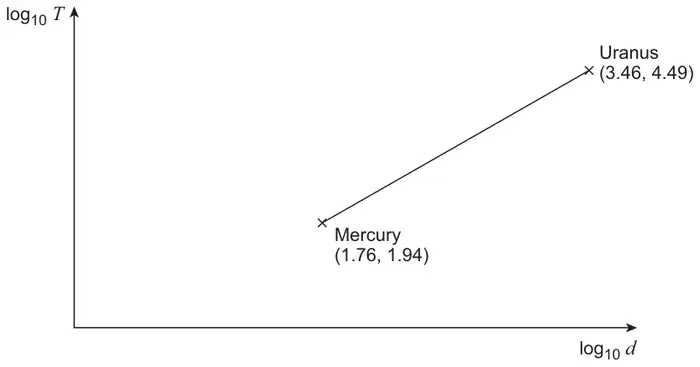
A graph of \(\log_{10} T\) against \(\log_{10} d\) is shown with data for Mercury and Uranus labelled.

Axes log10 T (vertical) against log10 d (horizontal) with a straight line joining Mercury at (1.76, 1.94) to Uranus at (3.46, 4.49)
(a)
(i) Find the equation of the straight line in the form\[\log_{10} T = a + b\,\log_{10} d\]where \(a\) and \(b\) are constants to be found. [3 marks]
(ii) Show that\[T = \mathrm{K}d^{\mathrm{n}}\]where K and n are constants to be found. [2 marks]
(b) Neptune takes approximately 60 000 days to complete one orbit of the Sun.

Use your answer to 7(a)(ii) to find an estimate for the average distance of Neptune from the Sun. [2 marks]

June 2022 Paper 1 Q3

3 The curve

\[y = \log_4 x\]

is transformed by a stretch, scale factor 2, parallel to the \(y\)-axis.

State the equation of the curve after it has been transformed.

Circle your answer. [1 mark]

  • \(y = \dfrac{1}{2}\log_4 x\)
  • \(y = 2\log_4 x\)
  • \(y = \log_4 2x\)
  • \(y = \log_8 x\)

June 2025 Paper 1 Q10

OCR ACurrent spec12 marksIntegrationLogs & Exponentials

10 The graph of \(y = \mathrm{e}^x\) can be transformed to the graph of \(y = \mathrm{e}^{2x-1}\) by a stretch parallel to the \(x\)-axis followed by a translation.

(a)
(i) State the scale factor of the stretch. [1]
(ii) Give full details of the translation. [2]

Alternatively the graph of \(y = \mathrm{e}^x\) can be transformed to the graph of \(y = \mathrm{e}^{2x-1}\) by a stretch parallel to the \(x\)-axis and a stretch parallel to the \(y\)-axis.

(b) State the scale factor of the stretch parallel to the \(y\)-axis. [1]

The point \(P\) lies on the curve \(y = \mathrm{e}^{2x-1}\) and has \(x\)-coordinate of \(\frac{1}{2}\).

(c) Show that the tangent to the curve \(y = \mathrm{e}^{2x-1}\) at \(P\) has equation \(y = 2x\). [4]
(d) Find the exact area enclosed by the curve \(y = \mathrm{e}^{2x-1}\), the tangent to the curve at \(P\) and the \(y\)-axis. [4]

June 2025 Paper 3 Q3

3

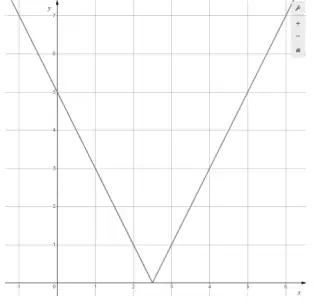
(a) Sketch the graph of \(y = |2x - 5|\) on the grid provided in the Printed Answer Booklet. [2]
(b) Solve the inequality \(|2x - 5| \lt 1\). [2]
(c) In this question you must show detailed reasoning.

Hence find all the possible integer values \(N\) that satisfy the inequality

\(\left|2\mathrm{e}^{0.1N} - 5\right| \lt 1\). [3]

June 2025 Paper 2 Q2

OCR ACurrent spec9 marksLogs & ExponentialsQuadratics

2

In this question you must show detailed reasoning.

Solve the following equations.

(a) \(\left(x^2 - 5\right)^{\frac{3}{2}} = 8\) [3]
(b) \(\mathrm{e}^{3y} = 2\) [2]
(c) \(x^4 - 3x^2 - 4 = 0\) [4]

June 2024 Paper 1 Q6

OCR ACurrent spec8 marksLogs & ExponentialsPolynomials

6 In this question you must show detailed reasoning.

The cubic polynomial \(\mathrm{f}(x)\) is defined by \(\mathrm{f}(x) = 4x^3 - 25x^2 - 58x + 16\).

(a) Show that \(x = \tfrac{1}{4}\) is a root of the equation \(\mathrm{f}(x) = 0\). [1]
(b) Hence express \(\mathrm{f}(x)\) as the product of a linear factor and a quadratic factor, with all terms in the factors having integer coefficients. [3]
(c) Solve the equation \(4\mathrm{e}^{3y} - 25\mathrm{e}^{2y} - 58\mathrm{e}^{y} + 16 = 0\), giving each root in the form \(y = k\ln 2\) where \(k\) is a constant. [4]

June 2023 Paper 1 Q11

OCR ACurrent spec12 marksLogs & ExponentialsSequences & Series

11 The owners of an online shop believe that their sales can be modelled by \(S = ab^t\), where \(a\) and \(b\) are both positive constants, \(S\) is the number of items sold in a month and \(t\) is the number of complete months since starting their online shop.

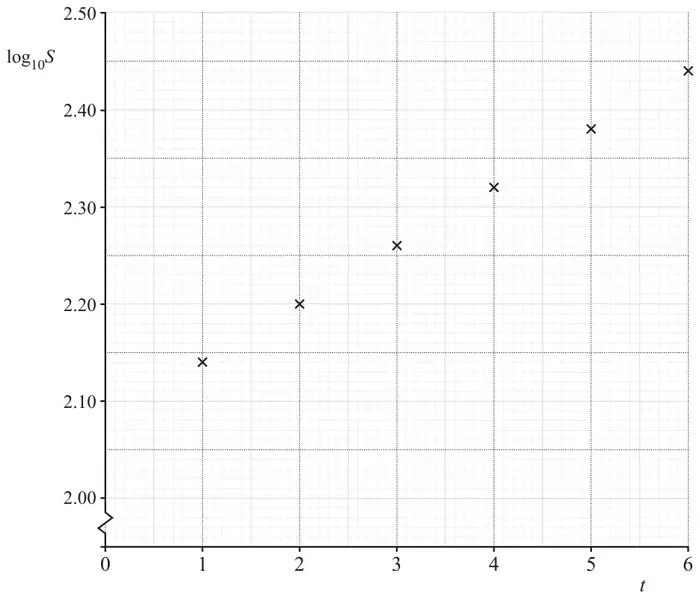
The sales for the first six months are recorded, and the values of \(\log_{10}S\) are plotted against \(t\) in the graph below. The graph is repeated in the Printed Answer Booklet.

Graph of log base 10 of S against t for t from 0 to 6, vertical axis from 2.00 to 2.50: six crosses at t = 1, 2, 3, 4, 5, 6 with log S = 2.14, 2.20, 2.26, 2.32, 2.38, 2.44, lying on a straight line
(a) Explain why the graph suggests that the given model is appropriate. [3]

The owners believe that \(a = 120\) and \(b = 1.15\) are good estimates for the parameters in the model.

(b) Show that the graph supports these estimates for the parameters. [2]
(c) Use the model \(S = 120 \times 1.15^t\) to predict the number of items sold in the seventh month after opening. [2]
(d)
(i) Use the model \(S = 120 \times 1.15^t\) to predict the number of months after opening when the total number of items sold after opening will first exceed 70 000. [4]
(ii) Comment on how reliable this prediction may be. [1]

June 2023 Paper 1 Q6

OCR ACurrent spec9 marksDifferentiationLogs & Exponentials

6 A curve has equation \(y = \mathrm{e}^{x^2 + 3x}\).

(a) Determine the \(x\)-coordinates of any stationary points on the curve. [4]
(b) Show that the curve is convex for all values of \(x\). [5]

June 2023 Paper 2 Q3

OCR ACurrent spec3 marksIntegrationLogs & Exponentials

3 In this question you must show detailed reasoning.

Find the exact area of the region enclosed by the curve \(y = \dfrac{1}{x + 2}\), the two axes and the line \(x = 2.5\). [3]

June 2023 Paper 1 Q2

OCR ACurrent spec8 marksLogs & ExponentialsQuadratics

2

(a)
(i) Show that \(\dfrac{1}{3 - 2\sqrt{x}} + \dfrac{1}{3 + 2\sqrt{x}}\) can be written in the form \(\dfrac{a}{b + cx}\), where \(a\), \(b\) and \(c\) are constants to be determined. [2]
(ii) Hence solve the equation \(\dfrac{1}{3 - 2\sqrt{x}} + \dfrac{1}{3 + 2\sqrt{x}} = 2\). [2]
(b) In this question you must show detailed reasoning.
Solve the equation \(2^{2y} - 7 \times 2^y - 8 = 0\). [4]

June 2023 Paper 3 Q1

OCR ACurrent spec3 marksLogs & Exponentials

1 Using logarithms, solve the equation

\(4^{2x + 1} = 5^x\),

giving your answer correct to 3 significant figures. [3]

June 2022 Paper 1 Q11

OCR ACurrent spec9 marksIntegrationLogs & Exponentials

11 The gradient function of a curve is given by \(\dfrac{\mathrm{d}y}{\mathrm{d}x} = \dfrac{3x^2\ln x}{\mathrm{e}^{3y}}\).

The curve passes through the point \((\mathrm{e}, 1)\).

(a) Find the equation of this curve, giving your answer in the form \(\mathrm{e}^{3y} = \mathrm{f}(x)\). [6]
(b) Show that, when \(x = \mathrm{e}^2\), the \(y\)-coordinate of this curve can be written as \(y = a + \tfrac{1}{3}\ln\left(b\mathrm{e}^3 + c\right)\), where \(a\), \(b\) and \(c\) are constants to be determined. [3]

June 2022 Paper 1 Q8

OCR ACurrent spec9 marksLogs & ExponentialsModelling

8

(a) Substance \(A\) is decaying exponentially such that its mass is \(m\) grams at time \(t\) minutes. Find the missing values of \(m\) and \(t\) in the following table.
\(t\)01050
\(m\)1250750450
[2]
(b) Substance \(B\) is also decaying exponentially, according to the model \(m = 160\mathrm{e}^{-0.055t}\), where \(m\) grams is its mass after \(t\) minutes.
(i) Determine the value of \(t\) for which the mass of substance \(B\) is half of its original mass. [3]
(ii) Determine the rate of decay of substance \(B\) when \(t = 15\). [3]
(c) State whether substance \(A\) or substance \(B\) is decaying at a faster rate, giving a reason for your answer. [1]

June 2022 Paper 3 Q6

OCR ACurrent spec8 marksIntegrationLogs & Exponentials

6 In this question you must show detailed reasoning.

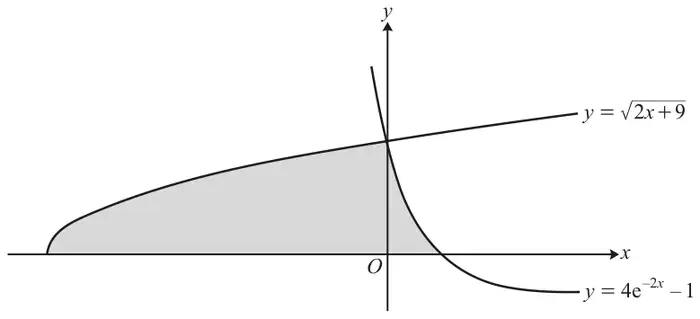
Curves y = √(2x + 9) and y = 4e^(−2x) − 1 meeting on the y-axis; the shaded region lies above the x-axis, under y = √(2x + 9) to the left of the y-axis and under y = 4e^(−2x) − 1 to the right of it

The diagram shows the curves \(y = \sqrt{2x + 9}\) and \(y = 4\mathrm{e}^{-2x} - 1\) which intersect on the \(y\)-axis. The shaded region is bounded by the curves and the \(x\)-axis.

Determine the area of the shaded region, giving your answer in the form \(p + q\ln 2\) where \(p\) and \(q\) are constants to be determined. [8]

June 2022 Paper 1 Q5

5

(a) The graph of \(y = 2^x\) can be transformed to the graph of \(y = 2^{x+4}\) either by a translation or by a stretch.
(i) Give full details of the translation. [2]
(ii) Give full details of the stretch. [2]
(b) In this question you must show detailed reasoning.
Solve the equation \(\log_2(8x) = 1 - \log_2(1 - x)\). [4]

June 2022 Paper 2 Q1

1 In this question you must show detailed reasoning.

Solve the following equations.

(a) \(\dfrac{x}{x + 1} - \dfrac{x - 1}{x + 2} = 0\) [3]
(b) \(\dfrac{8}{x^6} - \dfrac{7}{x^3} - 1 = 0\) [3]
(c) \(3^{x^2 - 7} = \dfrac{1}{243}\) [2]

October 2021 Paper 1 Q9

9 A particle moves in the \(x\)-\(y\) plane so that at time \(t\) seconds, where \(t \geqslant 0\), its coordinates are given by
\(x = \mathrm{e}^{2t} - 4\mathrm{e}^t + 3\), \(y = 2\mathrm{e}^{-3t}\).

(a) Explain why the path of the particle never crosses the \(x\)-axis. [1]
(b) Determine the exact values of \(t\) when the path of the particle intersects the \(y\)-axis. [2]
(c) Show that \(\dfrac{\mathrm{d}y}{\mathrm{d}x} = \dfrac{3}{2\mathrm{e}^{4t} - \mathrm{e}^{5t}}\). [4]
(d) Hence find the coordinates of the particle when its path is parallel to the \(y\)-axis. [3]

October 2021 Paper 1 Q4

OCR ACurrent spec7 marksLogs & ExponentialsPolynomials

4 In this question you must show detailed reasoning.

The cubic polynomial \(\mathrm{f}(x)\) is defined by \(\mathrm{f}(x) = 2x^3 - 3x^2 - 11x + 6\).

(a) Use the factor theorem to show that \((2x - 1)\) is a factor of \(\mathrm{f}(x)\). [1]
(b) Express \(\mathrm{f}(x)\) in fully factorised form. [3]
(c) Hence solve the equation \(2 \times 8^y - 3 \times 4^y - 11 \times 2^y + 6 = 0\). [3]

June 2025 Paper 1 Q9

OCR MEICurrent spec6 marksLogs & ExponentialsModelling

9 The table below shows information about four of the moons of the planet Jupiter. The semi-major axis is the greatest distance that each moon reaches from the centre of its orbit around Jupiter. The orbital period is the time in Earth days that it takes to orbit the planet.

MoonSemi-major axis (km)Orbital period (Earth days)
Io421 8001.7627
Europa671 1003.5255
Ganymede1 070 4007.1556
Callisto1 882 70016.690

A student uses the equation \(T = kd^n\) to model the orbital period of Jupiter’s moons, where \(T\) is the orbital period in Earth days, \(d\) is the semi-major axis in km, and \(k\) and \(n\) are constants.

(a) Show that the equation \(T = kd^n\) can be rewritten in the form \(\log_{10}T = \log_{10}k + n\log_{10}d\). [1]

The student uses graph drawing software to plot \(\log_{10}T\) against \(\log_{10}d\). They find that the line of best fit for the data has gradient 1.504 and intercepts the \(\log_{10}T\) axis at \(-8.215\).

(b) Determine values of \(k\) and \(n\) that are consistent with this information. [3]

The student uses their equation to predict the orbital period for another moon of Jupiter called Thebe which has a semi-major axis of 221 900 km. They look up the value in an online encyclopedia and find it is 0.6761 Earth days.

(c) Comment on the suitability of the student’s equation to model the orbital period of Thebe. [2]

June 2025 Paper 3 Q7

OCR MEICurrent spec9 marksLogs & ExponentialsModelling

7 A group of scientists is studying how a population of insects grows in the laboratory.
At the start of the study, there are 48 insects.
At the end of the first month, there are 72 insects.
At the end of the second month, there are 108 insects.
The group develops two models, \(P\) and \(Q\), to model the population.

The first model, \(P\), is of the form \(P_{t+1} = kP_t\), where \(k\) is a constant.
\(P_0\) denotes the number of insects at the start of the study.
\(P_t\) denotes the number of insects at the end of month \(t\), \(t \geqslant 1\).
Model \(P\) fits the data for \(t = 0\), 1 and 2 exactly.

(a) Find the value of \(k\). [1]
(b) Use model \(P\) to predict the number of insects at the end of month 3. [1]

The second model, \(Q\), is of the form \(Q = 48\mathrm{e}^{0.4t}\), where \(t\) is the time, in months, after the start of the study and \(Q\) denotes the number of insects at time \(t\).

(c)
(i) By considering the given data on the number of insects when \(t = 1\) and \(t = 2\), assess whether model \(Q\) fits the data for these times. [2]
(ii) Show that model \(Q\) implies that the rate of growth of the population is proportional to the population at any time \(t\). [2]
(iii) Show that, for integer values of \(t\) with \(t > 1\), the population predicted by model \(Q\) will always be lower than the population predicted by model \(P\). [3]

June 2025 Paper 3 Q5

OCR MEICurrent spec10 marksLogs & ExponentialsNumerical Methods

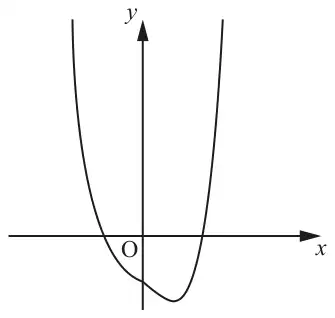
5 The diagram shows the curve with equation \(y = x^4 - 2^x\), for values of \(x\) close to zero.

Curve y = x^4 - 2^x near the origin: crosses the x-axis once to the left of O and once to the right, with a minimum just right of the y-axis below the x-axis
(a) In this question you must show detailed reasoning.
Show that the equation \(x^4 - 2^x = 0\) has a root which lies between 1 and 2. [2]
(b) Show that the equation \(x^4 - 2^x = 0\) can be written in the form \(x = 2^{0.25x}\) for positive values of \(x\). [1]
(c) Use the iterative formula \(x_{n+1} = 2^{0.25x_n}\) with \(x_0 = 0.4\) to determine a root of \(x^4 - 2^x = 0\) to 2 decimal places. [2]
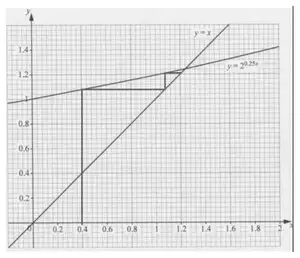
(d) The diagram in the Printed Answer Booklet shows the line with equation \(y = x\) and the curve with equation \(y = 2^{0.25x}\).
Sketch a cobweb or staircase diagram, on the diagram in the Printed Answer Booklet, for the iterative formula \(x_{n+1} = 2^{0.25x_n}\) starting with \(x_0 = 0.4\). Show at least two iterations. [2]
(e) Show that the equation \(x^4 - 2^x = 0\) can be written in the form \(x = 4\log_2 x\) for positive values of \(x\). [1]
(f) In this question you must show detailed reasoning.
Show that the iteration \(x_{n+1} = 4\log_2 x_n\), with \(x_0 = 1\), will not find a root of \(x^4 - 2^x = 0\). [2]

June 2024 Paper 1 Q10

OCR MEICurrent spec10 marksLogs & ExponentialsModelling

10 Zac is measuring the growth of a culture of bacteria in a laboratory. The initial area of the culture is \(8\ \text{cm}^2\). The area one day later is \(8.8\ \text{cm}^2\).

At first, Zac uses a model of the form \(A = a + bt\), where \(A\ \text{cm}^2\) is the area \(t\) days after he begins measuring and \(a\) and \(b\) are constants.

(a) Find the values of \(a\) and \(b\) that best model the initial area and the area one day later. [2]
(b) Calculate the value of \(t\) for which the model predicts an area of \(15\ \text{cm}^2\). [1]
(c) Zac notices the area covered by the culture increases by 10% each day.
Explain why this model may not be suitable after the first day. [1]

Zac decides to use a different model for \(A\). His new model is \(A = P\mathrm{e}^{kt}\), where \(P\) and \(k\) are constants.

(d) Find the values of \(P\) and \(k\) that best model the initial area and the area one day later. [3]
(e) Calculate the value of \(t\) for which the area reaches \(15\ \text{cm}^2\) according to this model. [2]
(f) Explain why this model may not be suitable for large values of \(t\). [1]

June 2024 Paper 1 Q5

5

(a) Make \(y\) the subject of the formula \(\log_{10}(y-k) = x\log_{10}2\), where \(k\) is a positive constant. [2]
(b) Sketch the graph of \(y\) against \(x\). [3]

June 2024 Paper 2 Q2

2 The equation of a curve is \(y = \mathrm{e}^x\). The curve is subject to a translation \(\begin{pmatrix}3\\0\end{pmatrix}\) and a stretch scale factor 2 parallel to the \(y\)-axis.

Write down the equation of the new curve. [2]

June 2023 Paper 3 Q15

OCR MEICurrent spec2 marksLogs & ExponentialsSequences & Series

15

The questions in this section refer to the article on the Insert. You should read the article before attempting the questions.

The relevant parts of the article “Approximating series” are reproduced below; the line numbers are those printed on the Insert.

Line 34
This simplifies to \(\displaystyle\sum_{r=1}^{n}\frac{1}{r} \approx \ln n + \frac{13}{24} + \frac{6n+5}{12n(n+1)}\).

The expression given in line 34 is used to calculate \(\displaystyle\sum_{r=1}^{6}\frac{1}{r}\).

Show that the error in the result is less than 1.5% of the true value. [2]

June 2023 Paper 1 Q14

OCR MEICurrent spec6 marksLogs & ExponentialsSequences & Series

14

(a) Use the laws of logarithms to show that \(\log_{10}200 - \log_{10}20\) is equal to 1. [2]

The first three terms of a sequence are \(\log_{10}20,\ \log_{10}200,\ \log_{10}2000\).

(b) Show that the sequence is arithmetic. [2]
(c) Find the exact value of the sum of the first 50 terms of this sequence. [2]

June 2023 Paper 3 Q14

OCR MEICurrent spec3 marksIntegrationLogs & Exponentials

14

The questions in this section refer to the article on the Insert. You should read the article before attempting the questions.

The relevant parts of the article “Approximating series” are reproduced below; the line numbers are those printed on the Insert.

Line 31
Applying Euler’s approximate summation formula to the harmonic series

Lines 32–33
Using Euler’s approximate summation for the harmonic series gives
\(\displaystyle\sum_{r=1}^{n}\frac{1}{r} \approx \int_1^n \frac{1}{x}\,\mathrm{d}x + \frac{1}{2}\left(\frac{1}{n} + 1\right) + \frac{1}{12}\left(1 - \frac{1}{2}\right) - \frac{1}{12}\left(\frac{1}{n} - \frac{1}{n+1}\right)\).

Line 34
This simplifies to \(\displaystyle\sum_{r=1}^{n}\frac{1}{r} \approx \ln n + \frac{13}{24} + \frac{6n+5}{12n(n+1)}\).

Show that the expression given in line 33 simplifies to \(\displaystyle\sum_{r=1}^{n}\frac{1}{r} \approx \ln n + \frac{13}{24} + \frac{6n+5}{12n(n+1)}\), as given in line 34. [3]

June 2023 Paper 1 Q11

OCR MEICurrent spec10 marksLogs & ExponentialsModelling

11 The height \(h\) cm of a sunflower plant \(t\) days after planting the seed is modelled by \(h = a + b\ln t\) for \(t \geqslant 9\), where \(a\) and \(b\) are constants. The sunflower is 10 cm tall 10 days after planting and 200 cm tall 85 days after planting.

(a)
(i) Show that the value of \(b\) which best models these values is 88.8 correct to 3 significant figures. [2]
(ii) Find the corresponding value of \(a\). [1]
(b)
(i) Explain why the model is not suitable for small positive values of \(t\). [1]
(ii) Explain why the model is not suitable for very large positive values of \(t\). [1]
(c) Show that the model indicates that the sunflower grows to 1 m in height in less than half the time it takes to grow to 2 m. [2]
(d) Find the value of \(t\) for which the rate of growth is 3 cm per day. [3]

June 2023 Paper 1 Q9

OCR MEICurrent spec10 marksIntegrationLogs & Exponentials

9 The gradient of a curve is given by \(\dfrac{\mathrm{d}y}{\mathrm{d}x} = \mathrm{e}^{x} - 4\mathrm{e}^{-x}\).

(a) Show that the \(x\)-coordinate of any point on the curve at which the gradient is 3 satisfies the equation \(\left(\mathrm{e}^{x}\right)^2 - 3\mathrm{e}^{x} - 4 = 0\). [2]
(b) Hence show that there is only one point on the curve at which the gradient is 3, stating the exact value of its \(x\)-coordinate. [3]
(c) The curve passes through the point \((0, 0)\).
Show that when \(x = 1\) the curve is below the \(x\)-axis. [5]

June 2023 Paper 3 Q9

OCR MEICurrent spec9 marksLogs & ExponentialsModelling

9 A small country started using solar panels to produce electrical energy in the year 2000. Electricity production is measured in megawatt hours (MWh).

For the period from 2000 to 2009, the annual electrical energy produced using solar panels can be modelled by the equation \(P = 0.3\mathrm{e}^{0.5t}\), where \(P\) is the annual amount of electricity produced in MWh and \(t\) is the time in years after the year 2000.

(a) According to this model, find the amount of electricity produced using solar panels in each of the following years.
(i) 2000 [1]
(ii) 2009 [1]
(b) Give a reason why the model is unlikely to be suitable for predicting the annual amount of electricity produced using solar panels in the year 2025. [1]

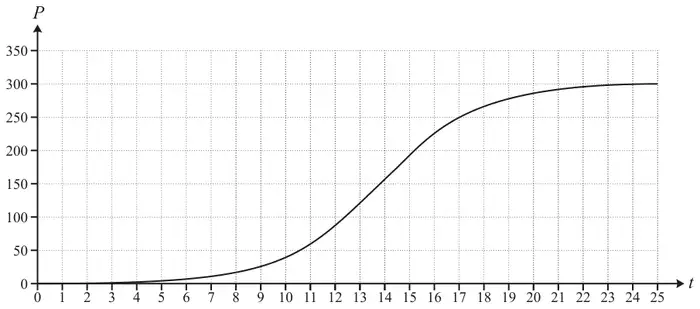
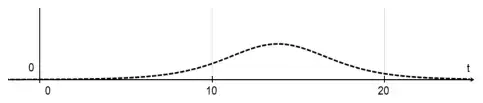
An alternative model is suggested; the curve representing this model is shown in Fig. 9.

Fig. 9: graph of P (0 to 350) against t (0 to 25) on a grid; an S-shaped curve rising slowly from near 0, steepest around t = 14, levelling off at about 300
Fig. 9
(c) Explain how the graph shows that the alternative model gives a value for the amount of electricity produced in 2009 that is consistent with the original model. [1]
(d)
(i) On the axes given in the Printed Answer Booklet, sketch the gradient function of the model shown in Fig. 9. [2]
(ii) State approximately the value of \(t\) at the point of inflection in Fig. 9. [1]
(iii) Interpret the significance of the point of inflection in the context of the model. [1]
(e) State approximately the long term value of the annual amount of electricity produced using solar panels according to the model represented in Fig. 9. [1]

June 2022 Paper 1 Q14

OCR MEICurrent spec13 marksLogs & ExponentialsModelling

14 Alex places a hot object into iced water and records the temperature \(\theta\,{}^\circ\mathrm{C}\) of the object every minute. The temperature of an object \(t\) minutes after being placed in iced water is modelled by \(\theta = \theta_0\mathrm{e}^{-kt}\) where \(\theta_0\) and \(k\) are constants whose values depend on the characteristics of the object.

The temperature of Alex’s object is \(82\,{}^\circ\mathrm{C}\) when it is placed into the water. After 5 minutes the temperature is \(27\,{}^\circ\mathrm{C}\).

(a) Find the values of \(\theta_0\) and \(k\) that best model the data. [3]
(b) Explain why the model may not be suitable in the long term if Alex does not top up the ice in the water. [1]
(c) Show that the model with the values found in part (a) can be written as \(\ln\theta = a - bt\) where \(a\) and \(b\) are constants to be determined. [2]

Ben places a different object into iced water at the same time as Alex. The model for Ben’s object is \(\ln\theta = 3.4 - 0.08t\).

(d) Determine each of the following:
  • the initial temperature of Ben’s object
  • the rate at which Ben’s object is cooling initially.
[4]
(e) According to the models, there is a time at which both objects have the same temperature.
Find this time and the corresponding temperature. [3]

June 2022 Paper 2 Q3

3

(a) On the axes in the Printed Answer Booklet, sketch the curve with equation \(y = 3 \times 0.4^x\). [3]
(b) Given that \(3 \times 0.4^x = 0.8\), determine the value of \(x\) correct to 3 significant figures. [3]

October 2021 Paper 3 Q5

OCR MEICurrent spec8 marksLogs & ExponentialsModelling

5

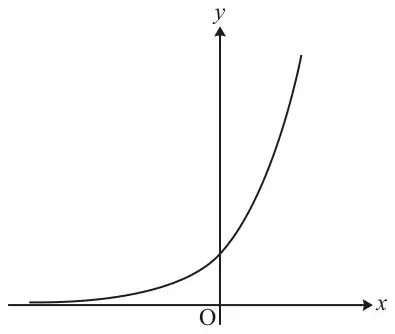
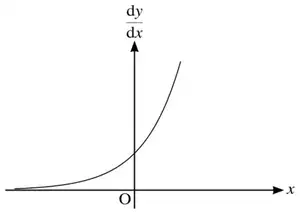
(a) The diagram shows the curve \(y = \mathrm{e}^x\).
Curve y = e^x passing through (0, 1)
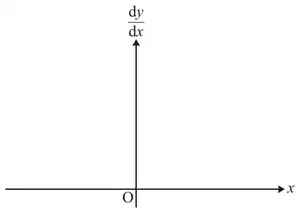
On the axes in the Printed Answer Booklet, sketch graphs of
(i) \(\dfrac{\mathrm{d}y}{\mathrm{d}x}\) against \(x\), [1]
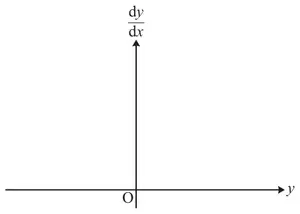
Blank axes from the Printed Answer Booklet: dy/dx on the vertical axis, x on the horizontal axis, origin O
Axes printed in the Printed Answer Booklet for (a)(i)
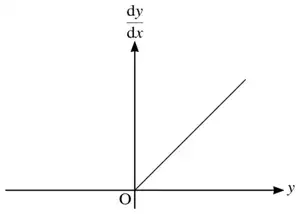
(ii) \(\dfrac{\mathrm{d}y}{\mathrm{d}x}\) against \(y\). [2]
Blank axes from the Printed Answer Booklet: dy/dx on the vertical axis, y on the horizontal axis, origin O
Axes printed in the Printed Answer Booklet for (a)(ii)
(b) Wolves were introduced to Yellowstone National Park in 1995. The population of wolves, \(y\), is modelled by the equation \(y = A\mathrm{e}^{kt}\), where \(A\) and \(k\) are constants and \(t\) is the number of years after 1995.
(i) Give a reason why this model might be suitable for the population of wolves. [1]
(ii) When \(t = 0\), \(y = 21\) and when \(t = 1\), \(y = 51\).
Find values of \(A\) and \(k\) consistent with the data. [3]
(iii) Give a reason why the model will not be a good predictor of wolf populations many years after 1995. [1]

October 2020 Paper 3 Q12

OCR MEICurrent spec8 marksDifferentiationLogs & Exponentials

12

The questions in this section refer to the article on the Insert. You should read the article before attempting the questions.

The relevant parts of the article “Which is bigger?” are reproduced below; the line numbers are those printed on the Insert.

Line 43
Using a similar method, it can be shown that \(\mathrm{e}^a > a^{\mathrm{e}}\) for any positive number \(a \neq \mathrm{e}\).

Lines 44–45
An alternative method for showing that \(\mathrm{e}^a > a^{\mathrm{e}}\) for any positive number \(a\) is to show that the only stationary point on the curve \(y = \dfrac{\ln x}{x}\) (a maximum) occurs where \(x = \mathrm{e}\).

(a) Show that the only stationary point on the curve \(y = \dfrac{\ln x}{x}\) occurs where \(x = \mathrm{e}\), as given in line 45. [3]
(b) Show that the stationary point is a maximum. [3]
(c) It follows from part (b) that, for any positive number \(a\) with \(a \neq \mathrm{e}\),
\(\dfrac{\ln\mathrm{e}}{\mathrm{e}} > \dfrac{\ln a}{a}\).
Use this fact to show that \(\mathrm{e}^a > a^{\mathrm{e}}\). [2]

October 2020 Paper 3 Q11

OCR MEICurrent spec2 marksDifferentiationLogs & Exponentials

11

The questions in this section refer to the article on the Insert. You should read the article before attempting the questions.

The relevant parts of the article “Which is bigger?” are reproduced below; the line numbers are those printed on the Insert.

Line 38
\(\ln\pi < \dfrac{\pi}{\mathrm{e}}\)

Line 39
\(\mathrm{e}^x\) is an increasing function for all values of \(x\)

Line 40
hence \(\pi < \mathrm{e}^{\frac{\pi}{\mathrm{e}}}\)

Lines 41–42
Assuming that the usual rules of indices apply to irrational powers of irrational numbers, raising both sides of the inequality to the power e gives the desired result.

Show that \(\mathrm{e}^x\) is an increasing function for all values of \(x\), as stated in line 39. [2]

October 2020 Paper 3 Q10

OCR MEICurrent spec2 marksIntegrationLogs & Exponentials

10

The questions in this section refer to the article on the Insert. You should read the article before attempting the questions.

The relevant parts of the article “Which is bigger?” are reproduced below; the line numbers are those printed on the Insert.

Lines 31–34
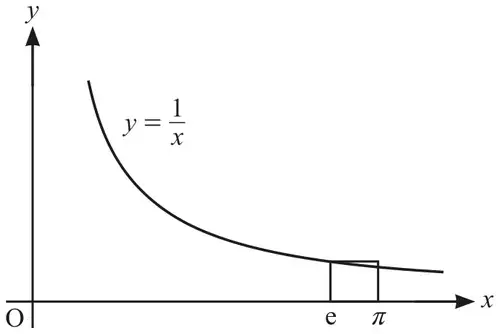
An indirect method, using calculus, enables us to prove that \(\mathrm{e}^{\pi}\) is larger than \(\pi^{\mathrm{e}}\). Fig. C2 shows the curve \(y = \dfrac{1}{x}\) in the first quadrant together with the rectangle with vertices at the points \((\mathrm{e}, 0)\), \(\left(\mathrm{e}, \dfrac{1}{\mathrm{e}}\right)\), \(\left(\pi, \dfrac{1}{\mathrm{e}}\right)\) and \((\pi, 0)\). We use the fact that the area under the curve between e and \(\pi\) is less than the area of this rectangle.

Fig. C2: the curve y = 1/x in the first quadrant, with a narrow rectangle on the x-axis between x = e and x = π whose top edge passes through the curve at x = e
Fig. C2

Line 35
The area of the rectangle is \(\dfrac{1}{\mathrm{e}}(\pi - \mathrm{e})\)

Line 36
\(\displaystyle\int_{\mathrm{e}}^{\pi} \frac{1}{x}\,\mathrm{d}x < \frac{1}{\mathrm{e}}(\pi - \mathrm{e})\)

Line 37
\(\ln\pi - 1 < \dfrac{\pi}{\mathrm{e}} - 1\)

Line 38
\(\ln\pi < \dfrac{\pi}{\mathrm{e}}\)

In this question you must show detailed reasoning.

Show that \(\displaystyle\int_{\mathrm{e}}^{\pi} \frac{1}{x}\,\mathrm{d}x = \ln\pi - 1\) as given in line 37. [2]

October 2020 Paper 3 Q6

OCR MEICurrent spec12 marksLogs & ExponentialsModelling

6

(a)
(i) Write down the derivative of \(\mathrm{e}^{kx}\), where \(k\) is a constant. [1]
(ii) A business has been running since 2009. They sell maths revision resources online.
Give a reason why an exponential growth model might be suitable for the annual profits for the business. [1]

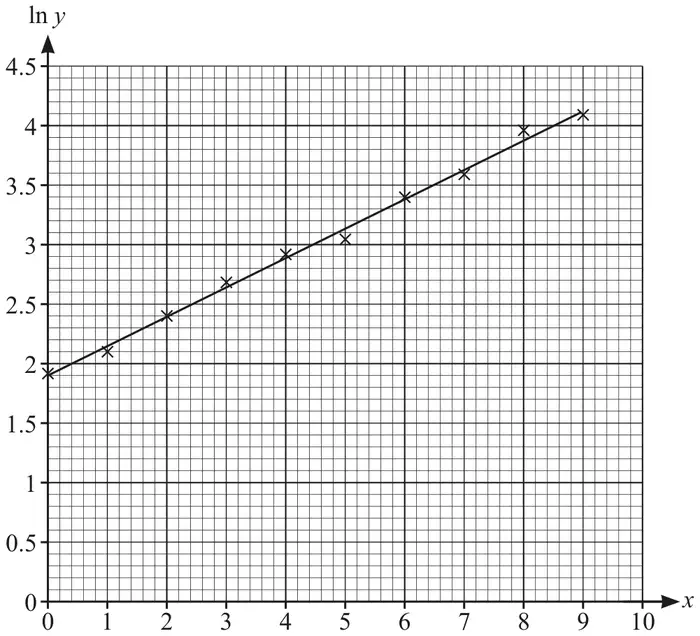
Fig. 6 shows the relationship between the annual profits of the business in thousands of pounds (\(y\)) and the time in years after 2009 (\(x\)). The graph of \(\ln y\) plotted against \(x\) is approximately a straight line.

Fig. 6: graph of ln y (0 to 4.5) against x (0 to 10) on graph paper; ten plotted crosses at x = 0 to 9 lie close to a straight line from (0, 1.9) to about (9, 4.1)
Fig. 6
(b) Show that the straight line is consistent with a model of the form \(y = A\mathrm{e}^{kx}\), where \(A\) and \(k\) are constants. [2]
(c) Estimate the values of \(A\) and \(k\). [4]
(d) Use the model to predict the profit in the year 2020. [3]
(e) How reliable do you expect the prediction in part (d) to be? Justify your answer. [1]