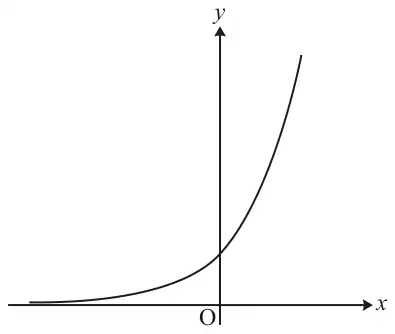
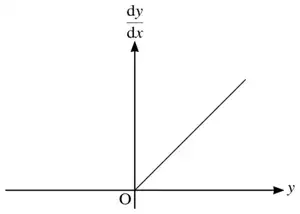
(a) The diagram shows the curve \(y = \mathrm{e}^x\).On the axes in the Printed Answer Booklet, sketch graphs of
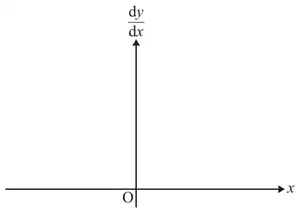
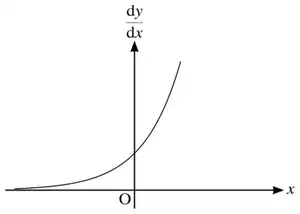
(i) \(\dfrac{\mathrm{d}y}{\mathrm{d}x}\) against \(x\), [1]
Axes printed in the Printed Answer Booklet for (a)(i)
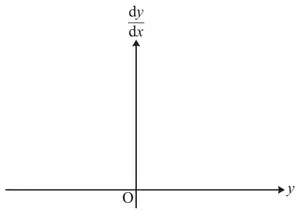
(ii) \(\dfrac{\mathrm{d}y}{\mathrm{d}x}\) against \(y\). [2]
Axes printed in the Printed Answer Booklet for (a)(ii)
(b) Wolves were introduced to Yellowstone National Park in 1995. The population of wolves, \(y\), is modelled by the equation \(y = A\mathrm{e}^{kt}\), where \(A\) and \(k\) are constants and \(t\) is the number of years after 1995.
(i) Give a reason why this model might be suitable for the population of wolves. [1]
(ii) When \(t = 0\), \(y = 21\) and when \(t = 1\), \(y = 51\). Find values of \(A\) and \(k\) consistent with the data. [3]
(iii) Give a reason why the model will not be a good predictor of wolf populations many years after 1995. [1]
Mark scheme (a)
Scheme
Marks
AO
(i)
B1
1.2
(ii)
M1 A1
2.2a 2.2a
[3]
Notes
(ii) M1: Straight line (+ve gradient) through origin (may stop short of origin)
A1: First quadrant only
Mark scheme (b)
Scheme
Marks
AO
(i) Suitable reason e.g. • Reasonable to assume population growth is proportional to population • Populations are often modelled by exponential growth
E1
3.3
[1]
(ii) \(A = 21\)
B1
3.4
\(51 = 21\mathrm{e}^k\)
M1
3.4
\(k = \ln\dfrac{51}{21} = \ln\dfrac{17}{7} \approx 0.887\) or better
A1
1.1
[3]
(iii) Suitable reason, e.g. • Population cannot keep growing • The wolves will run out of food if the population gets too big
E1
3.5b
[1]
Notes
(i) E1: Allow e.g. wolves give birth to more wolves than they started with Do not allow e.g. population is proportional to time
(ii) A1: Allow 0.89
(iii) E1: Allow e.g. lack or resources or deforestation
We'd like to use Google Analytics cookies to count visits and see which pages help most. They're optional, and the site works exactly the same either way. Privacy policy