Modelling

Edexcel

AQA

OCR A

OCR MEI

June 2025 Paper 1 Q11

EdexcelCurrent spec8 marksLogs & ExponentialsModelling

11.

In this question you must show all stages of your working.

Solutions relying entirely on calculator technology are not acceptable.

The value of a car, £\(V\), is modelled by the equation

\[V = 1500 + A\,\mathrm{e}^{-kt}\]

where \(A\) and \(k\) are positive constants and \(t\) is the age of the car in years.

Given that

  • the initial value of the car was £20 000
  • the value of the car was £12 000 when it was 2.5 years old
(a) find a complete equation for the model, giving the exact value of \(A\) and the value of \(k\) to 3 significant figures. (4)
(b) Show that the rate of change in the value of the car can be expressed in the form\[-k(V - 1500)\] (3)
(c) State a limitation of this model. (1)

June 2025 Paper 2 Q11

EdexcelCurrent spec11 marksModellingQuadratics

11. A company is trying to determine the most profitable selling price for a new toy.

Given that

  • if the selling price of each toy is £30, the company expects to sell 1500 toys in one year
  • if the selling price of each toy is £50, the company expects to sell 300 toys in one year

Using a linear model, with \(y\) being the expected number of toys sold in one year and \(x\) pounds being the selling price of the toy,

(a) find an equation for \(y\) in terms of \(x\). (3)

Given that

  • the cost of making each toy is £10
  • the company has additional costs of £8 000 per year
(b) show that, according to the model, the yearly profit, \(P\), in thousands of pounds, is given by\[P = -0.06x^2 + 3.9x - 41\] (3)

Use the model given in part (b) to answer parts (c), (d) and (e).

Given that the company wishes to make a profit on sales of the toy,

(c) find the range of possible selling prices of the toy. (2)
(d) Hence, or otherwise, deduce the selling price of the toy that maximises the profit. (1)

In one particular year, the company sold the toy for £35 and made £21 750 profit.

(e) Use this information to evaluate the suitability of the model. (2)

June 2025 Paper 2 Q10

EdexcelCurrent spec9 marksIntegrationModelling

10. Water flows at a constant rate into a large container.

There is a tap at the bottom of the container.

At time \(t\) hours after the tap was opened

  • the volume of water in the container is \(V\,\mathrm{m}^3\)
  • water is flowing into the container at a constant rate of \(0.45\,\mathrm{m}^3\) per hour
  • water is leaving the container through the tap at a rate of \(0.3V\,\mathrm{m}^3\) per hour
(a) Show that\[20\frac{\mathrm{d}V}{\mathrm{d}t} = 9 - 6V\] (2)

Given that when the tap was opened, there was \(0.25\,\mathrm{m}^3\) of water in the container,

(b) solve the differential equation to show that\[V = P - Q\mathrm{e}^{-kt}\]where \(P\), \(Q\) and \(k\) are positive constants to be found. (5)

Given that

  • the capacity of the container is \(2\,\mathrm{m}^3\)
  • the tap remains open
  • the water continues to flow into the tank at the same rate
(c) determine whether the container will ever become full, giving a reason for your answer. (2)

June 2025 Paper 2 Q9

EdexcelCurrent spec8 marksLogs & ExponentialsModelling

9.

In this question you must show all stages of your working.

Solutions relying entirely on calculator technology are not acceptable.

A new type of car is released for sale.

The total number of this type of car sold, \(N\), in a particular region, \(t\) months after the cars were released for sale, is modelled by the equation\[N = 5000 - 5000\mathrm{e}^{-0.075t} \qquad t \geqslant 0\]

Use the equation of the model to answer parts (a), (b), (c) and (d).

(a) Find the total number of cars sold in the first 3 months. (2)

Given that \(N = 3000\) when \(t = T\)

(b) find the value of \(T\) giving the answer to 2 decimal places. (3)
(c) Find the rate of increase in the total number of cars sold when \(t = 3\), giving the answer to 3 significant figures. (2)

After a marketing campaign, the total number of cars sold is expected to rise and have an upper limit of 6500

(d) Using this information, suggest one refinement to the model. (1)

June 2025 Paper 1 Q6

EdexcelCurrent spec7 marksModellingQuadratics

6. A scientist is monitoring the flight of sea birds after they leave their nests on a cliff.

The height above the sea, \(h\) metres, of one of the birds is modelled by the equation

\[h = A - B\,t^{1.5} \qquad\qquad h \geqslant 0 \qquad 0 \leqslant t \leqslant T\]

where \(t\) seconds is the time after the bird leaves its nest and \(A\), \(B\) and \(T\) are positive constants.

Given that

  • the bird was 17.6 m above the sea exactly 4 seconds after leaving its nest
  • the bird was 11.9 m above the sea exactly 9 seconds after leaving its nest
(a) find a complete equation for the model. (4)

Find, according to the model,

(b) the height of the bird’s nest above the sea, (1)
(c) the limitation on the value of \(T\). (2)

June 2024 Paper 1 Q14

EdexcelCurrent spec9 marksIntegrationModelling

14. A balloon is being inflated.

In a simple model,

  • the balloon is modelled as a sphere
  • the rate of increase of the radius of the balloon is inversely proportional to the square root of the radius of the balloon

At time \(t\) seconds, the radius of the balloon is \(r\) cm.

(a) Write down a differential equation to model this situation. (1)

At the instant when \(t = 10\)

  • the radius is 16 cm
  • the radius is increasing at a rate of \(0.9\text{ cm s}^{-1}\)
(b) Solve the differential equation to show that\[r^{\frac{3}{2}} = 5.4t + 10\] (5)
(c) Hence find the radius of the balloon when \(t = 20\)
Give your answer to the nearest millimetre. (2)
(d) Suggest a limitation of the model. (1)

June 2024 Paper 2 Q13

EdexcelCurrent spec9 marksLogs & ExponentialsModelling

13. The world human population, \(P\) billions, is modelled by the equation

\[P = ab^t\]

where \(a\) and \(b\) are constants and \(t\) is the number of years after 2004

Using the estimated population figures for the years from 2004 to 2007, a graph is plotted of \(\log_{10}P\) against \(t\).

The points lie approximately on a straight line with

  • gradient 0.0054
  • intercept 0.81 on the \(\log_{10}P\) axis
(a) Estimate, to 3 decimal places, the value of \(a\) and the value of \(b\). (4)

In the context of the model,

(b)
(i) interpret the value of the constant \(a\),
(ii) interpret the value of the constant \(b\). (2)
(c) Use the model to estimate the world human population in 2030 (2)
(d) Comment on the reliability of the answer to part (c). (1)

June 2024 Paper 1 Q12

EdexcelCurrent spec11 marksModellingTrigonometry

12.

(a) Express \(140\cos\theta - 480\sin\theta\) in the form \(K\cos(\theta + \alpha)\)
where \(K \gt 0\) and \(0 \lt \alpha \lt 90^\circ\)
State the value of \(K\) and give the value of \(\alpha\), in degrees, to 2 decimal places. (3)

A scientist studies the number of rabbits and the number of foxes in a wood for one year.

The number of rabbits, \(R\), is modelled by the equation

\[R = A + 140\cos(30t)^\circ - 480\sin(30t)^\circ\]

where \(t\) months is the time after the start of the year and \(A\) is a constant.

Given that, during the year, the maximum number of rabbits in the wood is 1500

(b)
(i) find a complete equation for this model.
(ii) Hence write down the minimum number of rabbits in the wood during the year according to the model. (2)

The actual number of rabbits in the wood is at its minimum value in the middle of April.

(c) Use this information to comment on the model for the number of rabbits. (2)

The number of foxes, \(F\), in the wood during the same year is modelled by the equation

\[F = 100 + 70\sin(30t + 70)^\circ\]

The number of foxes is at its minimum value after \(T\) months.

(d) Find, according to the models, the number of rabbits in the wood at time \(T\) months. (4)

June 2024 Paper 2 Q10

EdexcelCurrent spec6 marksModellingParametric Equations

10.

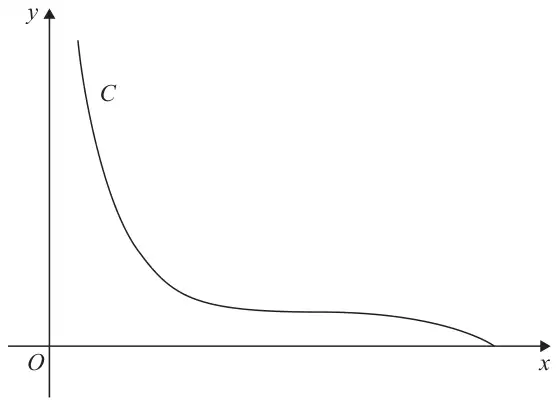
Figure 4: sketch of curve C, decreasing steeply from near the y-axis, levelling out, then meeting the positive x-axis
Figure 4

Figure 4 shows a sketch of the curve \(C\) with parametric equations

\[x = (t+3)^2 \qquad y = 1 - t^3 \qquad -2 \leqslant t \leqslant 1\]

The point \(P\) with coordinates \((4, 2)\) lies on \(C\).

(a) Using parametric differentiation, show that the tangent to \(C\) at \(P\) has equation\[3x + 4y = 20\] (5)

The curve \(C\) is used to model the profile of a slide at a water park.

Units are in metres, with \(y\) being the height of the slide above water level.

(b) Find, according to the model, the greatest height of the slide above water level. (1)

June 2024 Paper 2 Q9

EdexcelCurrent spec7 marksModellingQuadratics

9.

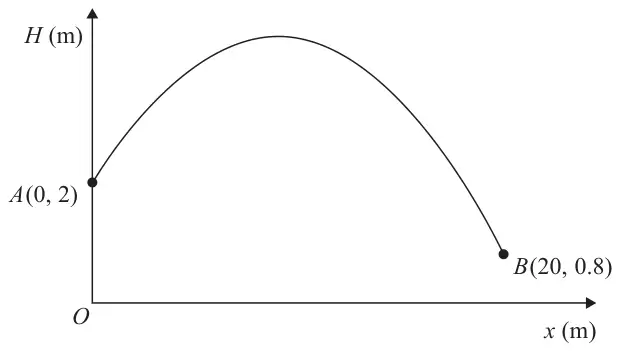
Figure 3: graph of H (m) against x (m): a parabolic path from A(0, 2) on the H-axis rising to a maximum and falling to B(20, 0.8)
Figure 3

The graph in Figure 3 shows the path of a small ball.

The ball travels in a vertical plane above horizontal ground.

The ball is thrown from the point represented by \(A\) and caught at the point represented by \(B\).

The height, \(H\) metres, of the ball above the ground has been plotted against the horizontal distance, \(x\) metres, measured from the point where the ball was thrown.

With respect to a fixed origin \(O\), the point \(A\) has coordinates \((0, 2)\) and the point \(B\) has coordinates \((20, 0.8)\), as shown in Figure 3.

The ball reaches its maximum height when \(x = 9\)

A quadratic function, linking \(H\) with \(x\), is used to model the path of the ball.

(a) Find \(H\) in terms of \(x\). (4)
(b) Give one limitation of the model. (1)

Chandra is standing directly under the path of the ball at a point 16 m horizontally from \(O\).

Chandra can catch the ball if the ball is less than 2.5 m above the ground.

(c) Use the model to determine if Chandra can catch the ball. (2)

June 2024 Paper 1 Q7

EdexcelCurrent spec8 marksIntegrationModelling

7.

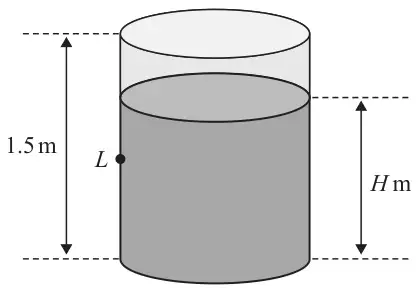
Figure 2: cylindrical tank of height 1.5 m, partly filled with water to depth H m, with a small hole at point L in the side
Figure 2

Diagram not drawn to scale.

Figure 2 shows a cylindrical tank of height 1.5 m.

Initially the tank is full of water.

The water starts to leak from a small hole, at a point \(L\), in the side of the tank.

While the tank is leaking, the depth, \(H\) metres, of the water in the tank is modelled by the differential equation

\[\frac{\mathrm{d}H}{\mathrm{d}t} = -0.12\mathrm{e}^{-0.2t}\]

where \(t\) hours is the time after the leak starts.

Using the model,

(a) show that\[H = A\mathrm{e}^{-0.2t} + B\]where \(A\) and \(B\) are constants to be found, (3)
(b) find the time taken for the depth of the water to decrease to 1.2 m. Give your answer in hours and minutes, to the nearest minute. (3)

In the long term, the water level in the tank falls to the same height as the hole.

(c) Find, according to the model, the height of the hole from the bottom of the tank. (2)

June 2024 Paper 2 Q2

EdexcelCurrent spec5 marksModellingSequences & Series

2. Jamie takes out an interest-free loan of £8100

Jamie makes a payment every month to pay back the loan.

Jamie repays £400 in month 1, £390 in month 2, £380 in month 3, and so on, so that the amounts repaid each month form an arithmetic sequence.

(a) Show that Jamie repays £290 in month 12 (1)

After Jamie’s \(N\)th payment, the loan is completely paid back.

(b) Show that \(N^2 - 81N + 1620 = 0\) (2)
(c) Hence find the value of \(N\). (2)

June 2025 Paper 3 Q11

AQACurrent spec10 marksDifferentiationModelling

11 A block of ice is melting.

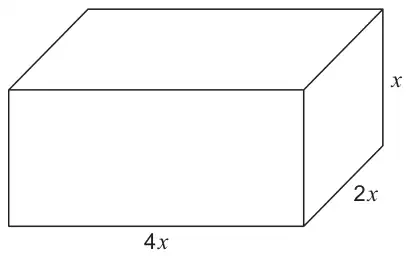
At time \(t\) minutes, the block is in the shape of a cuboid with dimensions of \(4x\), \(2x\) and \(x\), as shown in the diagram.

A cuboid with length 4x, depth 2x and height x

All measurements are in centimetres.

(a) The volume, \(V\ \text{cm}^3\), of the block of ice decreases at a rate which is proportional to its surface area.

When \(x = 4\) the volume of the block of ice is decreasing at a rate of \(7\ \text{cm}^3\) per minute.

Show that

\[\frac{\mathrm{d}V}{\mathrm{d}t} = -0.4375x^2\] [4 marks]
(b) Find \(\dfrac{\mathrm{d}V}{\mathrm{d}x}\) in terms of \(x\) [2 marks]
(c)
(i) Using the results from parts (a) and (b), find \(\dfrac{\mathrm{d}x}{\mathrm{d}t}\) [2 marks]
(ii) Interpret, in context, your answer to part (c)(i). [2 marks]

June 2025 Paper 3 Q10

AQACurrent spec10 marksModellingTrigonometry

10

(a) Express\[2\sin x + 5\cos x\]in the form\[R\sin(x + \alpha)\]

where \(R \gt 0\) and \(0^\circ \leqslant \alpha \leqslant 90^\circ\)

[3 marks]
(b) In 2010, the water temperature at a beach could be modelled by the formula\[T = 14.2 - (2\sin d^\circ + 5\cos d^\circ)\]

where:

  • \(T\) is the temperature of the water in °C
  • \(d\) is the number of days after 1 January 2010
(i) Find the value of \(d\) when the temperature of the water reached its lowest value in 2010 [1 mark]
(ii) Find the maximum temperature of the water predicted by the model in 2010

Give your answer to one decimal place.

[1 mark]
(iii) Find the number of weeks in 2010 for which the temperature of the water was higher than 15 °C

Give your answer to the nearest whole number.

[5 marks]

June 2025 Paper 1 Q10

AQACurrent spec12 marksLogs & ExponentialsModelling

10 A researcher working for a frozen-food manufacturer uses the formula

\[\theta = 21 - A\mathrm{e}^{-kt}\]

to model the temperature of a dessert once it is taken out of a freezer.

In this model:

  • \(\theta\) is the temperature of the dessert in \(^\circ\)C
  • \(t\) is the time in hours since the dessert was removed from the freezer
  • \(A\) and \(k\) are positive constants.
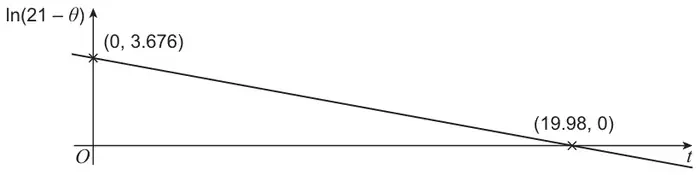
(a) Show how\[\theta = 21 - A\mathrm{e}^{-kt}\]can be rearranged to obtain\[\ln(21 - \theta) = -kt + \ln A\] [3 marks]
(b) The researcher uses measurements they have recorded to plot the graph of \(\ln(21 - \theta)\) against \(t\) as shown in the diagram below.
Straight line graph of ln(21 − θ) against t, with negative gradient, crossing the vertical axis at (0, 3.676) and the t-axis at (19.98, 0)
(i) Use the information on the graph to find the value of \(A\)

Give your answer to three significant figures.

[2 marks]
(ii) Use the information on the graph to find the value of \(k\)

Give your answer to three significant figures.

[2 marks]
(iii) Find the temperature of the dessert when it is initially removed from the freezer.

Give your answer to three significant figures.

[2 marks]
(c) The dessert is ready to be eaten when its temperature reaches 4\(^\circ\)C

Use the model to determine the time, after being removed from the freezer, for the dessert to reach this temperature.

Give your answer to the nearest 10 minutes.

[3 marks]

June 2024 Paper 1 Q20

AQACurrent spec10 marksIntegrationModelling

20 A gardener stores rainwater in a cylindrical container.

The container has a height of 130 centimetres.

The gardener empties the water from the container through a hose.

The hose is attached 5 centimetres from the bottom of the container.

At time \(t\) minutes after the hose is switched on, the depth of water, \(h\) centimetres, in the container decreases at a rate which is proportional to \(h - 5\)

Initially the container of water is full, and the depth of water is decreasing at a rate of 1.5 centimetres per minute.

(a) Show that\[\frac{\mathrm{d}h}{\mathrm{d}t} = -0.012(h - 5)\] [3 marks]
(b) Solve the differential equation\[\frac{\mathrm{d}h}{\mathrm{d}t} = -0.012(h - 5)\]to find an expression for \(h\) in terms of \(t\) [5 marks]
(c) Find the time taken for the container to be half empty.

Give your answer to the nearest minute. [2 marks]

June 2024 Paper 1 Q16

AQACurrent spec5 marksModellingNumerical Methods

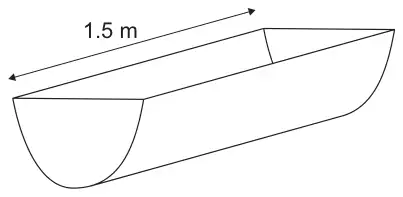
16 Figure 2 below shows a 1.5 metre length of pipe.

Figure 2: a length of pipe with a U-shaped (parabolic) open cross-section, length labelled 1.5 m
Figure 2

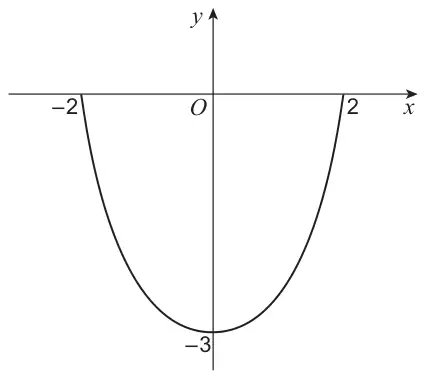
The symmetrical cross-section of the pipe is shown below, in Figure 3, where \(x\) and \(y\) are measured in centimetres.

Figure 3: U-shaped curve below the x-axis meeting it at x = −2 and x = 2, with minimum point at (0, −3)
Figure 3

Use the trapezium rule, with the values shown in the table below, to find the best estimate for the volume of the pipe.

\(x\)00.40.81.21.62
\(y\)\(-3\)\(-2.943\)\(-2.752\)\(-2.353\)\(-1.572\)0

[5 marks]

June 2024 Paper 1 Q10

AQACurrent spec6 marksModellingSequences & Series

10

(a) An arithmetic sequence has 300 terms.

The first term of the sequence is \(-7\) and the last term is 32

Find the sum of the 300 terms. [2 marks]

(b) A school holds a raffle at its summer fair.

There are nine prizes.

The total value of the prizes is £1260

The values of the prizes form an arithmetic sequence.

The top prize has the highest value, and the bottom prize has the least value.

The value of the top prize is six times the value of the bottom prize.

Find the value of the top prize. [4 marks]

June 2024 Paper 2 Q8

AQACurrent spec7 marksLogs & ExponentialsModelling

8 A zookeeper models the median mass of infant monkeys born at their zoo, up to the age of 2 years, by the formula

\[y = a + b\log_{10} x\]

where \(y\) is the median mass in kilograms, \(x\) is age in months and \(a\) and \(b\) are constants.

The zookeeper uses the data shown below to determine the values of \(a\) and \(b\).

Age in months (\(x\))324
Median mass (\(y\))6.412
(a) The zookeeper uses the data for monkeys aged 3 months to write the correct equation\[6.4 = a + b\log_{10} 3\]
(i) Use the data for monkeys aged 24 months to write a second equation. [1 mark]
(ii) Show that\[b = \frac{5.6}{\log_{10} 8}\] [3 marks]
(iii) Find the value of \(a\).

Give your answer to two decimal places. [1 mark]

(b) Use a suitable value for \(x\) to determine whether the model can be used to predict the median mass of monkeys less than one week old. [2 marks]

June 2024 Paper 3 Q8

AQACurrent spec8 marksLogs & ExponentialsModelling

8 The temperature \(\theta\) °C of an oven \(t\) minutes after it is switched on can be modelled by the equation

\[\theta = 20\left(11 - 10\mathrm{e}^{-kt}\right)\]

where \(k\) is a positive constant.

Initially the oven is at room temperature.

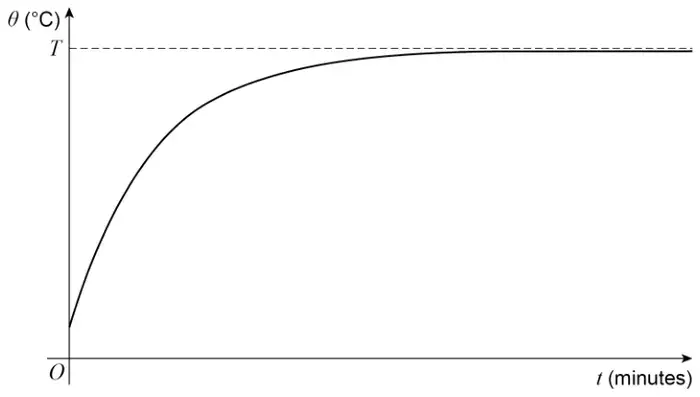
The maximum temperature of the oven is \(T\) °C

The temperature predicted by the model is shown in the graph below.

Graph of θ (°C) against t (minutes): the curve starts on the positive θ-axis and increases, levelling off towards a horizontal dashed asymptote at θ = T
(a) Find the room temperature. [2 marks]
(b) Find the value of \(T\) [2 marks]
(c) The oven reaches a temperature of 86 °C one minute after it is switched on.
(i) Find the value of \(k\). [2 marks]
(ii) Find the time it takes for the temperature of the oven to be within 1 °C of its maximum. [2 marks]

June 2024 Paper 2 Q7

AQACurrent spec5 marksModellingSequences & Series

7 On the first day of each month, Kate pays £50 into a savings account.

Interest is paid on the total amount in the account on the last day of each month.

The interest rate is 0.2%

At the end of the \(n\)th month, the total amount of money in Kate’s savings account is £\(T_n\)

Kate correctly calculates \(T_1\) and \(T_2\) as shown below:

\[T_1 = 50 \times 1.002 = 50.10\]\[\begin{aligned} T_2 &= (T_1 + 50) \times 1.002 \\ &= \big((50 \times 1.002) + 50\big) \times 1.002 \\ &= 50 \times 1.002^2 + 50 \times 1.002 \\ &\approx 100.30 \end{aligned}\]
(a) Show that \(T_3\) is given by\[T_3 = 50 \times 1.002^3 + 50 \times 1.002^2 + 50 \times 1.002\] [1 mark]
(b) Kate uses her method to correctly calculate how much money she can expect to have in her savings account at the end of 10 years.
(i) Find the amount of money Kate expects to have in her savings account at the end of 10 years. [3 marks]
(ii) The amount of money in Kate’s savings account at the end of 10 years may not be the amount she has correctly calculated.

Explain why. [1 mark]

June 2023 Paper 1 Q12

AQACurrent spec8 marksModellingTrigonometry

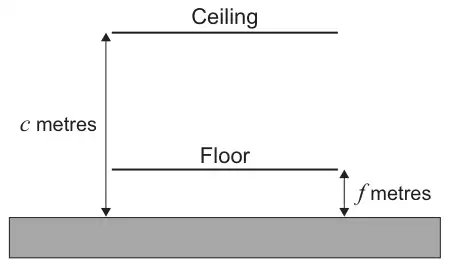
12 One of the rides at a theme park is a room where the floor and ceiling both move up and down for \(10\pi\) seconds.

At time \(t\) seconds after the ride begins, the distance \(f\) metres of the floor above the ground is

\[f = 1 - \cos t\]

At time \(t\) seconds after the ride begins, the distance \(c\) metres of the ceiling above the ground is

\[c = 8 - 4\sin t\]

The ride is shown in the diagram below.

Diagram of the ride: a horizontal ceiling above a horizontal floor, both above the ground, with c metres marked from the ground to the ceiling and f metres marked from the ground to the floor
(a) Show that the initial distance between the floor and ceiling is 8 metres. [1 mark]
(b) Show that the distance \(d\) metres between the floor and ceiling at time \(t\) is given by\[d = 7 + R\cos(t + \alpha)\]where \(R\) and \(\alpha\) are positive constants to be found. [5 marks]
(c) Hence, find the minimum distance between the ceiling and the floor.

Give your answer to the nearest centimetre. [2 marks]

June 2023 Paper 3 Q9

AQACurrent spec12 marksModellingParametric Equations

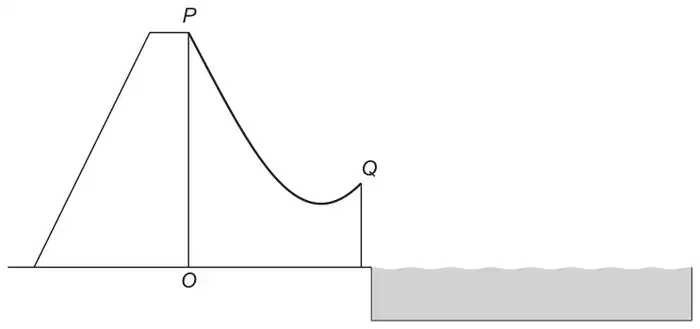
9 A water slide is the shape of a curve \(PQ\) as shown in Figure 1 below.

Side view of a water slide: a platform at P directly above O on the ground, with the slide curving down from P to a lowest point and then rising slightly to Q at the edge of a pool
Figure 1

The curve can be modelled by the parametric equations

\[x = t - \frac{1}{t} + 4.8\]\[y = t + \frac{2}{t}\]

where \(0.2 \leqslant t \leqslant 3\)

The horizontal distance from \(O\) is \(x\) metres.

The vertical distance above the point \(O\) at ground level is \(y\) metres.

\(P\) is the point where \(t = 0.2\) and \(Q\) is the point where \(t = 3\)

(a) To make sure speeds are safe at \(Q\), the difference in height between \(P\) and \(Q\) must be less than 7 metres.

Show that the slide meets this safety requirement. [3 marks]

(b)
(i) Find an expression for \(\dfrac{\mathrm{d}y}{\mathrm{d}x}\) in terms of \(t\) [3 marks]
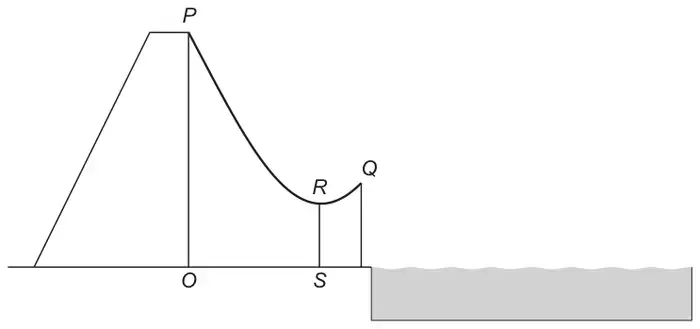
(ii) A vertical support, \(RS\), is to be added between the ground and the lowest point on the slide as shown in Figure 2 below.
The water slide from Figure 1 with a vertical support RS from the lowest point R on the slide down to S on the ground, between O and Q
Figure 2

Find the length of \(RS\) [4 marks]

(iii) Find the acute angle the slide makes with the horizontal at \(Q\)

Give your answer to the nearest degree. [2 marks]

June 2023 Paper 2 Q6

AQACurrent spec6 marksLogs & ExponentialsModelling

6 Victoria, a market researcher, believes the average weekly value, £\(V\) million, of online grocery sales in the UK has grown exponentially since 2009.

Victoria models the incomplete data, shown in the table, using the formula

\[V = a \times b^N\]

where \(N\) is the number of years since 2009 and \(a\) and \(b\) are constants.

Year20092010201120122013201420152016
Average Weekly Sales
£\(V\) million
56.474.586.997.7109.3141.9
(a) Victoria wishes to determine the values of \(a\) and \(b\) in her formula.

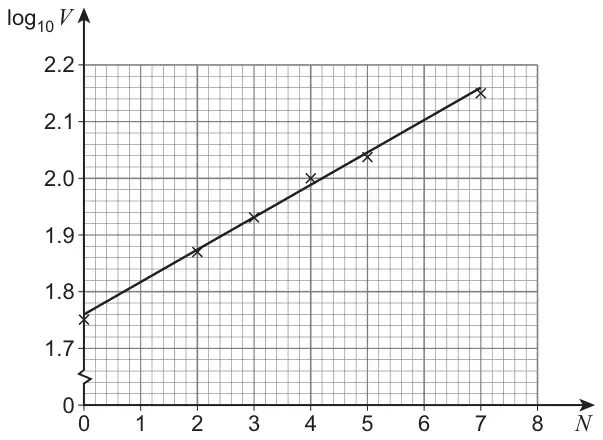
To do this she plots a graph of \(\log_{10} V\) against \(N\) and then draws a line of best fit as shown in the diagram below.

Graph of log10 V against N on grid paper, N from 0 to 8 and log10 V from 1.7 to 2.2, with plotted points at N = 0, 2, 3, 4, 5 and 7 and a straight line of best fit

The equation of Victoria’s line of best fit is

\[\log_{10} V = 0.057N + 1.76\]
(i) Use the equation of Victoria’s line of best fit to show that, correct to three significant figures, \(a = 57.5\) [1 mark]
(ii) Use the equation of Victoria’s line of best fit to find the value of \(b\)

Give your answer to three significant figures. [1 mark]

(b) According to Victoria’s model, state the yearly percentage increase in the average weekly value of online grocery sales. [1 mark]
(c)
(i) Use Victoria’s model to predict the average weekly value of online grocery sales in 2025. [2 marks]
(ii) Explain why the prediction made in part (c)(i) may be unreliable. [1 mark]

June 2023 Paper 2 Q5

AQACurrent spec7 marksModellingSequences & Series

5 Ziad is training to become a long-distance swimmer.

He trains every day by swimming lengths at his local pool.

The length of the pool is 25 metres.

Each day he increases the number of lengths that he swims by four.

On his first day of training, Ziad swims 10 lengths of the pool.

(a) Write down an expression for the number of lengths Ziad will swim on his \(n\)th day of training. [1 mark]
(b)
(i) Ziad’s target is to be able to swim at least 3000 metres in one day.

Determine the minimum number of days he will need to train to reach his target. [3 marks]

(ii) Ziad’s coach claims that when he reaches his target he will have covered a total distance of over 50 000 metres.

Determine if Ziad’s coach is correct. [3 marks]

June 2022 Paper 1 Q13

AQACurrent spec9 marksDifferentiationModelling

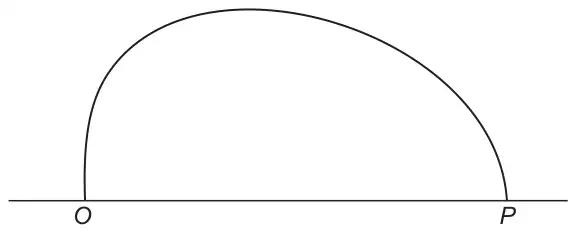
13 Figure 2 shows the approximate shape of the vertical cross section of the entrance to a cave. The cave has a horizontal floor.

The entrance to the cave joins the floor at the points \(O\) and \(P\).

Figure 2: an arch-shaped curve rising from O on a horizontal floor and coming back down to P
Figure 2

Garry models the shape of the cross section of the entrance to the cave using the equation

\[x^2 + y^2 = a\sqrt{x} - y\]

where \(a\) is a constant, and \(x\) and \(y\) are the horizontal and vertical distances respectively, in metres, measured from \(O\).

(a) The distance \(OP\) is 16 metres.

Find the value of \(a\) that Garry should use in the model. [2 marks]

(b) Show that the maximum height of the cave above \(OP\) is approximately 10.5 metres. [6 marks]
(c) Suggest one limitation of the model Garry has used. [1 mark]

June 2022 Paper 2 Q10

AQACurrent spec15 marksIntegrationModelling

10 A gardener has a greenhouse containing 900 tomato plants.

The gardener notices that some of the tomato plants are damaged by insects.

Initially there are 25 damaged tomato plants.

The number of tomato plants damaged by insects is increasing by 32% each day.

(a) The total number of plants damaged by insects, \(x\), is modelled by\[x = A \times B^t\]where \(A\) and \(B\) are constants and \(t\) is the number of days after the gardener first noticed the damaged plants.
(i) Use this model to find the total number of plants damaged by insects 5 days after the gardener noticed the damaged plants. [3 marks]
(ii) Explain why this model is not realistic in the long term. [2 marks]
(b) A refined model assumes the rate of increase of the number of plants damaged by insects is given by\[\frac{\mathrm{d}x}{\mathrm{d}t} = \frac{x(900 - x)}{2700}\]
(i) Show that\[\int \left(\frac{A}{x} + \frac{B}{900 - x}\right)\mathrm{d}x = \int \mathrm{d}t\]where \(A\) and \(B\) are positive integers to be found. [3 marks]
(ii) Hence, find \(t\) in terms of \(x\). [5 marks]
(iii) Hence, find the number of days it takes from when the damage is first noticed until half of the plants are damaged by the insects. [2 marks]

June 2022 Paper 3 Q7

AQACurrent spec7 marksLogs & ExponentialsModelling

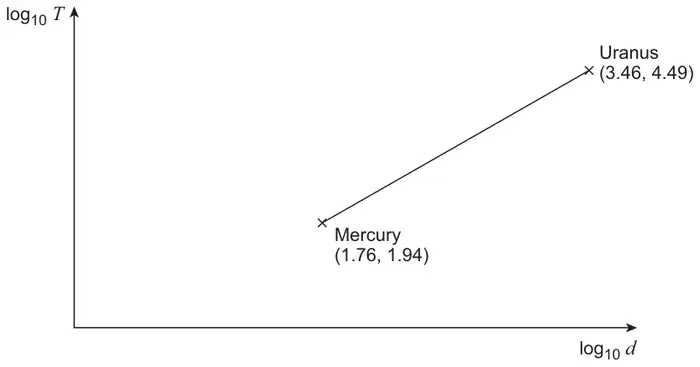
7 A planet takes \(T\) days to complete one orbit of the Sun.

\(T\) is known to be related to the planet’s average distance \(d\), in millions of kilometres, from the Sun.

A graph of \(\log_{10} T\) against \(\log_{10} d\) is shown with data for Mercury and Uranus labelled.

Axes log10 T (vertical) against log10 d (horizontal) with a straight line joining Mercury at (1.76, 1.94) to Uranus at (3.46, 4.49)
(a)
(i) Find the equation of the straight line in the form\[\log_{10} T = a + b\,\log_{10} d\]where \(a\) and \(b\) are constants to be found. [3 marks]
(ii) Show that\[T = \mathrm{K}d^{\mathrm{n}}\]where K and n are constants to be found. [2 marks]
(b) Neptune takes approximately 60 000 days to complete one orbit of the Sun.

Use your answer to 7(a)(ii) to find an estimate for the average distance of Neptune from the Sun. [2 marks]

June 2025 Paper 1 Q5

OCR ACurrent spec8 marksCo-ordinate GeometryModelling

5 Scientists are comparing \(h\), the average height of a child in cm, with \(t\), the age of the child in years.
They suggest the model \(h = at + b\) for \(t \geqslant 2\), where \(a\) and \(b\) are constants.

They find that the average height of a 2 year old child is 87 cm and the average height of a 5 year old child is 108 cm.

(a) Find the values of \(a\) and \(b\) that are consistent with the scientists’ findings. [4]
(b)
(i) Sam is 4 years old.

Use the model to predict Sam’s height. [2]
(ii) Comment on the accuracy of this prediction. [1]
(c) Suggest one possible limitation of this model when predicting the average height of a 12 year old child. [1]

June 2024 Paper 1 Q9

OCR ACurrent spec9 marksModellingTrigonometry

9 The depth of the water, \(d\) metres, in a tidal river during a given day is modelled by the equation

\(d = 1.9 + 1.1\cos(30t - 60)^\circ\)

where \(t\) is the number of hours after midnight.

(A tidal river is one whose level is influenced by tides.)

(a)
(i) Find the minimum depth of water given by this model. [1]
(ii) Find the value of \(t\) when the minimum depth first occurs. [2]
(b) A boat can only enter the river when the depth of water is at least 1 metre.
Determine the two periods of time during the day between which this boat will not be able to enter the river. Give your answers correct to the nearest minute. [5]

In reality the depth of the river decreases as this boat travels along the river. An improved model uses the equation

\(d = \mathrm{e}^{-cp}\left(1.9 + 1.1\cos(30t - 60)^\circ\right)\)

where \(c\) is a positive constant and \(p\) is the distance, in kilometres, travelled along the river after entering it.

(c) Explain how this new equation could give an improved model. [1]

June 2024 Paper 2 Q5

OCR ACurrent spec8 marksIntegrationModelling

5 A scientist is monitoring the decline in the population of a certain endangered species of animal in an area where their natural habitat has been damaged.

As a model, the scientist proposes that the rate of decline per year of the population is given by \(\dfrac{1}{80}P^2\), where \(P\) is the size of the population \(t\) years after the start of the modelling.

(a) Explain how this model gives rise to the differential equation\[\frac{\mathrm{d}P}{\mathrm{d}t} = -\frac{1}{80}P^2.\] [1]

The scientist notes that at the start of the monitoring the population is 120.

(b) Use the model to determine an expression for \(P\) in terms of \(t\). [4]
(c) Use the model to determine the time it takes for the population to reach 10. [2]

The model predicts that the population will never reach zero.

(d) By considering the case when \(t \geqslant 160\), or otherwise, comment on the validity of the model for large values of \(t\). [1]

June 2023 Paper 1 Q9

OCR ACurrent spec6 marksDifferentiationModelling

9 Conservationists are studying how the number of bees in a wildflower meadow varies according to the number of wildflower plants. The study takes place over a series of weeks in the summer. A model is suggested for the number of bees, \(B\), and the number of wildflower plants, \(F\), at time \(t\) weeks after the start of the study.

In the model \(B = 20 + 2t + \cos 3t\) and \(F = 50\mathrm{e}^{0.1t}\).

The model assumes that \(B\) and \(F\) can be treated as continuous variables.

(a) State the meaning of \(\dfrac{\mathrm{d}B}{\mathrm{d}F}\). [1]
(b) Determine \(\dfrac{\mathrm{d}B}{\mathrm{d}F}\) when \(t = 4\). [4]
(c) Suggest a reason why this model may not be valid for values of \(t\) greater than 12. [1]

June 2022 Paper 1 Q8

OCR ACurrent spec9 marksLogs & ExponentialsModelling

8

(a) Substance \(A\) is decaying exponentially such that its mass is \(m\) grams at time \(t\) minutes. Find the missing values of \(m\) and \(t\) in the following table.
\(t\)01050
\(m\)1250750450
[2]
(b) Substance \(B\) is also decaying exponentially, according to the model \(m = 160\mathrm{e}^{-0.055t}\), where \(m\) grams is its mass after \(t\) minutes.
(i) Determine the value of \(t\) for which the mass of substance \(B\) is half of its original mass. [3]
(ii) Determine the rate of decay of substance \(B\) when \(t = 15\). [3]
(c) State whether substance \(A\) or substance \(B\) is decaying at a faster rate, giving a reason for your answer. [1]

June 2022 Paper 2 Q4

OCR ACurrent spec5 marksModellingSequences & Series

4 An artist is creating a design for a large painting. The design includes a set of steps of varying heights. In the painting the lowest step has height 20 cm and the height of each other step is 5% less than the height of the step immediately below it.

In the painting the total height of the steps is 205 cm, correct to the nearest centimetre.

Determine the number of steps in the design. [5]

October 2021 Paper 1 Q12

OCR ACurrent spec13 marksIntegrationModelling

12 A cake is cooling so that, \(t\) minutes after it is removed from an oven, its temperature is \(\theta\,{}^\circ\mathrm{C}\).
When the cake is removed from the oven, its temperature is \(160\,{}^\circ\mathrm{C}\). After 10 minutes its temperature has fallen to \(125\,{}^\circ\mathrm{C}\).

(a) In a simple model, the rate of decrease of the temperature of the cake is assumed to be constant.
(i) Write down a differential equation for this model. [1]
(ii) Solve this differential equation to find \(\theta\) in terms of \(t\). [2]
(iii) State one limitation of this model. [1]
(b) In a revised model, the rate of decrease of the temperature of the cake is proportional to the difference between the temperature of the cake and the temperature of the room. The temperature of the room is a constant \(20\,{}^\circ\mathrm{C}\).
(i) Write down a differential equation for this revised model. [1]
(ii) Solve this differential equation to find \(\theta\) in terms of \(t\). [6]
(c) The cake can be decorated when its temperature is \(25\,{}^\circ\mathrm{C}\). Find the difference in time between when the two models would predict that the cake can be decorated, giving your answer correct to the nearest minute. [2]

October 2021 Paper 3 Q5

OCR ACurrent spec6 marksModellingTrigonometry

5 A particle \(P\) moves along a straight line in such a way that at time \(t\) seconds \(P\) has velocity \(v\,\mathrm{m\,s^{-1}}\), where

\(v = 12\cos t + 5\sin t.\)

(a) Express \(v\) in the form \(R\cos(t - \alpha)\), where \(R \gt 0\) and \(0 \lt \alpha \lt \frac{1}{2}\pi\). Give the value of \(\alpha\) correct to 4 significant figures. [3]
(b) Hence find the two smallest positive values of \(t\) for which \(P\) is moving, in either direction, with a speed of \(3\,\mathrm{m\,s^{-1}}\). [3]

October 2021 Paper 2 Q4

OCR ACurrent spec10 marksModellingTrigonometry

4 The size, \(P\), of a population of a certain species of insect at time \(t\) months is modelled by the following formula.

\(P = 5000 - 1000\cos(30t)^\circ\)

(a) Write down the maximum size of the population. [1]
(b) Write down the difference between the largest and smallest values of \(P\). [1]
(c) Without giving any numerical values, describe briefly the behaviour of the population over time. [1]
(d) Find the time taken for the population to return to its initial size for the first time. [2]
(e) Determine the time on the second occasion when \(P = 4500\). [4]

A scientist observes the population over a period of time. He notices that, although the population varies in a way similar to the way predicted by the model, the variations become smaller and smaller over time, and \(P\) converges to 5000.

(f) Suggest a change to the model that will take account of this observation. [1]

October 2021 Paper 1 Q2

OCR ACurrent spec4 marksModellingQuadratics

2 Alex is comparing the cost of mobile phone contracts. Contract \(\boldsymbol{A}\) has a set-up cost of £40 and then costs 4p per minute. Contract \(\boldsymbol{B}\) has no set-up cost, does not charge for the first 100 minutes and then costs 6p per minute.

(a) Find an expression for the cost of each of the contracts in terms of \(m\), where \(m\) is the number of minutes for which the phone is used and \(m \gt 100\). [2]
(b) Hence find the value of \(m\) for which both contracts would cost the same. [2]

June 2025 Paper 2 Q16

OCR MEICurrent spec9 marksIntegrationModelling

16 In this question you must show detailed reasoning

The population of puffins on a remote island is estimated to be \(P = 58.5\), where \(P\) is measured in thousands of birds.

Just after this estimate is made there is a serious oil spill in the area. It is noted that there is a rapid decline in the population of puffins on the island.

The situation is modelled by the differential equation

\(\dfrac{\mathrm{d}P}{\mathrm{d}t} = (72t - 108)\mathrm{e}^{-0.8t}\), where \(t\) is the time in years after the pollution incident.

(a) Determine an expression for \(P\) in terms of \(t\). [7]
(b) Determine whether, according to the model, \(P\) will recover to 58.5. You may assume that \(\displaystyle\lim_{t\to\infty} t\mathrm{e}^{-0.8t} = 0\). [2]

June 2025 Paper 1 Q9

OCR MEICurrent spec6 marksLogs & ExponentialsModelling

9 The table below shows information about four of the moons of the planet Jupiter. The semi-major axis is the greatest distance that each moon reaches from the centre of its orbit around Jupiter. The orbital period is the time in Earth days that it takes to orbit the planet.

MoonSemi-major axis (km)Orbital period (Earth days)
Io421 8001.7627
Europa671 1003.5255
Ganymede1 070 4007.1556
Callisto1 882 70016.690

A student uses the equation \(T = kd^n\) to model the orbital period of Jupiter’s moons, where \(T\) is the orbital period in Earth days, \(d\) is the semi-major axis in km, and \(k\) and \(n\) are constants.

(a) Show that the equation \(T = kd^n\) can be rewritten in the form \(\log_{10}T = \log_{10}k + n\log_{10}d\). [1]

The student uses graph drawing software to plot \(\log_{10}T\) against \(\log_{10}d\). They find that the line of best fit for the data has gradient 1.504 and intercepts the \(\log_{10}T\) axis at \(-8.215\).

(b) Determine values of \(k\) and \(n\) that are consistent with this information. [3]

The student uses their equation to predict the orbital period for another moon of Jupiter called Thebe which has a semi-major axis of 221 900 km. They look up the value in an online encyclopedia and find it is 0.6761 Earth days.

(c) Comment on the suitability of the student’s equation to model the orbital period of Thebe. [2]

June 2025 Paper 3 Q7

OCR MEICurrent spec9 marksLogs & ExponentialsModelling

7 A group of scientists is studying how a population of insects grows in the laboratory.
At the start of the study, there are 48 insects.
At the end of the first month, there are 72 insects.
At the end of the second month, there are 108 insects.
The group develops two models, \(P\) and \(Q\), to model the population.

The first model, \(P\), is of the form \(P_{t+1} = kP_t\), where \(k\) is a constant.
\(P_0\) denotes the number of insects at the start of the study.
\(P_t\) denotes the number of insects at the end of month \(t\), \(t \geqslant 1\).
Model \(P\) fits the data for \(t = 0\), 1 and 2 exactly.

(a) Find the value of \(k\). [1]
(b) Use model \(P\) to predict the number of insects at the end of month 3. [1]

The second model, \(Q\), is of the form \(Q = 48\mathrm{e}^{0.4t}\), where \(t\) is the time, in months, after the start of the study and \(Q\) denotes the number of insects at time \(t\).

(c)
(i) By considering the given data on the number of insects when \(t = 1\) and \(t = 2\), assess whether model \(Q\) fits the data for these times. [2]
(ii) Show that model \(Q\) implies that the rate of growth of the population is proportional to the population at any time \(t\). [2]
(iii) Show that, for integer values of \(t\) with \(t > 1\), the population predicted by model \(Q\) will always be lower than the population predicted by model \(P\). [3]

June 2024 Paper 1 Q10

OCR MEICurrent spec10 marksLogs & ExponentialsModelling

10 Zac is measuring the growth of a culture of bacteria in a laboratory. The initial area of the culture is \(8\ \text{cm}^2\). The area one day later is \(8.8\ \text{cm}^2\).

At first, Zac uses a model of the form \(A = a + bt\), where \(A\ \text{cm}^2\) is the area \(t\) days after he begins measuring and \(a\) and \(b\) are constants.

(a) Find the values of \(a\) and \(b\) that best model the initial area and the area one day later. [2]
(b) Calculate the value of \(t\) for which the model predicts an area of \(15\ \text{cm}^2\). [1]
(c) Zac notices the area covered by the culture increases by 10% each day.
Explain why this model may not be suitable after the first day. [1]

Zac decides to use a different model for \(A\). His new model is \(A = P\mathrm{e}^{kt}\), where \(P\) and \(k\) are constants.

(d) Find the values of \(P\) and \(k\) that best model the initial area and the area one day later. [3]
(e) Calculate the value of \(t\) for which the area reaches \(15\ \text{cm}^2\) according to this model. [2]
(f) Explain why this model may not be suitable for large values of \(t\). [1]

June 2023 Paper 1 Q11

OCR MEICurrent spec10 marksLogs & ExponentialsModelling

11 The height \(h\) cm of a sunflower plant \(t\) days after planting the seed is modelled by \(h = a + b\ln t\) for \(t \geqslant 9\), where \(a\) and \(b\) are constants. The sunflower is 10 cm tall 10 days after planting and 200 cm tall 85 days after planting.

(a)
(i) Show that the value of \(b\) which best models these values is 88.8 correct to 3 significant figures. [2]
(ii) Find the corresponding value of \(a\). [1]
(b)
(i) Explain why the model is not suitable for small positive values of \(t\). [1]
(ii) Explain why the model is not suitable for very large positive values of \(t\). [1]
(c) Show that the model indicates that the sunflower grows to 1 m in height in less than half the time it takes to grow to 2 m. [2]
(d) Find the value of \(t\) for which the rate of growth is 3 cm per day. [3]

June 2023 Paper 3 Q9

OCR MEICurrent spec9 marksLogs & ExponentialsModelling

9 A small country started using solar panels to produce electrical energy in the year 2000. Electricity production is measured in megawatt hours (MWh).

For the period from 2000 to 2009, the annual electrical energy produced using solar panels can be modelled by the equation \(P = 0.3\mathrm{e}^{0.5t}\), where \(P\) is the annual amount of electricity produced in MWh and \(t\) is the time in years after the year 2000.

(a) According to this model, find the amount of electricity produced using solar panels in each of the following years.
(i) 2000 [1]
(ii) 2009 [1]
(b) Give a reason why the model is unlikely to be suitable for predicting the annual amount of electricity produced using solar panels in the year 2025. [1]

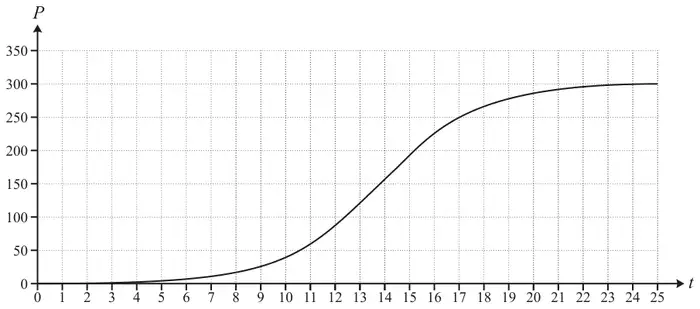
An alternative model is suggested; the curve representing this model is shown in Fig. 9.

Fig. 9: graph of P (0 to 350) against t (0 to 25) on a grid; an S-shaped curve rising slowly from near 0, steepest around t = 14, levelling off at about 300
Fig. 9
(c) Explain how the graph shows that the alternative model gives a value for the amount of electricity produced in 2009 that is consistent with the original model. [1]
(d)
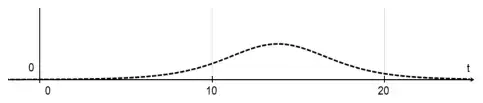
(i) On the axes given in the Printed Answer Booklet, sketch the gradient function of the model shown in Fig. 9. [2]
(ii) State approximately the value of \(t\) at the point of inflection in Fig. 9. [1]
(iii) Interpret the significance of the point of inflection in the context of the model. [1]
(e) State approximately the long term value of the annual amount of electricity produced using solar panels according to the model represented in Fig. 9. [1]

June 2022 Paper 1 Q14

OCR MEICurrent spec13 marksLogs & ExponentialsModelling

14 Alex places a hot object into iced water and records the temperature \(\theta\,{}^\circ\mathrm{C}\) of the object every minute. The temperature of an object \(t\) minutes after being placed in iced water is modelled by \(\theta = \theta_0\mathrm{e}^{-kt}\) where \(\theta_0\) and \(k\) are constants whose values depend on the characteristics of the object.

The temperature of Alex’s object is \(82\,{}^\circ\mathrm{C}\) when it is placed into the water. After 5 minutes the temperature is \(27\,{}^\circ\mathrm{C}\).

(a) Find the values of \(\theta_0\) and \(k\) that best model the data. [3]
(b) Explain why the model may not be suitable in the long term if Alex does not top up the ice in the water. [1]
(c) Show that the model with the values found in part (a) can be written as \(\ln\theta = a - bt\) where \(a\) and \(b\) are constants to be determined. [2]

Ben places a different object into iced water at the same time as Alex. The model for Ben’s object is \(\ln\theta = 3.4 - 0.08t\).

(d) Determine each of the following:
  • the initial temperature of Ben’s object
  • the rate at which Ben’s object is cooling initially.
[4]
(e) According to the models, there is a time at which both objects have the same temperature.
Find this time and the corresponding temperature. [3]

June 2022 Paper 3 Q6

OCR MEICurrent spec8 marksIntegrationModelling

6 A hot drink is cooling. The temperature of the drink at time \(t\) minutes is \(T\,{}^\circ\mathrm{C}\).

The rate of decrease in temperature of the drink is proportional to \((T - 20)\).

(a) Write down a differential equation to describe the temperature of the drink as a function of time. [2]
(b) When \(t = 0\), the temperature of the drink is \(90\,{}^\circ\mathrm{C}\) and the temperature is decreasing at a rate of \(4.9\,{}^\circ\mathrm{C}\) per minute.
Determine how long it takes for the drink to cool from \(90\,{}^\circ\mathrm{C}\) to \(40\,{}^\circ\mathrm{C}\). [6]

October 2021 Paper 1 Q11

OCR MEICurrent spec11 marksIntegrationModelling

11 A balloon is being inflated. The balloon is modelled as a sphere with radius \(x\) cm at time \(t\) s. The volume \(V\,\text{cm}^3\) is given by \(V = \frac{4}{3}\pi x^3\).

The rate of increase of volume is inversely proportional to the radius of the balloon. Initially, when \(t = 0\), the radius of the balloon is 5 cm and the volume of the balloon is increasing at a rate of \(21\,\text{cm}^3\,\text{s}^{-1}\).

(a) Show that \(x\) satisfies the differential equation \(\dfrac{\mathrm{d}x}{\mathrm{d}t} = \dfrac{105}{4\pi x^3}\). [5]
(b) Find the radius of the balloon after two minutes. [5]
(c) Explain why the model may not be suitable for very large values of \(t\). [1]

October 2021 Paper 3 Q5

OCR MEICurrent spec8 marksLogs & ExponentialsModelling

5

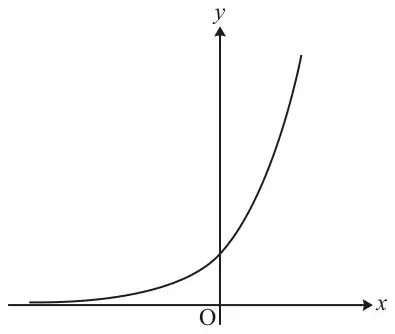
(a) The diagram shows the curve \(y = \mathrm{e}^x\).
Curve y = e^x passing through (0, 1)
On the axes in the Printed Answer Booklet, sketch graphs of
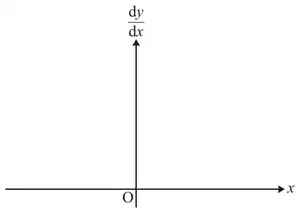
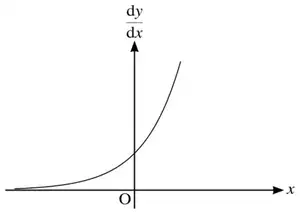
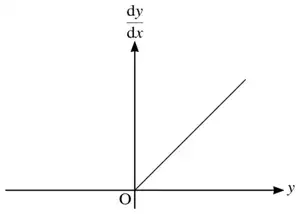
(i) \(\dfrac{\mathrm{d}y}{\mathrm{d}x}\) against \(x\), [1]
Blank axes from the Printed Answer Booklet: dy/dx on the vertical axis, x on the horizontal axis, origin O
Axes printed in the Printed Answer Booklet for (a)(i)
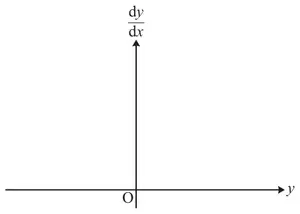
(ii) \(\dfrac{\mathrm{d}y}{\mathrm{d}x}\) against \(y\). [2]
Blank axes from the Printed Answer Booklet: dy/dx on the vertical axis, y on the horizontal axis, origin O
Axes printed in the Printed Answer Booklet for (a)(ii)
(b) Wolves were introduced to Yellowstone National Park in 1995. The population of wolves, \(y\), is modelled by the equation \(y = A\mathrm{e}^{kt}\), where \(A\) and \(k\) are constants and \(t\) is the number of years after 1995.
(i) Give a reason why this model might be suitable for the population of wolves. [1]
(ii) When \(t = 0\), \(y = 21\) and when \(t = 1\), \(y = 51\).
Find values of \(A\) and \(k\) consistent with the data. [3]
(iii) Give a reason why the model will not be a good predictor of wolf populations many years after 1995. [1]

October 2020 Paper 1 Q14

OCR MEICurrent spec10 marksModellingTrigonometry

14 Douglas wants to construct a model for the height of the tide in Liverpool during the day, using a cosine graph to represent the way the height changes.

He knows that the first high tide of the day measures 8.55 m and the first low tide of the day measures 1.75 m.

Douglas uses \(t\) for time and \(h\) for the height of the tide in metres. With his graph-drawing software set to degrees, he begins by drawing the graph of \(h = 5.15 + 3.4\cos t\).

(a) Verify that this equation gives the correct values of \(h\) for the high and low tide. [1]

Douglas also knows that the first high tide of the day occurs at 1 am and the first low tide occurs at 7.20 am. He wants \(t\) to represent the time in hours after midnight, so he modifies his equation to \(h = 5.15 + 3.4\cos(at + b)\).

(b)
(i) Show that Douglas’s modified equation gives the first high tide of the day occurring at the correct time if \(a + b = 0\). [1]
(ii) Use the time of the first low tide of the day to form a second equation relating \(a\) and \(b\). [1]
(iii) Hence show that \(a = 28.42\) correct to 2 decimal places. [2]
(c) Douglas can only sail his boat when the height of the tide is at least 3 m.
Use the model to predict the range of times that morning when he cannot sail. [3]
(d) The next high tide occurs at 12.59 pm when the height of the tide is 8.91 m.
Comment on the suitability of Douglas’s model. [2]

October 2020 Paper 1 Q8

OCR MEICurrent spec7 marksModellingNumerical Methods

8 Fig. 8.1 shows the cross-section of a straight driveway 4 m wide made from tarmac.

Fig. 8.1: cross-section of the driveway, a low symmetric hump 4 m wide
Fig. 8.1

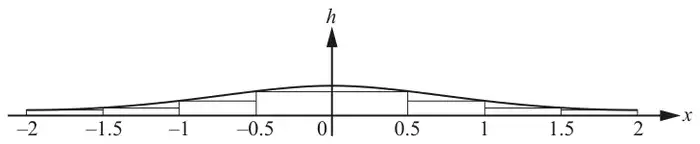
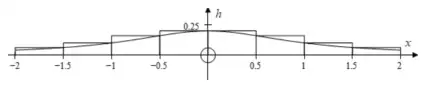
The height \(h\) m of the cross-section at a displacement \(x\) m from the middle is modelled by \(h = \dfrac{0.2}{1+x^2}\) for \(-2 \leqslant x \leqslant 2\).

A lower bound of \(0.3615\,\mathrm{m^2}\) is found for the area of the cross-section using rectangles as shown in Fig. 8.2.

Fig. 8.2: the curve h = 0.2/(1 + x^2) from x = -2 to 2 with eight rectangles of width 0.5 lying under the curve
Fig. 8.2
(a) Use a similar method to find an upper bound for the area of the cross-section. [3]
(b) Use the trapezium rule with 4 strips to estimate \(\displaystyle\int_0^2 \frac{0.2}{1+x^2}\,\mathrm{d}x\). [2]
(c) The driveway is 10 m long. Use your answer in part (b) to find an estimate of the volume of tarmac needed to make the driveway. [2]

October 2020 Paper 3 Q6

OCR MEICurrent spec12 marksLogs & ExponentialsModelling

6

(a)
(i) Write down the derivative of \(\mathrm{e}^{kx}\), where \(k\) is a constant. [1]
(ii) A business has been running since 2009. They sell maths revision resources online.
Give a reason why an exponential growth model might be suitable for the annual profits for the business. [1]

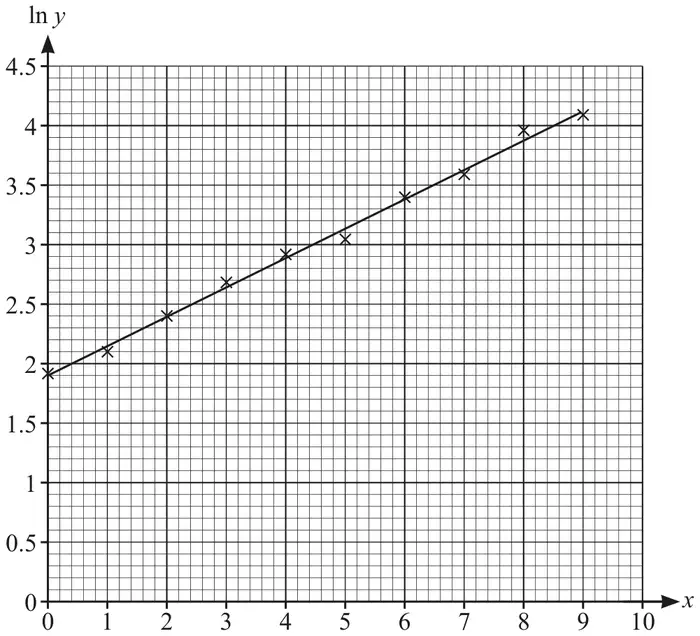
Fig. 6 shows the relationship between the annual profits of the business in thousands of pounds (\(y\)) and the time in years after 2009 (\(x\)). The graph of \(\ln y\) plotted against \(x\) is approximately a straight line.

Fig. 6: graph of ln y (0 to 4.5) against x (0 to 10) on graph paper; ten plotted crosses at x = 0 to 9 lie close to a straight line from (0, 1.9) to about (9, 4.1)
Fig. 6
(b) Show that the straight line is consistent with a model of the form \(y = A\mathrm{e}^{kx}\), where \(A\) and \(k\) are constants. [2]
(c) Estimate the values of \(A\) and \(k\). [4]
(d) Use the model to predict the profit in the year 2020. [3]
(e) How reliable do you expect the prediction in part (d) to be? Justify your answer. [1]

October 2020 Paper 3 Q3

OCR MEICurrent spec3 marksModellingSequences & Series

3 A particular phone battery will last 10 hours when it is first used. Every time it is recharged, it will only last 98% of its previous time.

Find the maximum total length of use for the battery. [3]