
October 2020 Paper 3 Q6
6
Give a reason why an exponential growth model might be suitable for the annual profits for the business. [1]
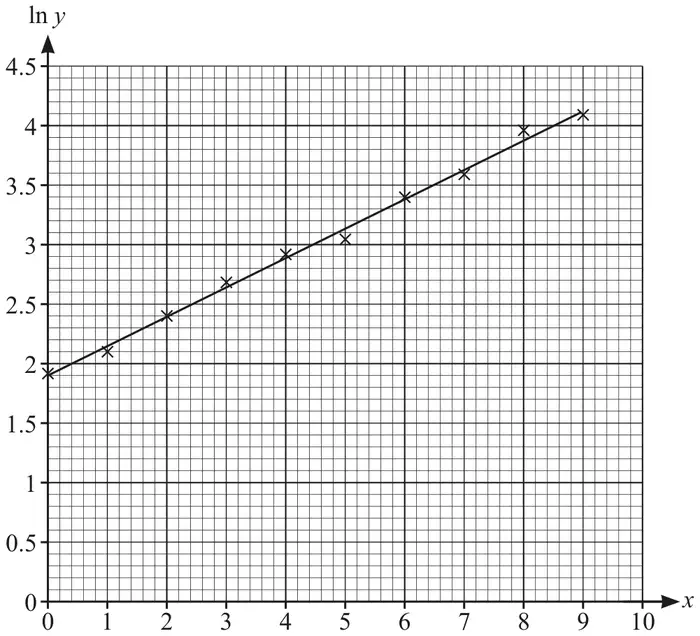
Fig. 6 shows the relationship between the annual profits of the business in thousands of pounds (\(y\)) and the time in years after 2009 (\(x\)). The graph of \(\ln y\) plotted against \(x\) is approximately a straight line.
| Scheme | Marks | AO |
|---|---|---|
| (i) \(k\mathrm{e}^{kx}\) | B1 | 1.2 |
| [1] | ||
| (ii) Reason referring to growth proportional to profit. | E1 | 3.3 |
| [1] |
Notes
(ii) E1: E.g. As more people hear about the business, they will sell more so it is reasonable that the rate of growth is proportional to the profits
| Scheme | Marks | AO |
|---|---|---|
| \(\ln y = \ln A + kx\) | M1 | 1.1 |
| Equation is of form “\(y = mx + c\)” so a straight line - hence model is consistent with graph | E1 | 2.4 |
| [2] |
| Scheme | Marks | AO |
|---|---|---|
| \(\ln A = 1.9\) | M1 | 1.1a |
| \(A = 6.686\) | A1 | 2.2a |
| \(k = \dfrac{0.4}{1.6}\) | M1 | 1.1 |
| \(k = 0.24\) to \(0.25\) | A1 | 2.2a |
| [4] |
Notes
M1: Intercept = 1.9 not enough for M1
A1: One or more d.p.
Allow \(\mathrm{e}^{1.9}\)
M1: Attempt to find gradient
A1: \(\frac{11}{45}\) gets M1A1
| Scheme | Marks | AO |
|---|---|---|
| \(x = 11\) | B1 | 3.3 |
| \(y = 6.686 \times \mathrm{e}^{0.25x}\) So \(y = 6.686 \times \mathrm{e}^{0.25 \times 11}\) | M1 | 3.4 |
| 104.586… £104 587 | A1 | 3.2a |
| [3] |
Notes
M1: Use of model with their \(A\) and \(k\)
A1: Translation into pounds (may be to nearest thousand) (FT their \(k\) and \(a\))
| Scheme | Marks | AO |
|---|---|---|
| Not reliable. Extrapolation may not be valid o.e. OR Fit of model is good so far and it’s only two more years o.e. | E1 | 3.5b |
| [1] |
Notes
E1: E.g.
• The relationship between sales and time may change
• There is a limit to the market for revision resources
• Changes in the economy may affect the business
‘Reliable’ plus ‘extrapolation’ does not score