6 Victoria, a market researcher, believes the average weekly value, £\(V\) million, of online grocery sales in the UK has grown exponentially since 2009.
Victoria models the incomplete data, shown in the table, using the formula
\[V = a \times b^N\]
where \(N\) is the number of years since 2009 and \(a\) and \(b\) are constants.
Year
2009
2010
2011
2012
2013
2014
2015
2016
Average Weekly Sales £\(V\) million
56.4
74.5
86.9
97.7
109.3
141.9
(a) Victoria wishes to determine the values of \(a\) and \(b\) in her formula.
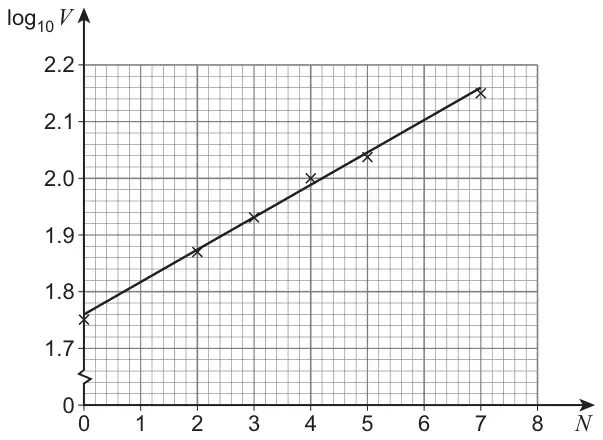
To do this she plots a graph of \(\log_{10} V\) against \(N\) and then draws a line of best fit as shown in the diagram below.
The equation of Victoria’s line of best fit is
\[\log_{10} V = 0.057N + 1.76\]
(i) Use the equation of Victoria’s line of best fit to show that, correct to three significant figures, \(a = 57.5\) [1 mark]
(ii) Use the equation of Victoria’s line of best fit to find the value of \(b\)
Give your answer to three significant figures. [1 mark]
(b) According to Victoria’s model, state the yearly percentage increase in the average weekly value of online grocery sales. [1 mark]
(c)
(i) Use Victoria’s model to predict the average weekly value of online grocery sales in 2025. [2 marks]
(ii) Explain why the prediction made in part (c)(i) may be unreliable. [1 mark]
Mark scheme (a)
Scheme
Marks
AO
(i) Writes down at least one of the following: \(\log_{10} a = 1.76\) or \(\log a = 1.76\) or \(a = 10^{1.76}\) to show that \(a\) is AWRT 57.5 AG
B1
1.1b
(1)
(ii) Obtains \(b\) = 1.14 AWRT 1.14
B1
1.1b
(1)
Typical solution
(i)
\[\log_{10} a = 1.76\]\[a = 10^{1.76}\]\[a = 57.5\]
(ii)
\(b\) = 1.14
Mark scheme (b)
Scheme
Marks
AO
Obtains their \(100(b - 1)\) FT their \(b\) where \(b\) > 1
B1F
3.2a
(1)
Typical solution
14%
Mark scheme (c)
Scheme
Marks
AO
(i) Substitutes \(N\) = 16 into \(\log_{10} V = 0.057N + 1.76\) or Substitutes \(N\) = 16 into \(V = a \times b^N\) using their \(b\) value and \(a = 57.5\) or AWRT 57.5
PI AWRT 467.9 or 469.9
M1
3.4
Obtains a value in the interval [£467 800 000, £470 000 000] Must include £ or pounds.
Accept use of millions. For example: £467.9 million.
A1
3.2a
(2)
(ii) Gives a reason, in context, why extrapolation from the model may not be valid.
Must include reference to sales or shopping. For example:
Sales increased in 2020 due to the pandemic.
Sales would be impacted by supply shortages.
More people shopping in person after a pandemic.
People shop in supermarkets instead of online as technology becomes too expensive.
Accept any specific reference to an event since 2016 that would impact on sales/shopping.
E1
3.5b
(1)
(6 marks)
Typical solution
(i)
\[V = 57.5 \times 1.14^{16}\]\[= 467.9\]
£467 900 000
(ii)
Sales may suddenly fall due to unforeseen circumstances such as a pandemic.