
June 2023 Paper 3 Q9
9 A small country started using solar panels to produce electrical energy in the year 2000. Electricity production is measured in megawatt hours (MWh).
For the period from 2000 to 2009, the annual electrical energy produced using solar panels can be modelled by the equation \(P = 0.3\mathrm{e}^{0.5t}\), where \(P\) is the annual amount of electricity produced in MWh and \(t\) is the time in years after the year 2000.
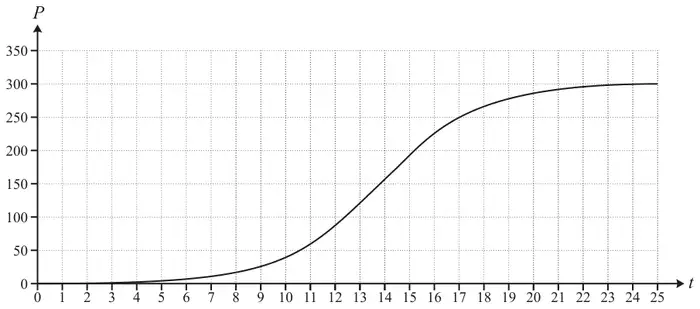
An alternative model is suggested; the curve representing this model is shown in Fig. 9.
| Scheme | Marks | AO |
|---|---|---|
| (i) 0.3 [MWh] | B1 | 3.4 |
| [1] | ||
| (ii) 27 [MWh] | B1 | 3.4 |
| [1] |
Notes
(ii) B1: \(P = 0.3\mathrm{e}^{0.5 \times 9} = 27.0051\ldots\)
| Scheme | Marks | AO |
|---|---|---|
Reason why model is not suitable, e.g.
| B1 | 3.5b |
| [1] |
Notes
B1: Very large prediction in 2025 (80 501MWh) in unrealistic
“Extrapolation” alone does not score, it would need explaining/clarifying
| Scheme | Marks | AO |
|---|---|---|
| The graph gives a value close to 27 when \(t = 9\) | E1 | 3.2b |
| [1] |
Notes
E1: Correct reasoning (answer given)
| Scheme | Marks | AO |
|---|---|---|
(i) 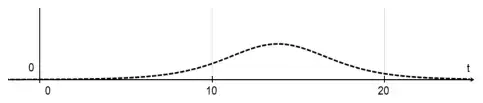 | B1 B1 | 2.2a 2.2a |
| [2] | ||
| (ii) 14 | B1 | 1.2 |
| [1] | ||
| (iii) This is when the rate of increase of electricity production is greatest | E1 | 3.2a |
| [1] |
Notes
(i) B1: Gradient increasing from near zero to maximum for value of \(t\) somewhere between 10 and 20
(i) B1: Gradient decreasing to near zero from max value
(ii) B1: Answer in range 13 to 15
| Scheme | Marks | AO |
|---|---|---|
| 300 [MWh] | B1 | 2.2a |
| [1] |
Notes
B1: Accept answer in range 300 to 305