
June 2023 Paper 1 Q11
11 The owners of an online shop believe that their sales can be modelled by \(S = ab^t\), where \(a\) and \(b\) are both positive constants, \(S\) is the number of items sold in a month and \(t\) is the number of complete months since starting their online shop.
The sales for the first six months are recorded, and the values of \(\log_{10}S\) are plotted against \(t\) in the graph below. The graph is repeated in the Printed Answer Booklet.
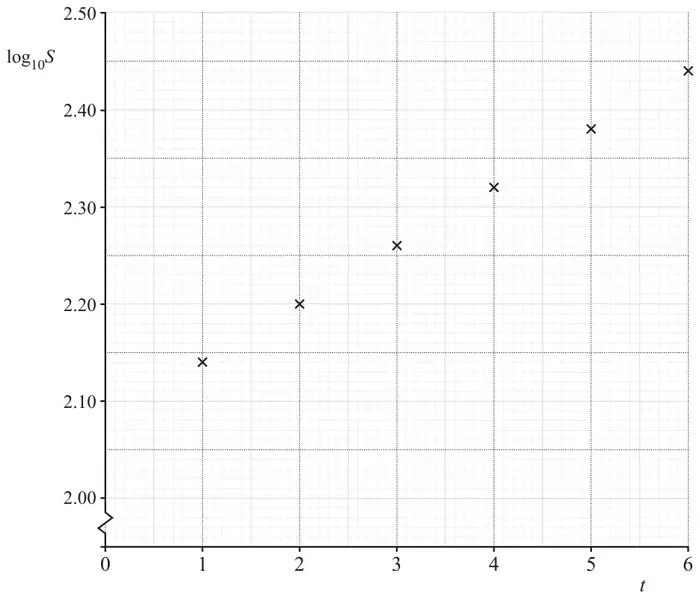
The owners believe that \(a = 120\) and \(b = 1.15\) are good estimates for the parameters in the model.
| Scheme | Marks | AO |
|---|---|---|
| \(\log_{10}S = \log_{10}(ab^t)\) \(\log_{10}S = \log_{10}a + \log_{10}b^t\) | M1 | 3.3 |
| \(\log_{10}S = t\log_{10}b + \log_{10}a\) | A1 | 3.3 |
| which is of the form \(Y = mX + c\) | A1 | 3.3 |
| [3] |
Notes
M1: Attempt to show reduction to linear form
Introduce logs on both sides, and correctly split to the sum of two terms
A1: Obtain correct equation
Condone no base; any bases seen must be 10
A0 for \(\log_{10}bt\) unless previously seen as \(t\log_{10}b\)
A1: Link to equation of straight line
Could instead refer to linear relationship
If M0 then allow SC B1 for statement such as \(S\) against \(t\) is an exponential function so \(\log S\) against \(t\) will give a straight line
Alternative method
| Scheme | Marks |
|---|---|
| \(\log_{10}S = mt + c\) \(S = 10^{mt + c}\) | M1 |
| \(S = 10^{mt} \times 10^c\) | A1 |
| which is of the form \(S = ab^t\) | A1 |
M1: Attempt equation of straight line, and attempt expression for \(S\)
Must be using \(\log_{10}S\) against \(t\)
Must use base of 10
A1: Correctly split into two terms
A1: Link to exponential model
| Scheme | Marks | AO |
|---|---|---|
| \(m = \log_{10}b = 0.06\) so \(b = 10^{0.06} = 1.15\) | B1 | 2.1 |
| \(c = \log_{10}a = 2.08\) so \(a = 10^{2.08} = 120\) | B1 | 2.1 |
| [2] |
Notes
B1: Link gradient of line of best fit to linear form and confirm \(b \approx 1.15\)
Allow \(m\) in range [0.055, 0.065]
Or \(\log_{10}1.15 = 0.06\) and compare to gradient
B1: Link intercept of line of best fit to linear form and confirm \(a \approx 120\)
Allow \(c\) in range [2.075, 2.085]
Or \(\log_{10}120 = 2.08\) and compare to intercept
Plotted points are linear so may not see line of best fit drawn
If substituting into formula (either given model or linear reduction) then
- B1 for finding and verifying any point that would be on the line of best fit
- B1 for finding and verifying a second point
| Scheme | Marks | AO |
|---|---|---|
| \(S = 120 \times 1.15^7\) | M1 | 3.4 |
| predicted sales are 319 items | A1 | 3.4 |
| [2] |
Notes
M1: Substitute \(t = 7\) into given model
soi
A1: Conclude with integer value
Accept 320 items
| Scheme | Marks | AO |
|---|---|---|
| (i) GP with \(a = 138\) and \(r = 1.15\) | B1 | 3.1b |
| \(\dfrac{138\left(1 - 1.15^t\right)}{1 - 1.15} = 70000\) | M1* | 3.1b |
| \(1.15^t = 77.087\) | M1dep* | 1.1 |
| \(t = 31.088\ldots\) hence 32 months | A1 | 3.2a |
| [4] | ||
| (ii) Unlikely to be reliable as sales may not continue in same pattern as market could become saturated | B1 | 3.2b |
| [1] |
Notes
(d)(i)
B1: State or imply sum of GP with \(a\) as 120 or 138, and \(r\) as 1.15
Could be implied by attempt to use GP sum formula (but not just \(n\)th term) – allow slip as long as clearly sum being considered
M1*: Attempt sum of GP, with \(a = 120\) or 138 and \(r = 1.15\), related to 70000
Must be correct sum formula
May have \(n\) not \(t\) throughout
Allow \(r = 1.15^{t+1}\) with \(a = 120\) but this is B1 M1 only, as not a valid method)
M1dep*: Attempt to rearrange equation as far as \(1.15^t =\)
Must now have \(a = 138\) (or equiv)
Allow sign errors only
Allow T&I as not DR
A1: Obtain 32 (‘months not required’)
www
If 32 given as answer only then allow full marks; if any method shown then mark using the main scheme
Allow BOD with any inequality signs
(d)(ii)
B1: State or imply that the model is unlikely to be valid, with a sensible reason why – could refer to reason why pattern may not continue or extrapolation not being reliable
- Decrease in demand
- Increase in competition
- No values beyond \(t = 6\) so pattern unknown
- Reason why sales are likely to level off / plateau or unlikely to continue to increase (‘other factors’ not enough)
- Item sales may vary according to season