
June 2024 Paper 1 Q1
1
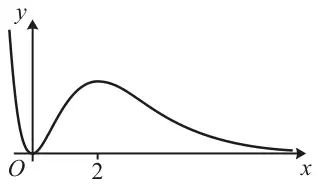
The diagram shows part of the curve \(y = x^2\mathrm{e}^{-x}\).
Give your answer correct to 3 significant figures. [4]
| Scheme | Marks | AO |
|---|---|---|
| \(0.5 \times 0.5\,\{0 + 4\mathrm{e}^{-2} + 2\left(0.25\mathrm{e}^{-0.5} + \mathrm{e}^{-1} + 2.25\mathrm{e}^{-1.5}\right)\}\) | B1 | 1.1a |
| Attempt to find area between \(x = 0\) and \(x = 2\), using \(k\{y_0 + y_n + 2(y_1 + \ldots + y_{n-1})\}\) | M1* | 1.1a |
| Use \(k = 0.5 \times 0.5\) soi | M1d* | 1.1a |
| \(= 0.646\) | A1 | 1.1 |
| [4] |
Notes
B1: State the 4 correct non-zero \(y\)-values and no others.
Exact values (including unsimplified) or decimal equivs (0, 0.1516, 0.3679, 0.5020, 0.5413), which could be truncated or rounded.
For the first value, if \(0\mathrm{e}^0 = 1\) is seen then allow credit for the unsimplified value; if however it is only ever seen as 1 then this is B0 but M1M1 could still be awarded.
B0 if other ordinates seen, unless clearly not intended to be used.
M1*: Big brackets need to be seen or implied.
Attempts at \(y\)-values must be correctly placed (but no need to see \(y = 0\) explicitly).
If no earlier evidence of \(y\)-values seen (eg in a table) then allow M1 for the correct structure with 4 of the 5 values being correct.
Condone using more than 4 intervals as long as values equally spaced between \(x = 0\) and \(x = 2\).
M1d*: Dep on previous M1.
Or using \(k = 0.5h\), with \(h\) consistent with their different number of intervals.
A1: Obtain 0.646.
Allow answers > 3sf, as long as they round to 0.646.
A0 if not using 4 strips, even if 0.646 is obtained.
No credit if no evidence of using the trapezium rule shown.
Using separate strips (a triangle and then trapezia) is an acceptable method, and marks should be awarded as per the main MS (ie \(y\)-values / structure / widths / final answer).
| Scheme | Marks | AO |
|---|---|---|
| Use more trapezia, of a lesser width, over the same interval | B1 | 2.4 |
| [1] |
Notes
B1: Convincing reason.
Allow just ‘more trapezia’ or ‘narrower trapezia’.
Could refer to strips or intervals.
| Scheme | Marks | AO |
|---|---|---|
| E.g. There is a point of inflection within the given range… | B1 | 2.4 |
| … so the trapezia initially over-estimate but then under-estimate | B1 | 2.2a |
| [2] |
Notes
B1: Curve is both convex and concave.
Comment about the shape
Referring to increasing and decreasing gradients is correct, but increasing and decreasing curve is not.
Allow BOD if muddles about which part of the curve is convex and which is concave.
B1: The tops of trapezia are both above and below the curve.
Comment about the estimates
If candidates refer to ‘it’ rather than ‘trapezia’ then allow BOD.
B marks are independent.
See appendix for further examples (below).
Appendix: exemplar responses for Q1(c)
| Response | Mark | Comment |
|---|---|---|
| The graph is both convex & concave in the range. Therefore, the trapezia do not strictly all lie under or over the graph. | B1 B1 | |
| At the beginning the graph is convex and then concave, therefore some of the trapezia are overestimating and some underestimating. | B1 B1 | Condone if the order of convex and concave becomes muddled. |
| Part of the graph is concave, and part of the graph is convex and so you cannot tell as some of the over/underestimates would cancel out. | B1 B1BOD | Comment about curve is sufficient. BOD for some recognition that this is leading to both over and underestimates within the range. |
| The concavity of the function changes in the range 0 to 2 | B1 B0 | Acceptable first comment about the shape. No comment about the estimate. |
| Because the gradient increases and decreases, so can’t tell if under or overestimate. | B1 B0 | The first comment is acceptable as it describes the nature of the curve in the range. No reason why it may be both an overestimate and underestimate. |
| As the trapezia lines go both over the curve and under the curve, there are parts which are overestimating and parts which are underestimating. | B0 B1 | No comment about the shape of the curve. |
| When concave it is an underestimate, when convex it is an overestimate. | B0 B1 BOD | No specific comment about the shape of this curve. Allow BOD for the statement about the nature of the estimate. |
| The trapezia will both go over and under the curve, given its shape so hard to tell if over or underestimate, | B0 B1 | No details about the nature of ‘its shape’. Second comment is fine. |
| At the beginning the curve is curving upwards so it will be an overestimate and later curve is curving downwards so will be an underestimate. | B0 B1 | ‘Curving downwards’ is too vague. Second comment is fine. |
| Because the rectangles go over and under the curve. | B0 B0 | No comment made about the shape of the graph. ‘Rectangles’ not acceptable as it is the Trapezium Rule. |
| The diagram has an unequal slope so can’t tell if over or underestimate. | B0 B0 | Comment about shape not sufficient. Comment about estimate is not sufficient. |