
June 2022 Paper 1 Q1
1
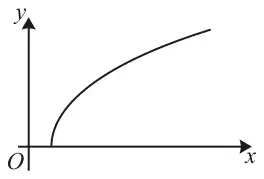
The diagram shows part of the curve \(y = \sqrt{x^2 - 1}\).
Give your answer correct to 3 significant figures. [4]
| Scheme | Marks | AO |
|---|---|---|
| \(0.5 \times 0.5\left\{0 + 2\sqrt{2} + 2\left(\dfrac{\sqrt{5}}{2} + \sqrt{3} + \dfrac{\sqrt{21}}{2}\right)\right\}\) | B1 | 1.1a |
| Attempt to find area between \(x = 1\) and \(x = 3\), using \(k\{y_0 + y_n + 2(y_1 + \ldots + y_{n-1})\}\) | M1* | 1.1a |
| Use \(k = 0.5 \times 0.5\) soi | M1d* | 1.1a |
| \(= 3.28\) | A1 | 1.1 |
| [4] |
Notes
B1: State the 4 correct non-zero \(y\)-values and no others.
Exact values (including unsimplified) or decimal equivs (0, 1.12, 1.73, 2.29, 2.83) – 3sf or better
B0 if other ordinates seen unless clearly not intended to be used
M1*: Big brackets need to be seen or implied
\(y\)-values must be correctly placed
Must be using attempts for at least 4 \(y\)-values (but no need to see \(y = 0\) explicitly)
Condone using other than 4 intervals as long as values equally spaced between \(x = 1\) and \(x = 3\)
M1d*: Dep on previous M1
Or using \(k = 0.5h\), \(h\) consistent with their different number of intervals
A1: Obtain 3.28, or better
Allow answers to > 3sf, as long as they round to 3.28
| Scheme | Marks | AO |
|---|---|---|
| Under-estimate, as the tops of the trapezia are below the curve | B1 | 3.2b |
| [1] |
Notes
B1: Under-estimate, with any valid explanation
Condone just ‘trapezia under curve’
Or curve is concave / decreasing gradient (not decreasing function)
Accept explanation on diagrams
Allow comparing to true value (3.36)
B0 if any additional incorrect or contradictory statements
| Scheme | Marks | AO |
|---|---|---|
| Use more trapezia, of a lesser width, between the same limits | B1 | 3.2b |
| [1] |
Notes
B1: Convincing reason
Condone just ‘more trapezia’ or ‘narrower trapezia’
Could refer to strips or intervals