
June 2025 Paper 2 Q3
3 The diagram shows part of the curve with equation \(y = \sqrt{x^2 + 3}\), between \(x = 0\) and \(x = 2\).
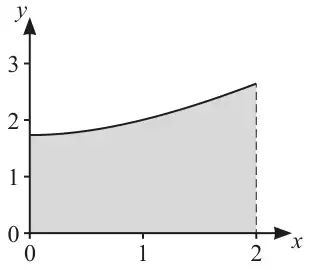
| Scheme | Marks | AO |
|---|---|---|
| (i) | M1 | 2.1 |
| \(\dfrac{1}{2} \times 0.5 \times \left\{\sqrt{3} + \sqrt{7} + 2\left(\sqrt{3.25} + 2 + \sqrt{5.25}\right)\right\}\) | A1 | 1.1 |
| \(= 4.14\) (3sf) | A1 | 1.1 |
| [3] | ||
| (ii) \(\left[0.5 \times \left(\sqrt{3} + \sqrt{3.25} + 2 + \sqrt{5.25}\right) =\right] 3.91\) (3sf) \(\left[0.5 \times \left(\sqrt{3.25} + 2 + \sqrt{5.25} + \sqrt{7}\right) =\right] 4.37\) (3sf) | B1 B1 | 1.1 1.1 |
| [2] |
Notes
(a)(i)
M1: Correct formula oe with \(\geqslant 4\) \(y\)-values correct or omitting the \(2 \times\) May see \(\frac{1}{2} \times 0.5 \times \{1.732\ldots + 2.645\ldots + 2(1.803\ldots + 2 + 2.291\ldots)\}\)
A1: All correct. May see \(\sqrt{\frac{13}{4}}\) and \(\sqrt{\frac{21}{4}}\) oe
A1: awrt 4.14
Answer only without working scores 0/3
(a)(ii)
B1: \(0.5 \times (1.7321 + 1.8023 + 2 + 2.2913)\) awrt 3.91
B1: \(0.5 \times (1.8028 + 2 + 2.2913 + 2.6458)\) awrt 4.37
Allow B1B1 for these values seen anywhere (e.g. may see lower/upper switched). Must be evaluated.
| Scheme | Marks | AO |
|---|---|---|
| M1 | 1.2 | |
| \(\displaystyle\lim_{\delta x \to 0} \sum_{[x=]0}^{2} \left(\sqrt{x^2 + 3}\right)\delta x\) | A1 | 2.5 |
| [2] |
Notes
M1: M1 for a partial or incomplete expression, e.g. missing (0,2) \(\displaystyle\lim_{\delta x \to 0} \sum \left(\sqrt{x^2 + 3}\right)\delta x\). Allow any expression involving \(\lim\), \(\Sigma\), \(\sqrt{x^2 + 3}\) (or \(y\)) and \(\delta x\) for this mark.
A1: oe (must be in terms of \(x\), not \(y\)).