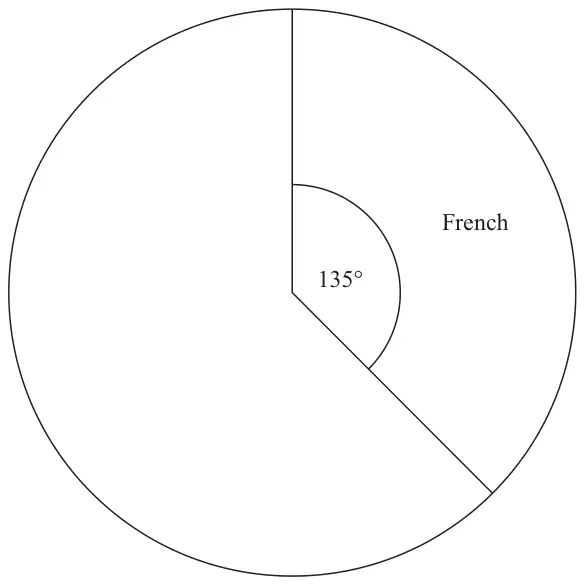
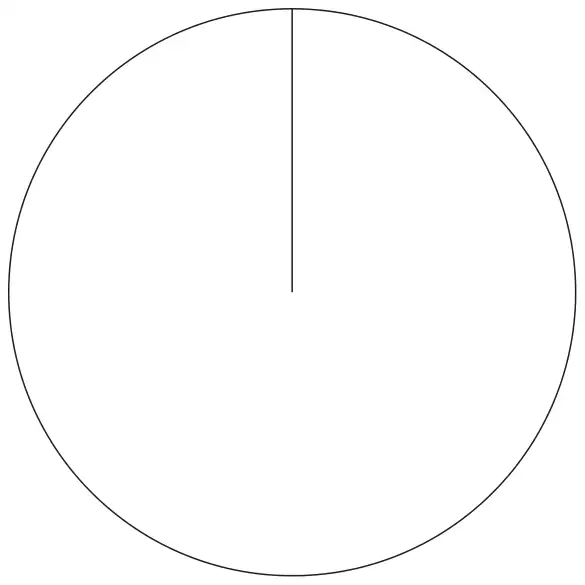
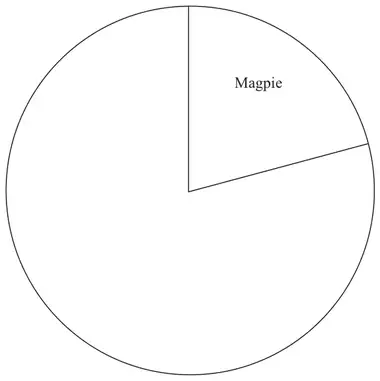
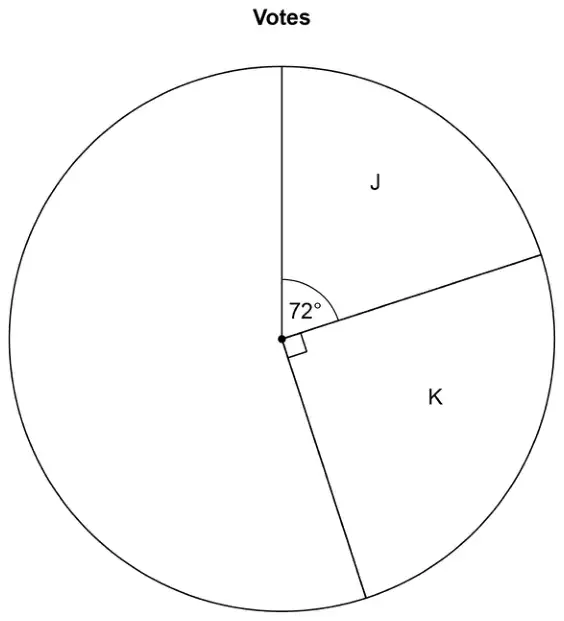
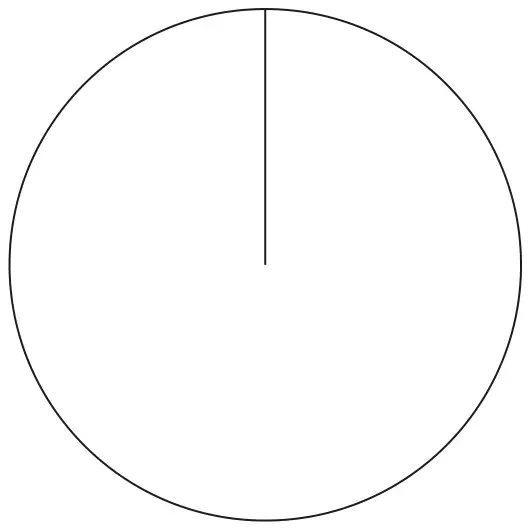
14 120 students in Year 10 each choose one language to study.
The table below shows information about their choices.
Language
Number of students
French
45
Mandarin
20
Spanish
55
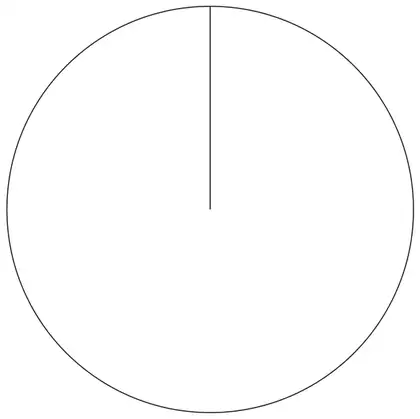
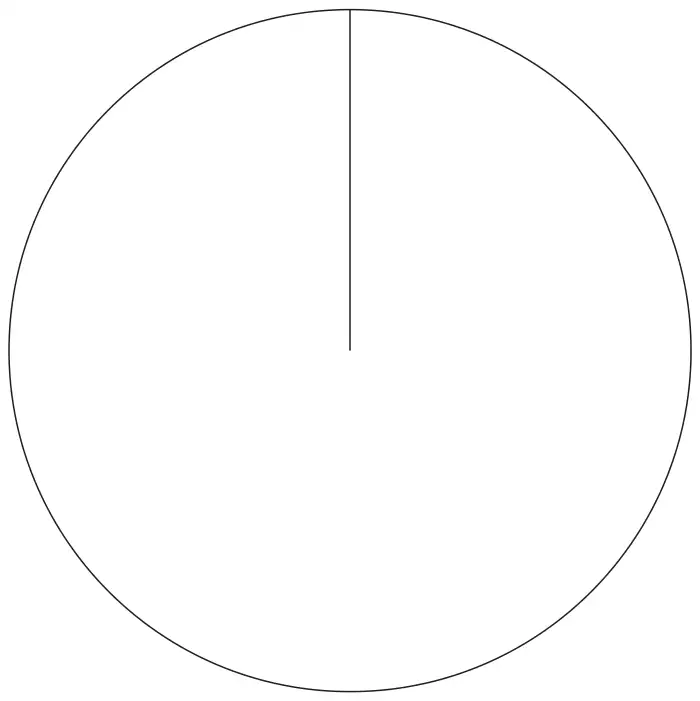
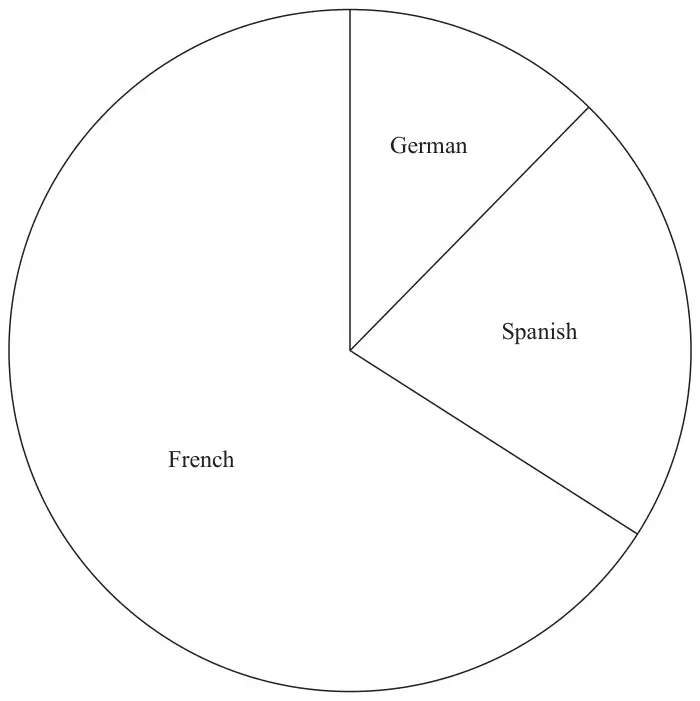
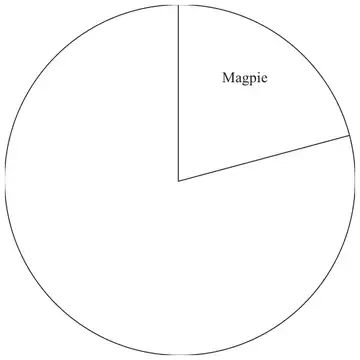
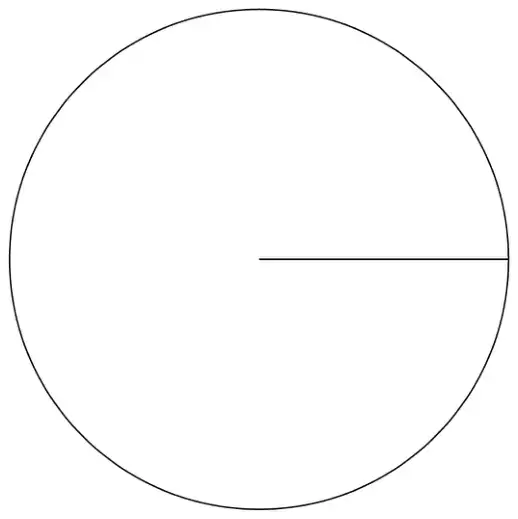
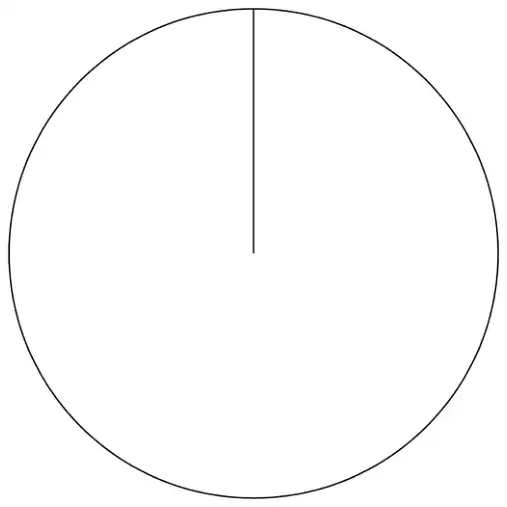
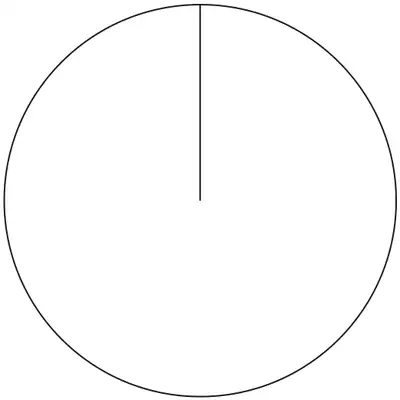
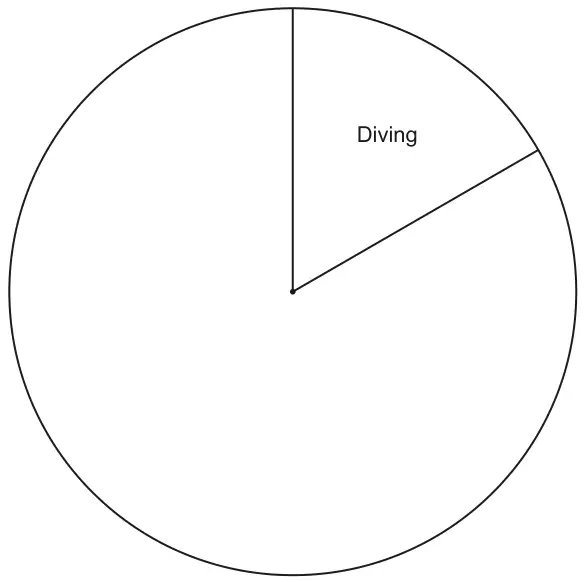
(a) Complete the accurate pie chart to show this information.(3)
In another pie chart the number of students in Year 11 studying French is represented by an angle of \(150^\circ\)
Navi says,
“This means that French was chosen by more students in Year 11 than by students in Year 10”
(b) Is Navi correct? Explain why you think this. (1)
Mark scheme (a)
Answer
Mark
Mark scheme
Complete pie chart
M1
for a full method to find at least one angle, eg \(\dfrac{360}{(45 + 20 + 55)} \times 20\ (= 60)\) oe or \(\dfrac{55}{(45 + 20 + 55)} \times 360\ (= 165)\) oe or \(\dfrac{135}{45} \times 20\ (= 60)\) or \(\dfrac{135}{45} \times 55\ (= 165)\)
A1
for both angles correctly calculated or for one correct and accurately drawn angle
A1
for a fully correct labelled pie chart
Additional guidance
Award this mark even if more than 3 sectors are drawn
Do not award for drawing if the intention is to show more than 3 sectors
Each sector must be labelled with the associated language, not just angle size.
Mark scheme (b)
Answer
Mark
Mark scheme
Explanation
C1
for explanation relating to population size,
Acceptable examples No as we do not know the number of students in year 11 It would be true if the number of students in each year was the same No as pie charts show proportions not numbers (No) as the populations may not be equal No there may be more/less students in Yr10/Yr 11 Could be different number of degrees per person (on Yr 11 pie chart) Yes but only if there are the same number of students We don’t know how many students are in year 10 compared to year 11
Not acceptable examples Yes as \(150^\circ\) is bigger than \(135^\circ\) We don’t know how many students are in year 10
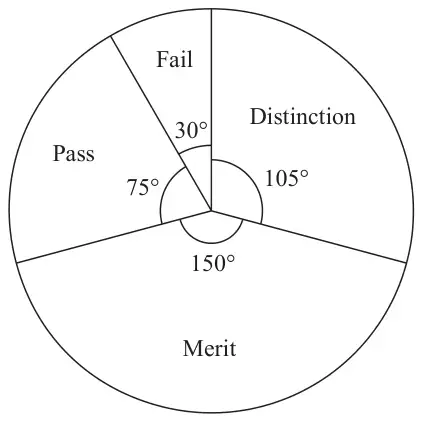
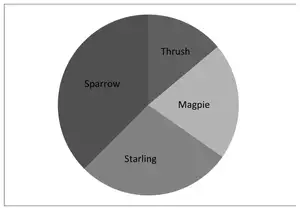
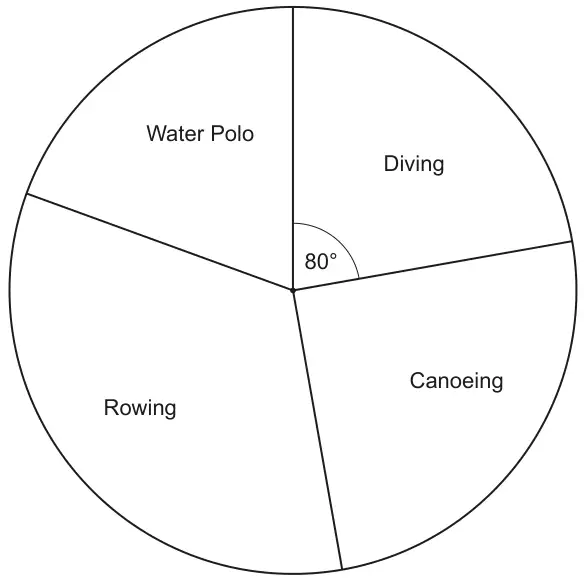
The pie chart shows information about the grades the students got.
(a) Write down the modal grade. (1)
7 students got distinction.
(b) Work out the total number of students who took the guitar exam. (3)
Mark scheme (a)
Answer
Mark
Mark scheme
Merit
B1
cao
Mark scheme (b)
Answer
Mark
Mark scheme
24
M1
for beginning to work with proportion eg \(105 \div 7\ (= 15)\) or \(7 \div 105\ (= 0.07 \text{ or } 0.06....)\) or \(360 \times 7\ (= 2520)\) or \(\dfrac{360}{105}\ (= 3.4…)\) or works out a quantity for one sector eg \(\dfrac{7}{105} \times 30\ (= 2)\), \(\dfrac{7}{105} \times 75\ (= 5)\), \(\dfrac{7}{105} \times 150\ (= 10)\),
M1
for a complete method eg \(\dfrac{360}{105} \times 7\) oe or \(\text{``}3.4…\text{''} \times 7\) or \(360 \div \text{``}15\text{''}\) or \(360 \times \text{``}0.06..\text{''}\) or \(\text{``}2520\text{''} \div 105\)
or \(7 + \text{``}2\text{''} + \text{``}5\text{''} + \text{``}10\text{''}\)
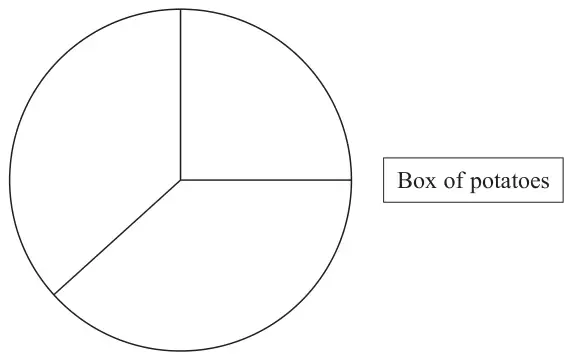
16 There are three different types of potato in a box.
The table gives the number of each type of potato.
Type of potato
Number of potatoes
Jersey Royal
90
Charlotte
105
Maris Piper
105
Salim draws this pie chart for the information in the table.
Write down two different things that are wrong or misleading with this pie chart. (2)
Mark scheme
Answer
Mark
Mark scheme
Comments
C1
makes some comment about the labels Acceptable examples states what labels should be (not angles) labels are missing The label in the table does not match the label with the pie chart
Not acceptable examples angles not marked on the pie chart
C1
comments about the inaccuracy of the angles in the pie chart Acceptable examples pie chart is not accurate / should be 108, 126, 126 angles drawn inaccurately They haven’t converted the number of potatoes to angles Need to scale the numbers in the table
Not acceptable examples pie chart is wrong / sectors are the wrong size (the angles) do not add up to 360
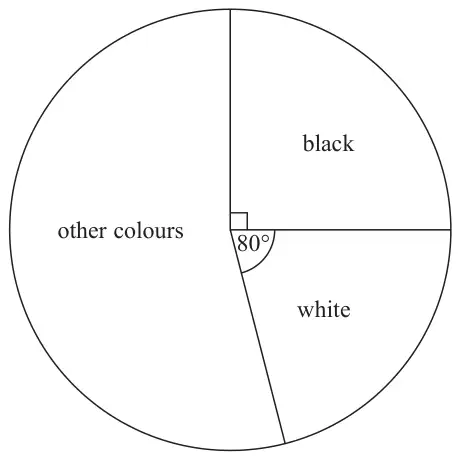
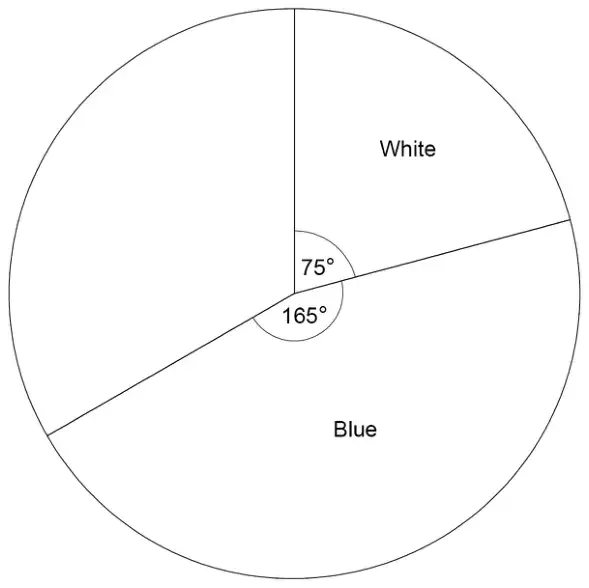
16 The pie chart gives information about the colour of each car in a car park.
There are 135 black cars in the car park.
(a) Work out the number of white cars in the car park. (3)
There are 50 grey cars in the car park. A car in the car park is picked at random.
(b) Find the probability that this car is grey. (2)
Mark scheme (a)
Answer
Mark
Mark scheme
120
M1
for sensible use of proportion eg \(\dfrac{135}{90}\ (= 1.5)\) or \(\dfrac{90}{135}\ \left(= \dfrac{2}{3}\right)\) or \(135 \times 4\ (= 540)\) or \(135 \div 9\ (= 15)\) or \(80 \div 90\ (= 0.888...)\)
M1
for a complete method eg \(80 \times \text{``}1.5\text{''}\) or \(80 \div \text{``}\dfrac{2}{3}\text{''}\) or \(\text{``}540\text{''} \times \dfrac{80}{360}\) or \(\text{``}15\text{''} \times 8\) or \(\text{``}0.888...\text{''} \times 135\)
A1
cao
Additional guidance
ie \(135 \div 9\) but not \(135 \div 10\) without \(80 \div 9\)
Mark scheme (b)
Answer
Mark
Mark scheme
\(\dfrac{50}{540}\)
M1
for method to find total number of cars, eg \(135 \times \dfrac{360}{90}\ (= 540)\) or for \(\dfrac{50}{135} \times \dfrac{1}{4}\) oe or begins to work with probability by using a numerator of 50 eg \(\dfrac{50}{a}\) where \(a \gt 50\) and an integer
A1
for \(\dfrac{50}{540}\) oe ft “540” from part (a)
Additional guidance
Accept any equivalent fraction, decimal form 0.09(25..) or percentage form 9(.25..)%
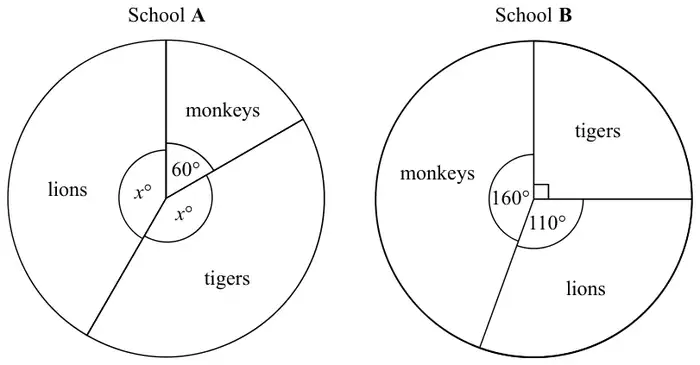
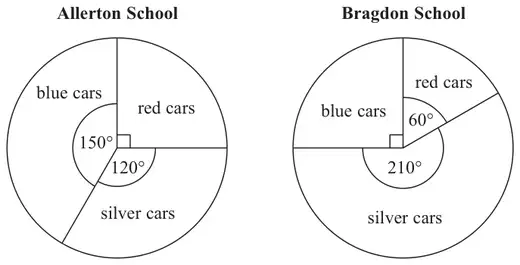
18 The pie charts show information about the favourite animal of each student at school A and of each student at school B.
There are 480 students at school A. There are 760 students at school B.
Henry says,
“The same number of students at each school have tigers as their favourite animal.”
Is Henry correct? You must show how you get your answer. (4)
Mark scheme
Answer
Mark
Mark scheme
No with fully correct figures
M1
for \((360 - 60) \div 2\ (= 150)\) or \(\dfrac{60}{360} \times 480\ (= 80)\) oe
M1
(dep) for method to find required number of students in School A eg \(\dfrac{\text{``}150\text{''}}{360} \times 480\ (= 200)\) or \((480 - \text{``}80\text{''}) \div 2\ (= 200)\)
M1
for method to find required number of students in School B, eg \(\dfrac{\text{``}90\text{''}}{360} \times 760\ (= 190)\) or \(760 \div 4\ (= 190)\)
C1
for No with correct figures Acceptable examples No, 200 and 190 He is wrong, School A has 10 more Not acceptable examples Yes .... No, School A had 20 more [incorrect figures]
Additional guidance
Angle of 150° may be seen on diagram
ft the angle of 90 eg from \(360 - 160 - 110\) calculated incorrectly, or measured incorrectly from the diagram within the range 88 to 92
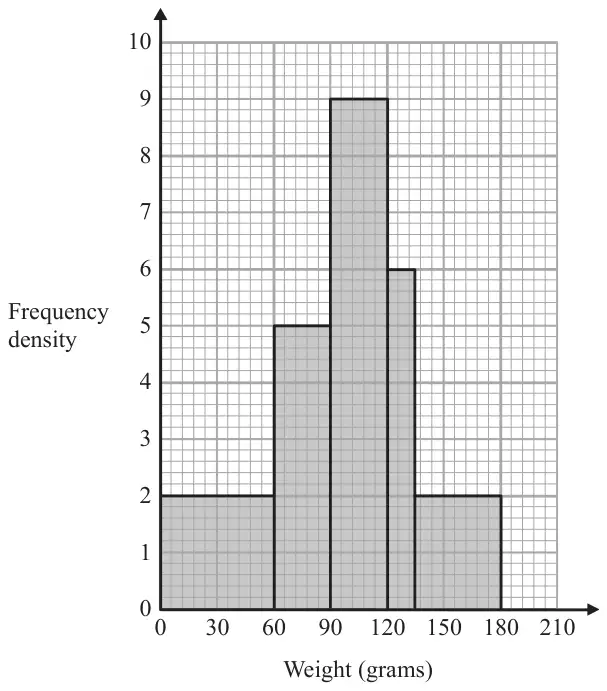
21 The histogram gives information about the distribution of the weights of some onions grown by a farmer.
Onions less than 60 grams in weight are used for pickling. Onions greater than 120 grams in weight are sold at the market. The rest of the onions are sent to a food processing factory.
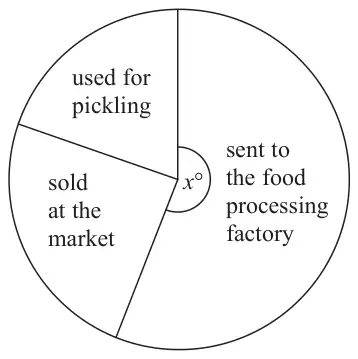
A pie chart is drawn using the information above to show what the farmer does with the onions he grows.
The angle of the sector for the onions sent to the food processing factory is \(x^\circ\).
Work out the value of \(x\). (4)
Mark scheme
Answer
Mark
Mark scheme
210
M1
for method to find total frequency, \(60 \times 2\ (= 120) + 30 \times 5\ (= 150) + 30 \times 9\ (= 270) + 15 \times 6\ (= 90) + 45 \times 2\ (= 90)\) or 720 OR for method to find the total area, \(4 + 5 + 9 + 3 + 3\) (= 24 cm2)
M1
for finding the number of onions less than 60 g or greater than 120 g = \(120 + 90 + 90\ (= 300)\), OR for finding the number of onions between 60 g and 120 g = \(150 + 270\ (= 420)\) OR for finding the area under the graph less than 60 or greater than 120 = \(4 + 3 + 3\) (= 10 cm2) OR for finding the area under the graph between 60 and 120 = \(5 + 9\) (= 14 cm2)
M1
(dep M2) for \(1 - \dfrac{\text{``}300\text{''}}{\text{``}720\text{''}}\ \left(= \dfrac{7}{12}\right)\) oe OR for \(\dfrac{\text{``}420\text{''}}{\text{``}720\text{''}}\ \left(= \dfrac{7}{12}\right)\) oe OR for \(\dfrac{\text{``}14\text{''}}{\text{``}24\text{''}}\ \left(= \dfrac{7}{12}\right)\) oe
A1
cao
Additional guidance
Accept one error in total for the award of the method marks 24 must be from adding areas of bars not heights of bars
14 must be from adding areas of bars not heights of bars
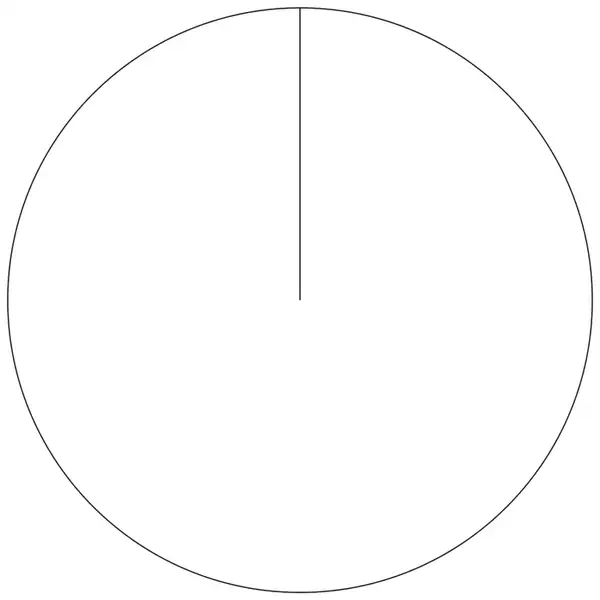
12 Joan asked each of 60 people to name their favourite vegetable.
Here are her results.
Vegetable
Frequency
Peas
24
Carrots
16
Mushrooms
20
Draw an accurate pie chart for her results. (3)
Mark scheme
Answer
Mark
Mark scheme
Correct pie chart
M1
for method to find at least one angle eg P: \(360 \div 60 \times 24\) (=144) or C: \(360 \div 60 \times 16\) (=96) or M: \(360 \div 60 \times 20\) (=120)
A1
for all 3 angles correctly calculated OR at least one accurately drawn angle
A1
fully a correct labelled pie chart
Additional guidance
Use the overlay Working may be seen in or by the table
If three equal sectors of 120° with no working award 0 marks
Labels as “vegetables” from table not just angle size. Accept P, C, M
12 A group of football fans were asked what their half time snack was.
The table below gives information about their answers.
Snack
Number of fans
burger
11
pie
17
hot dog
8
Draw an accurate pie chart for this information. (3)
Mark scheme
Answer
Mark
Mark scheme
Correct pie chart
M1
for method to find at least one angle eg B: \(360 \div \text{``}36\text{''} \times 11\ (= 110)\) or P: \(360 \div \text{``}36\text{''} \times 17\ (= 170)\) or HD: \(360 \div \text{``}36\text{''} \times 8\ (= 80)\)
A1
for at all 3 angles correctly calculated OR at least one accurately drawn angle
A1
for a fully correct labelled pie chart
Additional guidance
Accept numbers if present in Number of fan column eg 0 added to a number is acceptable for this mark.
Labels as “snacks” from table not just angle size.
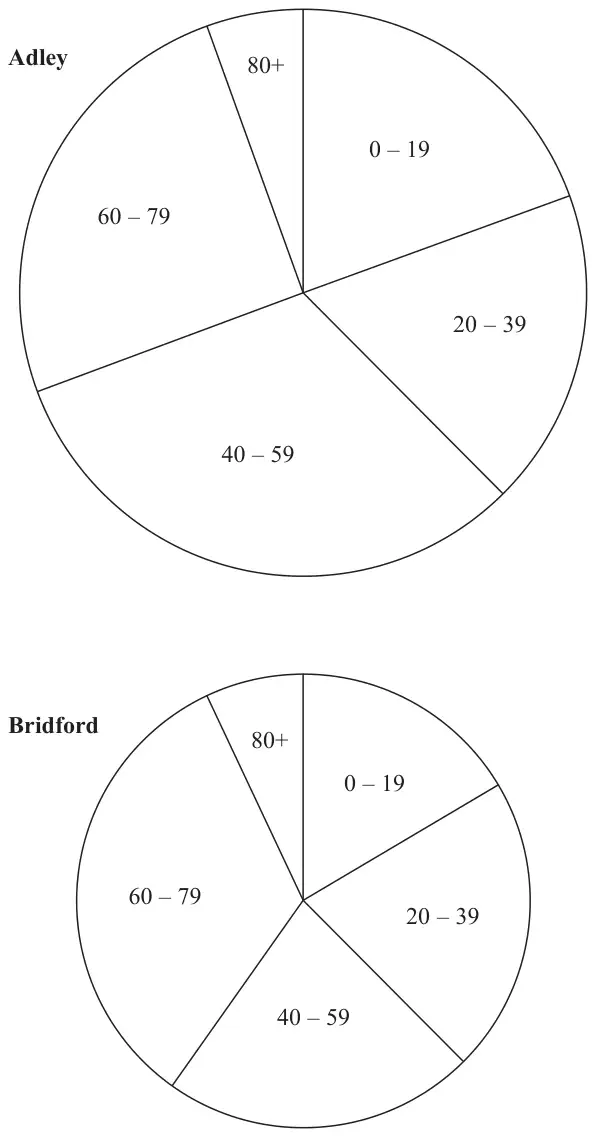
11 The pie charts give information about the ages, in years, of people living in two towns, Adley and Bridford.
Diagrams accurately drawn
The ratio of the number of people living in Adley to the number of people living in Bridford is given by the ratio of the areas of the pie charts.
What proportion of the total number of people living in these two towns live in Adley and are aged 0 – 19? Give your answer correct to 3 significant figures. (3)
Mark scheme
Answer
Mark
Notes
0.119
P1
for starting the process, eg finds area \(25\pi\) or \(16\pi\) oe, or finds angle for town A, 0 – 19 \((70^\circ)\), may be on diagram
P1
for a complete process, eg \(\dfrac{70}{360} \times \dfrac{25\pi}{41\pi}\)
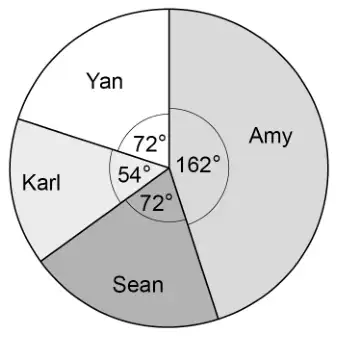
(a) What fraction of the 60 students did not walk to school? (2)
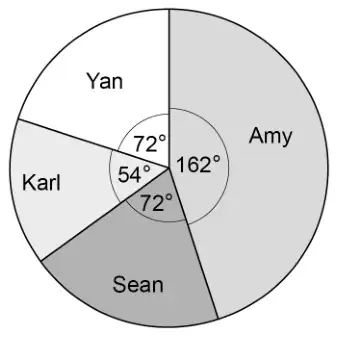
(b) Complete the pie chart for the information in the table.(4)
Mark scheme (a)
Answer
Mark
Notes
\(\dfrac{33}{60}\)
M1
for method to find number of students who did not walk to school eg \(15 + 12 + 6\) or \(60 - 27\ (= 33)\) or 0.55 or for \(1 - \dfrac{27}{60}\)
A1
for \(\dfrac{33}{60}\) or equivalent fraction
Mark scheme (b)
Answer
Mark
Notes
Pie chart drawn
M1
for method to find the angle for at least one sector eg \(\dfrac{27}{60} \times 360\), \(\dfrac{12}{60} \times 360\), \(\dfrac{6}{60} \times 360\), \(27 \div \dfrac{60}{360}\), \(12 \div \dfrac{60}{360}\), \(6 \div \dfrac{60}{360}\) oe (0.166..) NB: could be implied by one angle drawn accurately.
M1
for drawing at least one sector accurately (from 4 sectors) eg \(162^\circ\) or \(72^\circ\) or \(36^\circ\)
A1
for an accurately drawn pie chart
B1
(dep on 4 sectors with at least one accurately drawn) for showing labels Walk Car Bicycle
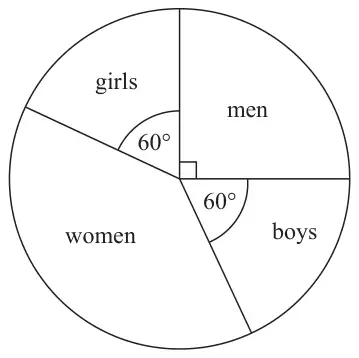
The pie chart above gives information about the people who went to a shop last week.
(a) What fraction of the people were girls? Give your answer in its simplest form. (2)
30 boys went to the shop.
(b) Work out the number of women who went to the shop. (3)
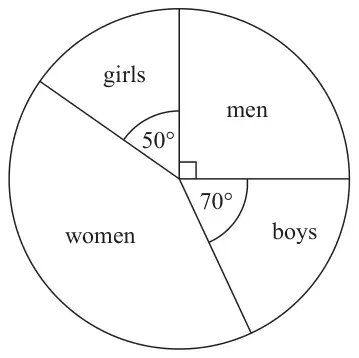
The pie chart below gives information about the people who went to the same shop this week.
Diagram NOT accurately drawn
Laurent says, “The pie chart shows that more boys went to the shop this week than last week.”
(c) Is Laurent correct? Explain your answer. (1)
Mark scheme (a)
Answer
Mark
Notes
\(\frac{1}{6}\)
2
B2 cao (B1 for any equivalent fraction)
Mark scheme (b)
Answer
Mark
Notes
75
3
M1 for method to work out degree equivalent of 1 person e.g. \(60 \div 30\) (= 2) M1 for a complete method to work out number of women e.g. \((360 - 60 - 60 - 90) \div \text{``}2\text{''}\) oe A1 cao
or M1 for complete method to work out angle of women sector eg \(360 - 60 - 60 - 90\) (= 150) M1 for a complete method to work out number of women e.g. \((\text{``}150\text{''} \div 60) \times 30\) oe A1 cao
Mark scheme (c)
Answer
Mark
Notes
Can’t tell or No (supported)
1
B1 for a convincing reason e.g. there is no information about the population size this week
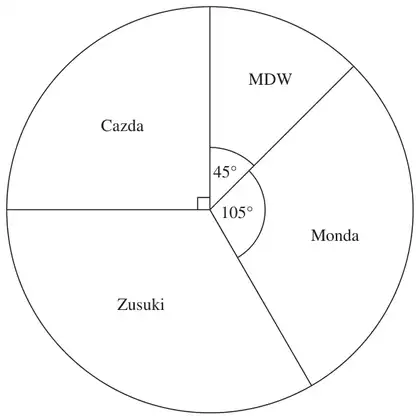
8 Some drivers are asked which make of car they like best. The pie chart and table show some information about their answers.
Complete the table. (4)
Make of car
Number of drivers
Angle of sector
MDW
18
\(45^\circ\)
Cazda
\(90^\circ\)
Zusuki
48
Monda
\(105^\circ\)
Mark scheme
Answer
Mark
Notes
36
1
B1 cao for Cazda
\(120^\circ\)
1
B1 cao for Zusuki
42
2
M1 for correct method from using \(105^\circ\) eg \(18 \div 45 \times 105\), \(\text{``}36\text{''} \div 90 \times 105\) or from table eg Cazda \(\text{``}36\text{''} \times 4 - (18 + 36 + 48)\) A1 for 42 or ft values from their table.
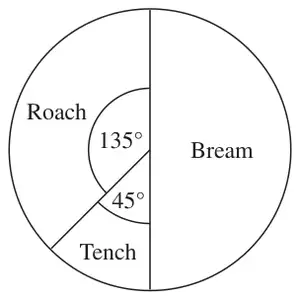
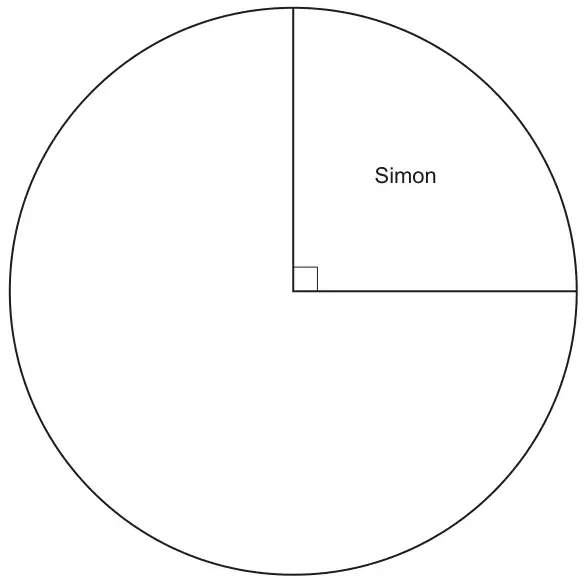
19 The pie chart shows information about the types of fish Simon caught on Saturday.
Simon caught 2 tench.
(a) Work out the total number of fish Simon caught. (2)
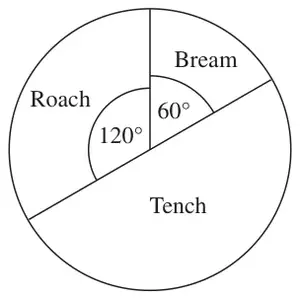
This pie chart shows information about the types of fish Asif caught on Saturday.
Debbie says,
“The pie charts show that Simon caught more roach than Asif caught on Saturday.”
(b) Is Debbie correct? Explain your answer. (1)
Mark scheme (a)
Answer
Mark
Notes
16
2
M1 for \(360 \div 45\) oe or \(2 \times 8\) or Roach identified as 6 or Bream identified as 8 A1 cao
Mark scheme (b)
Answer
Mark
Notes
No
1
B1 for ‘No’ and correct explanation, e.g. the pie charts only show that the proportions OR explains that she could be correct if the total number of fish is the same in each chart OR explains that we don’t know if she is correct because the total number of fish is not known.
17 The table gives information about the results of the matches a football team played.
Result
Frequency
Won
28
Drawn
12
Lost
20
Draw an accurate pie chart to show this information.
(4)
Mark scheme
Answer
Mark
Notes
168, 72, 120
4
M1 for evidence of method for at least one angle (could be implied by working or one correct angle on pie chart or in table) A2 for all angles drawn correctly ±2° (A1 for at least one angle drawn correctly or all angles correct in table) B1 for sectors labelled with results (dependent on at least one angle drawn correctly and exactly three sectors)
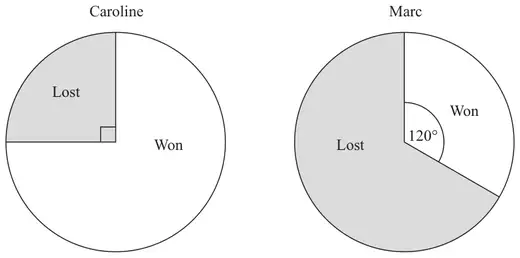
The pie charts show information about the number of games Caroline and Marc each won last year. They also show information about the number of games Caroline and Marc each lost last year.
Caroline played 52 games. Marc played 150 games.
Marc won more games than Caroline.
How many more? (3)
Mark scheme
Answer
Mark
Notes
11
3
M1 for \(52 \times \dfrac{3}{4}\) (=39) oe or \(\dfrac{120}{360} \times 150\) (=50) oe M1 for \(52 \times \dfrac{3}{4}\) (=39) oe and \(\dfrac{120}{360} \times 150\) (=50) oe A1 cao
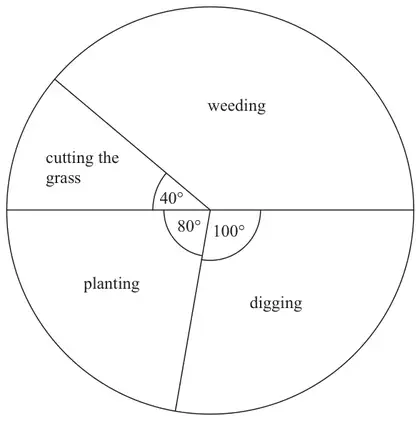
19 The pie chart shows some information about the time Gill spent working in her garden one month.
(a) What fraction of the time did Gill spend cutting the grass? (1)
Gill spent 7 hours weeding.
(b) How much time did Gill spend planting? hours (3)
Mark scheme (a)
Answer
Mark
Notes
\(\frac{40}{360}\)
1
B1 for \(\frac{40}{360}\) oe (ignore any incorrect simplification) Accept 0.11…. if no fraction shown
Mark scheme (b)
Answer
Mark
Notes
4
3
M1 for a correct method to find the angle of the ‘weeding’ sector If measured, accept an angle between 138 and 142 inc. M1 (dep) for a correct method to find the number of degrees per hour (= 20) or the number of hours (\(\frac{1}{20}\)) (3 mins) per degree A1 cao for 4
M1 for any one of \(\frac{15}{\text{`}72\text{'}} \times 360\), \(\frac{10}{\text{`}72\text{'}} \times 360\), \(\frac{20}{\text{`}72\text{'}} \times 360\), \(\frac{27}{\text{`}72\text{'}} \times 360\) oe (‘72’ must clearly come from adding frequencies) A1 for 75 seen from correct working or 50 seen or 100 seen or 135 seen or one sector of angle 50° or 100° or 135° labelled correctly with bird’s name or all sectors correctly drawn A1 for correct pie chart fully labelled with birds' names OR M1 for \(\frac{\text{`}75\text{'}}{15} \times 10\) or \(\frac{\text{`}75\text{'}}{15} \times 20\) or \(\frac{\text{`}75\text{'}}{15} \times 27\) (‘75’ must be in the range 73 - 77) A1 for 50 seen or 100 seen or 135 seen or one sector of angle 50° or 100° or 135° labelled correctly with bird’s name or all sectors correctly drawn A1 for correct pie chart fully labelled with birds' names NB. Allow a tolerance of ±2° on all drawn angles
M1 for any one of \(\frac{15}{72} \times 360\), \(\frac{10}{72} \times 360\), \(\frac{20}{72} \times 360\), \(\frac{27}{72} \times 360\) oe (‘72’ must clearly come from adding frequencies) A1 for 75 seen from correct working or 50 seen or 100 seen or 135 seen or one sector of angle 50° or 100° or 135° labelled correctly with bird’s name or all sectors correctly drawn A1 for correct pie chart fully labelled with birds’ names OR M1 for \(\frac{75}{15} \times 10\) or \(\frac{75}{15} \times 20\) or \(\frac{75}{15} \times 27\) (‘75’ should be in the range 73 - 77) A1 for 50 seen or 100 seen or 135 seen or one sector of angle 50° or 100° or 135° labelled correctly with bird’s name or all sectors correctly drawn A1 for correct pie chart fully labelled with birds’ names NB. Allow a tolerance of ±2° on all drawn angles
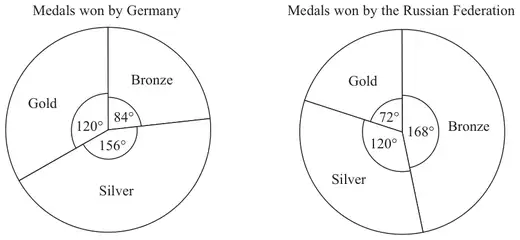
17 The pie charts show some information about the numbers of medals won by Germany and by the Russian Federation in the 2010 Winter Olympics.
Germany won 7 bronze medals.
(a) How many gold medals did Germany win? (2)
(b) Graham says, ‘The pie charts show that Germany won more gold medals than the Russian Federation’. Is Graham right? You must explain your answer. (1)
Mark scheme (a)
Working
Answer
Mark
Notes
\(84 \div 7\) (=12) \(120 \div 12\)
10
2
M1 for \(84 \div 7\) (=12) or \(7 \div 84\) (=0.083..) A1 cao
Mark scheme (b)
Answer
Mark
Notes
Don’t know + reason
1
B1 'Don't know' or 'No' with reason eg. Need to know how many medals Russian Federation won or pie chart shows proportion not number of medals won
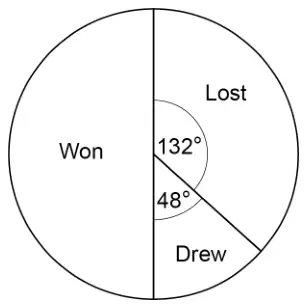
18 The pie chart represents the results of matches played by a team.
30 matches were won.
How many matches were lost? [3 marks]
Mark scheme
Answer
Mark
Comments
Alternative method 1: proportion using angles
\(\dfrac{132}{180}\) or \([0.73, 0.7\dot{3}]\) or \(\dfrac{132}{360}\) or [0.36, 0.37] or \(\dfrac{48}{180}\) or [0.26, 0.27] or \(\dfrac{48}{360}\) or \([0.13, 0.1\dot{3}]\) or 132 : 48 or 11 : 4
M1
oe fraction or percentage ratio: oe either order
or \(\dfrac{132}{180} \times 30\) or \(\dfrac{48}{180} \times 30\) or 8 or 22 : 8 or 8 : 22 (not oe)
M1dep
oe eg \([0.73, 0.7\dot{3}] \times 30\) \(\dfrac{132}{360} \times 30 \times 2\) or \(\dfrac{48}{360} \times 30 \times 2\) is M2
22
A1
SC1 11
Alternative method 2: using the number of degrees per match
\((360 - 132 - 48) \div 30\) or \(180 \div 30\) or \(360 \div (30 \times 2)\) or 6
M1
oe
\(132 \div\) their 6 or \(48 \div\) their 6 or 8
M1dep
oe \(\dfrac{132}{360 \div (30 \times 2)}\) or \(\dfrac{48}{360 \div (30 \times 2)}\) is M2
22
A1
SC1 11
Alternative method 3: using the number of matches per degree
\(\dfrac{30}{180}\) or \(\dfrac{30 \times 2}{360}\) or [0.16, 0.17]
M1
oe fraction or percentage eg \(\dfrac{1}{6}\)
or \(\dfrac{30}{180} \times 132\) or \(\dfrac{30}{180} \times 48\) or 8
M1dep
oe eg \([0.16, 0.17] \times 132\)
22
A1
SC1 11
Additional guidance
SC1 is for using 30 matches in total
\(0.17 \times 132 = 22.44\) with answer 22
M1M1A0
\(30 \div 2 = 15\) and \(15 \div 2 = 7.5\) and \(15 + 7.5 = 22.5\) with answer 22
M1M1A1
\(30 \div 2 = 15\) and \(15 \div 2 = 7.5\) and \(15 + 7.5 = 22.5\)
M0
\(30 \div 2 = 15\) and \(15 \div 2 = 7.5\) and \(7.5 \to 8\)
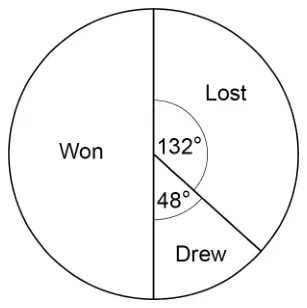
5 The pie chart represents the results of matches played by a team.
30 matches were won.
How many matches were lost? [3 marks]
Mark scheme
Answer
Mark
Comments
Alternative method 1: proportion using angles
\(\dfrac{132}{180}\) or \([0.73, 0.7\dot{3}]\) or \(\dfrac{132}{360}\) or [0.36, 0.37] or \(\dfrac{48}{180}\) or [0.26, 0.27] or \(\dfrac{48}{360}\) or \([0.13, 0.1\dot{3}]\) or 132 : 48 or 11 : 4
M1
oe fraction or percentage ratio: oe either order
or \(\dfrac{132}{180} \times 30\) or \(\dfrac{48}{180} \times 30\) or 8 or 22 : 8 or 8 : 22 (not oe)
M1dep
oe eg \([0.73, 0.7\dot{3}] \times 30\) \(\dfrac{132}{360} \times 30 \times 2\) or \(\dfrac{48}{360} \times 30 \times 2\) is M2
22
A1
SC1 11
Alternative method 2: using the number of degrees per match
\((360 - 132 - 48) \div 30\) or \(180 \div 30\) or \(360 \div (30 \times 2)\) or 6
M1
oe
\(132 \div\) their 6 or \(48 \div\) their 6 or 8
M1dep
oe \(\dfrac{132}{360 \div (30 \times 2)}\) or \(\dfrac{48}{360 \div (30 \times 2)}\) is M2
22
A1
SC1 11
Alternative method 3: using the number of matches per degree
\(\dfrac{30}{180}\) or \(\dfrac{30 \times 2}{360}\) or [0.16, 0.17]
M1
oe fraction or percentage eg \(\dfrac{1}{6}\)
or \(\dfrac{30}{180} \times 132\) or \(\dfrac{30}{180} \times 48\) or 8
M1dep
oe eg \([0.16, 0.17] \times 132\)
22
A1
SC1 11
Additional guidance
SC1 is for using 30 matches in total
\(0.17 \times 132 = 22.44\) with answer 22
M1M1A0
\(30 \div 2 = 15\) and \(15 \div 2 = 7.5\) and \(15 + 7.5 = 22.5\) with answer 22
M1M1A1
\(30 \div 2 = 15\) and \(15 \div 2 = 7.5\) and \(15 + 7.5 = 22.5\)
M0
\(30 \div 2 = 15\) and \(15 \div 2 = 7.5\) and \(7.5 \to 8\)
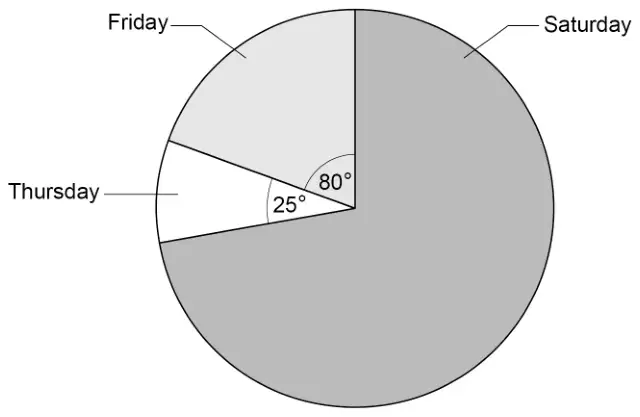
22 The pie chart shows information about people at a fair during three days.
Not drawn accurately
There were 132 more people on Friday than on Thursday.
Work out the number of people on Saturday. [3 marks]
Mark scheme
Answer
Mark
Comments
\(80 - 25\) or 55 or \(360 - 80 - 25\) or 255
M1
oe implied by 1 degree = 2.4 people or 5 degrees = 12 people
\(\dfrac{132}{\text{their } 55} \times 360\) or 864 or \(\dfrac{132}{\text{their } 55} \times 80\) or 192 or \(\dfrac{132}{\text{their } 55} \times 25\) or 60 or \(\dfrac{132}{\text{their } 55} \times \text{their } 255\) or \(\dfrac{132}{\text{their } 55} \times (80 + 25)\) or 252 or their \(255 \div \dfrac{\text{their } 55}{132}\)
M1dep
oe \(2.4 \times\) their 255 is M2 \(12 \times 51\) is M2 \(2.4 \times 105\) is M2
612
A1
Additional guidance
Up to M2 may be awarded for correct work, with no answer or incorrect answer, even if this is seen amongst multiple attempts
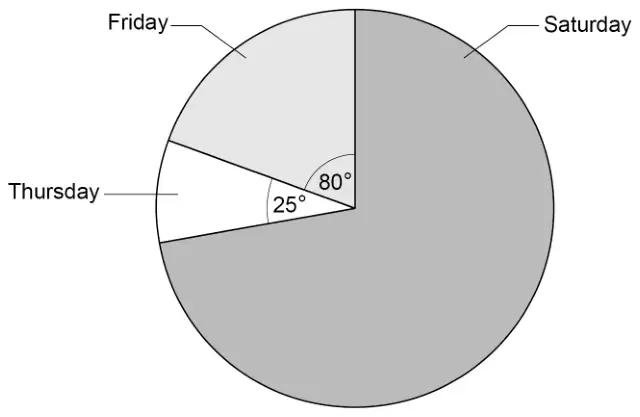
9 The pie chart shows information about people at a fair during three days.
Not drawn accurately
There were 132 more people on Friday than on Thursday.
Work out the number of people on Saturday. [3 marks]
Mark scheme
Answer
Mark
Comments
\(80 - 25\) or 55 or \(360 - 80 - 25\) or 255
M1
oe implied by 1 degree = 2.4 people or 5 degrees = 12 people
\(\dfrac{132}{\text{their } 55}\) \(\times 360\) or 864 or \(\dfrac{132}{\text{their } 55}\) \(\times 80\) or 192 or \(\dfrac{132}{\text{their } 55}\) \(\times 25\) or 60 or \(\dfrac{132}{\text{their } 55}\) \(\times\) their 255 or \(\dfrac{132}{\text{their } 55}\) \(\times (80 + 25)\) or 252 or their \(255 \div \dfrac{\text{their } 55}{132}\)
M1dep
oe \(2.4 \times\) their 255 is M2 \(12 \times 51\) is M2 \(2.4 \times 105\) is M2
612
A1
Additional guidance
Up to M2 may be awarded for correct work, with no answer or incorrect answer, even if this is seen amongst multiple attempts
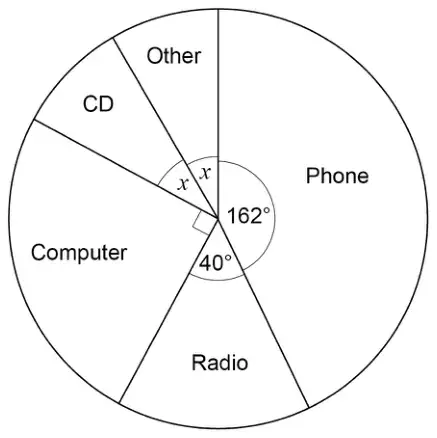
16 Some people were asked for the main way they listen to music.
A pie chart is drawn to represent their answers.
Not drawn accurately
(a) Work out the size of angle \(x\). [2 marks]
(b) 135 people said Computer.
How many people said Phone? [3 marks]
Mark scheme (a)
Answer
Mark
Comments
\(360 - 162 - 40 - 90\) or 68 or \(x + x + 162 + 40 + 90 = 360\)
M1
oe eg \(360 - 292\) or \(2x + 292 = 360\)
34
A1
Additional guidance
\(68 \div 2\)
M1
68 may be embedded for M1 eg \(68 + 162 + 40 + 90 = 360\) eg \(162 + 40 + 90 + 30 + 38 = 360\) (because 30 and 38 total 68) eg \(162 + 40 + 90 + 34 + 34 = 360\) (34 needs to be selected to score A1)
M1 M1 M1
34 seen followed by answer 68
M1A0
Mark scheme (b)
Answer
Mark
Comments
\(\dfrac{135}{90}\) or 1.5 or \(\dfrac{90}{135}\) or 0.66(…) or 0.67 or any correct method that would lead to answer 243 eg \(\dfrac{162}{90} \times 135\) or \(135 \div \dfrac{90}{162}\) or \(\dfrac{162}{360} \times 135 \times 4\) or \(0.45 \times 540\) or \(135 \times 4 \div \dfrac{360}{162}\) or \(162 + 162 \div 2\) or \(135 + 108\)
M2
oe M1 linking a correct angle with number of people eg \(90 \to 135\) or \(\dfrac{1}{4} \to 135\) or \(180 \to 270\) or \(72 \to 108\) or \(135 \times 360 \div 90\) or \(135 \times 4\) or 540 or \(\dfrac{162}{90}\) or 1.8 or \(\dfrac{90}{162}\) or 0.55(…) or 0.56 or \(\dfrac{162}{360}\) or 0.45 or 45% or \(\dfrac{360}{162}\) or 2.22(…)
243
A1
Additional guidance
Up to M2 may be awarded for correct work with no answer, or incorrect answer, even if this is seen amongst multiple attempts
M1 may be seen as eg \(90 = 135\)
If shown on pie chart, just writing 135 in Computer sector is insufficient for M1 unless 90 or \(\dfrac{1}{4}\) also shown
Allow embedded fraction, even in an incorrect calculation for at least M1 eg \(\dfrac{90}{162} \times 135\) eg \(\dfrac{90}{135} \times 162\)
M1 M2
Build-up must be correct or full method must be shown
16 60 people were asked if they would vote in an election.
\(\dfrac{1}{4}\) of the people said No
20 people said Yes
The rest said Maybe
Draw and label a pie chart to show this information. [3 marks]
Mark scheme
Answer
Mark
Comments
90 seen or [88°, 92°] drawn on pie chart
M1
allow missing or incorrect label
\(\dfrac{20}{60} \times 360\) or 120 seen or [118°, 122°] drawn on pie chart
M1
oe eg \(360 \div 3\)
allow missing or incorrect label
Fully correct pie chart with unambiguous labels and all angles ±2°
A1
Additional guidance
All three labels (or a key) needed for the A1 but accept eg No, Yes, Rest or N, Y, M or N, Y, R eg for No do not accept 15 (people) or \(\dfrac{1}{4}\) or 90 as the label
Not using the given radius will score a maximum of M2
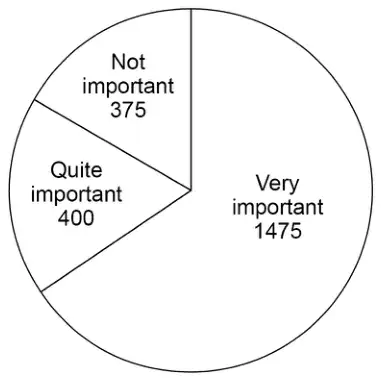
A sample of the crowd was asked about the importance of a family area.
The pie chart represents the answers.
(a) The total number of people in the crowd was 29 250
Estimate how many people in the crowd think that a family area is very important.
Assume that the sample is representative of the crowd. [3 marks]
(b) In fact,
50% of the sample were sitting in the family area
10% of the crowd were sitting in the family area.
What is this likely to mean about the actual number of people in the crowd who think that a family area is very important?
Tick one box. [1 mark]
It is larger than the answer to part (a)
It is the same as the answer to part (a)
It is lower than the answer to part (a)
Mark scheme (a)
Answer
Mark
Comments
Alternative method 1
\(375 + 400 + 1475\) or 2250 or 13 seen or \(\dfrac{59}{90}\) seen or [0.65, 0.66] seen
M1
oe for 375 allow 350 or 370 or 380 or 400 for 1475 allow 1450 or 1470 or 1480 or 1500 eg \(400 + 400 + 1500\) any estimated values must be seen eg only seeing 2300 is M0
\(\dfrac{1475}{375 + 400 + 1475} \times 29\,250\) or \(1475 \times 13\) or [0.65, 0.66] \(\times\) 29 250 or [19012.5, 19305]
M1dep
oe for 375 allow 350 or 370 or 380 or 400 for 1475 allow 1450 or 1470 or 1480 or 1500 for 29 250 allow 29 000 or 29 200 or 29 300 or 29 500 or 30 000
19 175
A1
Alternative method 2
[234, 238]
M1
may be on the diagram
\(\dfrac{\text{their } [234, 238]}{360} \times 29\,250\) or their [234, 238] \(\times\) 81.25
M1dep
oe for 29 250 allow 29 000 or 29 200 or 29 300 or 29 500 or 30 000
19 175
A1
Additional guidance
\(375 + 400 + 1475 = 2250\) If they subsequently estimate 2250 no further marks can be scored
M1
Answer 19 175 is M1M1A1 unless it comes from rounding or truncating
The possible flavours are vanilla (V), strawberry (S), chocolate (C) and mint (M).
The two scoops can be the same flavour or different flavours.
(a) List all the possible options for the two scoops. [2 marks]
(b) In one hour the shop sells 180 scoops of ice cream.
The number of scoops of each flavour is shown in the table.
Flavour
Vanilla
Strawberry
Chocolate
Mint
Number of scoops
45
75
50
10
Complete the pie chart to represent the data. [4 marks]
Mark scheme (a)
Answer
Mark
Comments
Exactly ten options VV VS VC VM SS SC SM CC CM MM or exactly sixteen options VV VS VC VM SV SS SC SM CV CS CC CM MV MS MC MM
B2
may be given as words B1 any six correct options from the sixteen options
Additional guidance
Both correct sixteen options listed and correct ten options listed
B2
Mark scheme (b)
Answer
Mark
Comments
Alternative method 1
\(360 \div 180\) or 2
M1
implied by a correct angle or implied by a correctly drawn angle in pie chart \(\pm 2^\circ\)
Any two of \(45 \times\) their 2 or \(90^\circ\) \(75 \times\) their 2 or \(150^\circ\) \(50 \times\) their 2 or \(100^\circ\) \(10 \times\) their 2 or \(20^\circ\)
M1dep
implied by any two correctly drawn angles in pie chart \(\pm 2^\circ\)
Pie chart with four sectors drawn, two of which are correctly drawn with angles from \(90^\circ\), \(150^\circ\), \(100^\circ\) and \(20^\circ\)
M1dep
\(\pm 2^\circ\) lines must be ruled
Fully correct pie chart and sectors labelled with flavours
A1
\(\pm 2^\circ\) lines must be ruled
Alternative method 2
\(45 \div 180 \times 100\) or 25% or \(75 \div 180 \times 100\) or \(41\dfrac{2}{3}\)% or 42% or \(50 \div 180 \times 100\) or \(27\dfrac{7}{9}\)% or 28% or \(10 \div 180 \times 100\) or \(5\dfrac{5}{9}\)% or 6%
M1
oe
Any two of \(45 \div 180 \times 360\) or \(90^\circ\) \(75 \div 180 \times 360\) or \(150^\circ\) \(50 \div 180 \times 360\) or \(100^\circ\) \(10 \div 180 \times 360\) or \(20^\circ\)
M1dep
implied by any two correctly drawn angles in pie chart \(\pm 2^\circ\)
Pie chart with four sectors drawn, two of which are correctly drawn with angles from \(90^\circ\), \(150^\circ\), \(100^\circ\) and \(20^\circ\)
M1dep
\(\pm 2^\circ\) lines must be ruled
Fully correct pie chart and sectors labelled with flavours
A1
\(\pm 2^\circ\) lines must be ruled
Additional guidance
All four sectors must be correctly labelled with letters or words for the accuracy mark
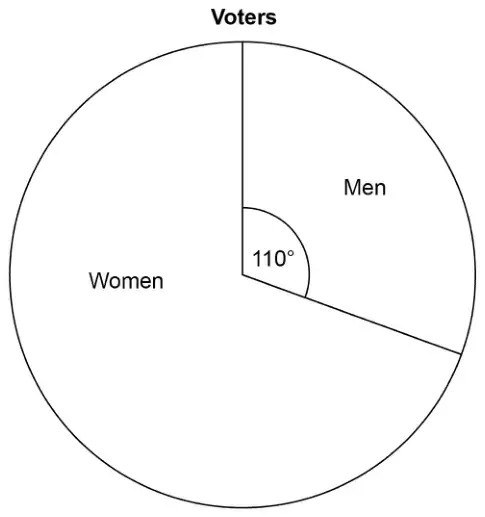
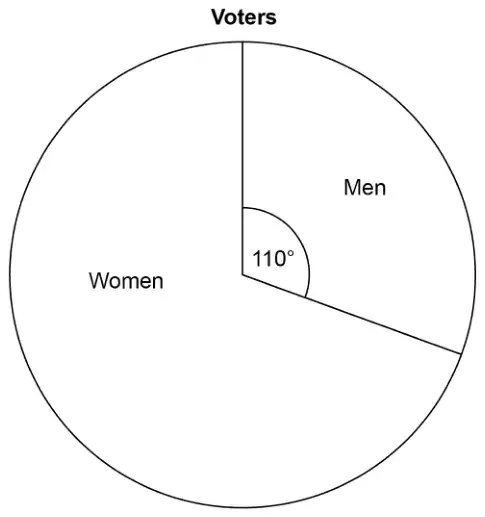
24 The pie chart shows information about voters in an election.
3360 more women voted than men.
Work out the total number of voters. [3 marks]
Mark scheme
Answer
Mark
Comments
Alternative method 1
\(360 - 110\) or 250 or \(360 - 110 - 110\) or 140
M1
May be seen on diagram oe
3360 \(\div\) their 140 or 24 or 2640 (men) or 6000 (women)
M1dep
their 140 must be from \(360 - 110 - 110\) oe
8640
A1
SC2 4838 or 4839
Alternative method 2
\(100 - \dfrac{110}{360} \times 100\) or \(100 - 30.5(\ldots)\) or \(100 - 30.6\) or 69.4(…%) or 69.5(%) or \(100 - \dfrac{110}{360} \times 100 - \dfrac{110}{360} \times 100\) or \(100 - 30.5(\ldots) - 30.5(\ldots)\) or \(100 - 30.6 - 30.6\) or 38.8(…%) or 38.9(%)
M1
May be seen on diagram oe
3360 \(\div\) (their 69.4 \(-\) their 30.5) or 3360 \(\div\) their 38.8(...) or 86.4
M1dep
their 69.4 must be from \(100 - \dfrac{110}{360} \times 100\) their 30.5 must be from \(\dfrac{110}{360} \times 100\)
8640
A1
SC2 4838 or 4839
Alternative method 3
\(\dfrac{250}{360}x - \dfrac{110}{360}x = 3360\) or \(m = \dfrac{110}{360} \times (m + 3360 + m)\) or \(w = \dfrac{250}{360} \times (w + w - 3360)\)
M1
Sets up a correct equation to work out total (\(x\)), men (\(m\)) or women (\(w\)) oe
\(x = 3360 \div \left(\dfrac{250 - 110}{360}\right)\) or \(m = 336\,000 \div 140\) or 2640 or \(w = 840\,000 \div 140\) or 6000
10 The pie chart shows information about voters in an election.
3360 more women voted than men.
Work out the total number of voters. [3 marks]
Mark scheme
Answer
Mark
Comments
Alternative method 1
\(360 - 110\) or 250 or \(360 - 110 - 110\) or 140
M1
May be seen on diagram oe
\(3360 \div\) their 140 or 24 or 2640 (men) or 6000 (women)
M1dep
their 140 must be from \(360 - 110 - 110\) oe
8640
A1
SC2 4838 or 4839
Alternative method 2
\(100 - \dfrac{110}{360} \times 100\) or \(100 - 30.5(\ldots)\) or \(100 - 30.6\) or 69.4(…%) or 69.5(%) or \(100 - \dfrac{110}{360} \times 100 - \dfrac{110}{360} \times 100\) or \(100 - 30.5(\ldots) - 30.5(\ldots)\) or \(100 - 30.6 - 30.6\) or 38.8(…%) or 38.9(%)
M1
May be seen on diagram oe
\(3360 \div\) (their 69.4 \(-\) their 30.5) or \(3360 \div\) their 38.8(…) or 86.4
M1dep
their 69.4 must be from \(100 - \dfrac{110}{360} \times 100\) their 30.5 must be from \(\dfrac{110}{360} \times 100\)
8640
A1
SC2 4838 or 4839
Alternative method 3
\(\dfrac{250}{360}x - \dfrac{110}{360}x = 3360\) or \(m = \dfrac{110}{360} \times (m + 3360 + m)\) or \(w = \dfrac{250}{360} \times (w + w - 3360)\)
M1
Sets up a correct equation to work out total \((x)\), men \((m)\) or women \((w)\) oe
\(x = 3360 \div \left(\dfrac{250 - 110}{360}\right)\) or \(m = 336\,000 \div 140\) or 2640 or \(w = 840\,000 \div 140\) or 6000
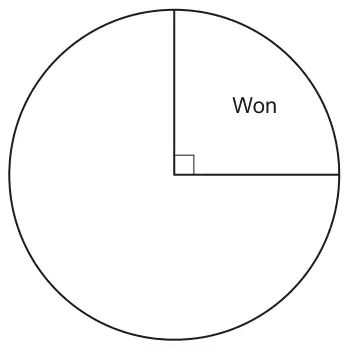
5 The pie chart shows the proportion of games won by a sports team.
(a) The sports team won 9 games.
Work out how many games the sports team played. [2]
(b) The ratio of the number of games drawn by the sports team to the number of games lost by the sports team was 2 : 1.
Complete the pie chart above. [2]
Mark scheme (a)
Answer
Marks
Part marks and guidance
36
2
M1 for \(9 \times 4\) or \(9 + 9 + 9 + 9\) or \(360 \div \left(\dfrac{90}{9}\right)\)
Mark scheme (b)
Answer
Marks
Part marks and guidance
Correct, labelled, 3 sector pie chart
2
M1 for 180 and 90 or for \(\dfrac{1}{2}\) and \(\dfrac{1}{4}\) or 18 and 9 maybe implied by correct 3 sector pie chart with wrong or missing labels or 4 quadrant pie chart with 2 quadrants labelled draw and 1 quadrant labelled lost
Tolerance \(\pm 2^\circ\) by eye, accept good freehand
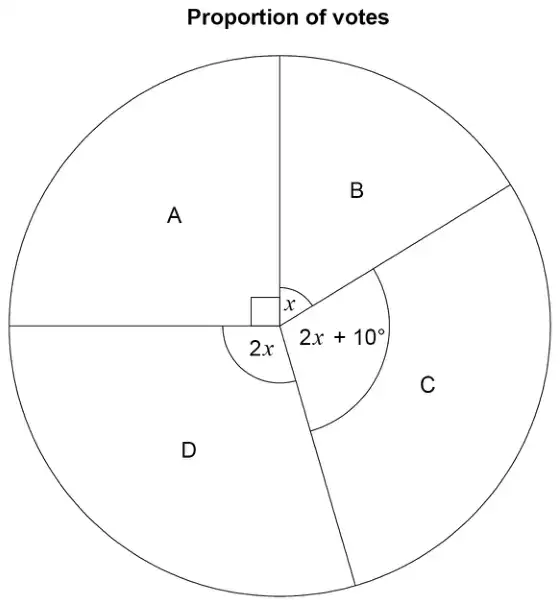
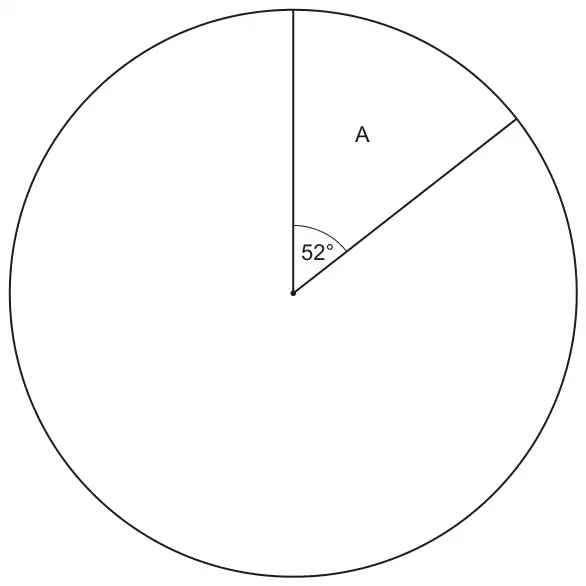
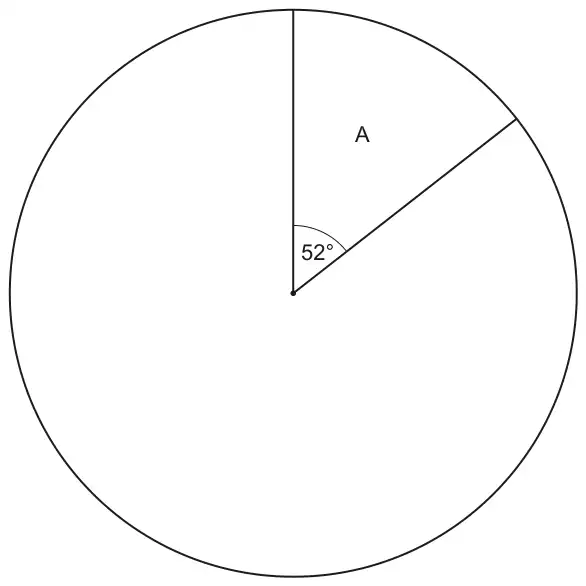
21 A school is deciding on a charity to support. Each student at the school votes for one of four charities, A, B, C or D. The results are to be shown in a pie chart.
This pie chart shows the sector for charity A. Twice as many students voted for charity C than charity B. Twice as many students voted for charity D than charity C.
(a)
(i) Show that the sector for charity B will have an angle of \(44^\circ\). [2]
(ii) Complete the pie chart. [3]
(b) 39 students voted for charity A.
Calculate the total number of students at the school. [2]
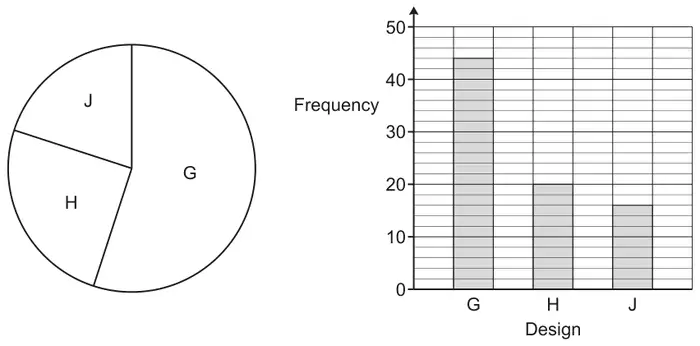
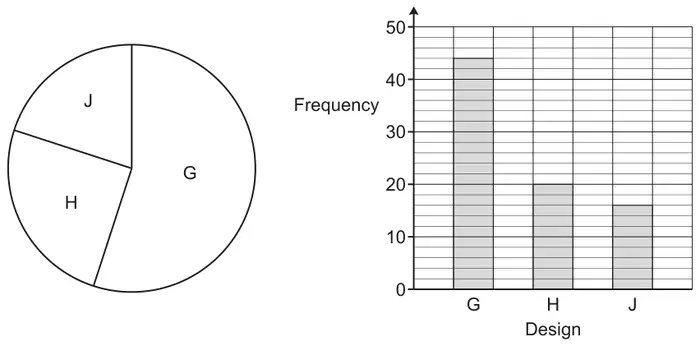
(c) The school asks 80 of the students to choose a new logo from three designs G, H and J. The same results are shown in a pie chart and in a bar chart.
(i) Give one advantage of using the pie chart rather than the bar chart. [1]
(ii) Give one disadvantage of using the pie chart rather than the bar chart. [1]
M1 for \(360 - 52\) or 308 or their\((360 - 52) \div (1 + 2 + 4)\)
Alternative method 1 : M2 for \(7x = 360 - 52\) or \(7x = 308\) then \(x = 44\) or M1 for \(x\), \(2x\) and \(4x\) or \(360 - 52\) or 308
Alternative method 2 : M2 for \(52 + 44 + 2 \times 44 + 4 \times 44 = 360\) oe or M1 for \(52 + 44 + 2 \times 44 + 4 \times 44\) oe
better includes \(308 \div 7\)
Mark the work in the answer space and if blank, mark any work round the diagram
Allow any letter
For M2 and M1 accept 88 for 2 x 44 and 176 for 88 x 2
(ii) Correct labelled pie chart with ruled lines and sector angles 44, 88 and 176
3
B2 for two additional correct sectors within tolerance or a correct unlabelled/incorrectly labelled pie chart with ruled lines or correct labelled pie chart with unruled lines or B1 for one correct sector within tolerance, ignore label
Use online protractor and apply an angle tolerance of \(\pm\) 2\(^\circ\). For 3 marks we need only four sectors and condone one sector unlabelled. Labels must be letters not angles
Mark scheme (b)
Answer
Marks
Part marks and guidance
270
2
M1 for any correct method e.g. \(\dfrac{39}{52} \times 360\) oe or \(39 + \dfrac{176}{\frac{52}{39}} + \dfrac{88}{\frac{52}{39}} + \dfrac{44}{\frac{52}{39}}\)
e.g. \(\dfrac{360}{\frac{52}{39}}\) or \(\dfrac{39}{52 \div 360}\) condone \(\dfrac{52}{39} = 1.3\)
Mark scheme (c)
Answer
Marks
Part marks and guidance
(i) Accept any correct advantage e.g. Information is immediately displayed as part of a whole
1
See appendix and mark best response as long as it is not contradictory or has an incorrect statement
(ii) Accept any correct disadvantage e.g. you cannot read the exact frequencies from it
1
See appendix and mark best response as long as it is not contradictory or has an incorrect statement
Appendix
Exemplar responses for Q21(c)(i)
Response
Mark
Information is immediately displayed as part of a whole
1
You can see the proportions easily
1
It shows proportions
1
Visual representation of proportions
1
Pie chart visually shows more than half the students voted G
1
It shows as a percentage of a whole
1(BOD)
Easier to tell the percentage of people who chose a design
1(BOD)
Easier to see percentage
1(BOD)
Easier to compare/ see results/ can see which one is most popular (or least popular)
0
Shows difference based on size of each part
0
Can easily compare size of sectors
0
Clear to see
0
Easier to read / understand
0
You can see the amounts compared to other amounts / can see biggest and smallest with a glance
0
It gives a better view on results
0
You can work out the percentage better
0
They give you a percentage whilst a bar chart doesn’t
0
It’s more accurate
0
Identify results quicker
0
Shows largest one without giving numbers
0
Exemplar responses for Q21(c)(ii)
Response
Mark
you cannot read the [exact] frequencies from it
1
It does not show frequencies/ the amount of people/ the number of students who chose which one
1
More difficult to work out how many students chose each logo
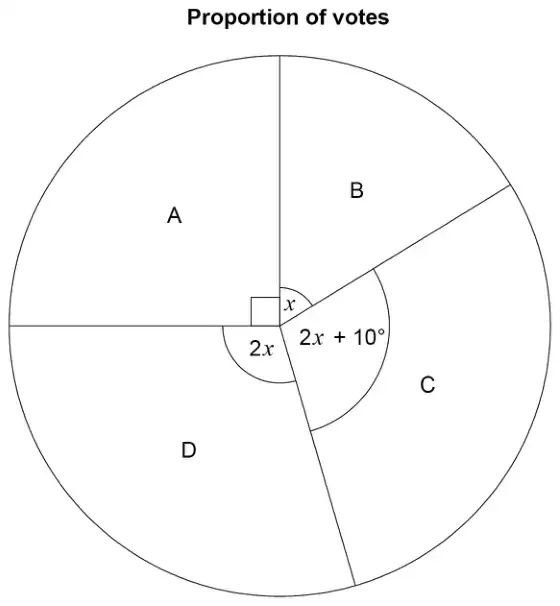
4 A school is deciding on a charity to support. Each student at the school votes for one of four charities, A, B, C or D. The results are to be shown in a pie chart.
This pie chart shows the sector for charity A. Twice as many students voted for charity C than charity B. Twice as many students voted for charity D than charity C.
(a)
(i) Show that the sector for charity B will have an angle of 44°. [2]
(ii) Complete the pie chart. [3]
(b) 39 students voted for charity A.
Calculate the total number of students at the school. [2]
(c) The school asks 80 of the students to choose a new logo from three designs G, H and J. The same results are shown in a pie chart and in a bar chart.
(i) Give one advantage of using the pie chart rather than the bar chart. [1]
(ii) Give one disadvantage of using the pie chart rather than the bar chart. [1]
M1 for 360 – 52 or 308 or their(360 – 52) \(\div\) (1 + 2 + 4)
Alternative method 1 : M2 for \(7x = 360 - 52\) or \(7x = 308\) then \(x = 44\) or M1 for \(x\), \(2x\) and \(4x\) or 360 – 52 or 308
Alternative method 2 : M2 for 52 + 44 + 2 × 44 + 4 × 44 = 360 oe or M1 for 52 + 44 + 2 × 44 + 4 × 44 oe
better includes \(308 \div 7\)
Mark the work in the answer space and if blank, mark any work round the diagram
allow any letter
For M2 and M1 accept 88 for 2 × 44 and 176 for 88 × 2
(ii) Correct labelled pie chart with ruled lines and sector angles 44, 88 and 176
3
B2 for two additional correct sectors within tolerance or a correct unlabelled/incorrectly labelled pie chart with ruled lines or correct labelled pie chart with unruled lines or B1 for one correct sector within tolerance, ignore label
Use online protractor and apply an angle tolerance of ± 2°. For 3 marks we need only four sectors and condone one sector unlabelled. Labels must be letters not angles
Mark scheme (b)
Answer
Marks
Part marks and guidance
270
2
M1 for any correct method e.g. \(\frac{39}{52} \times 360\) oe or \(39 + \dfrac{176}{\frac{52}{39}} + \dfrac{88}{\frac{52}{39}} + \dfrac{44}{\frac{52}{39}}\)
e.g. \(\dfrac{360}{\frac{52}{39}}\) or \(\dfrac{39}{52 \div 360}\) condone \(\frac{52}{39} = 1.3\)
Mark scheme (c)
Answer
Marks
Part marks and guidance
(i) Accept any correct advantage e.g. Information is immediately displayed as part of a whole
1
See appendix and mark best response as long as it is not contradictory or has an incorrect statement
(ii) Accept any correct disadvantage e.g. you cannot read the exact frequencies from it
1
See appendix and mark best response as long as it is not contradictory or has an incorrect statement
Appendix: exemplar responses for Q4(c)(i)
Response
Mark
Information is immediately displayed as part of a whole
1
You can see the proportions easily
1
It shows proportions
1
Visual representation of proportions
1
Pie chart visually shows more than half the students voted G
1
It shows as a percentage of a whole
1(BOD)
Easier to tell the percentage of people who chose a design
1(BOD)
Easier to see percentage
1(BOD)
Easier to compare/ see results/ can see which one is most popular (or least popular)
0
Shows difference based on size of each part
0
Can easily compare size of sectors
0
Clear to see
0
Easier to read / understand
0
You can see the amounts compared to other amounts / can see biggest and smallest with a glance
0
It gives a better view on results
0
You can work out the percentage better
0
They give you a percentage whilst a bar chart doesn’t
0
It’s more accurate
0
Identify results quicker
0
Shows largest one without giving numbers
0
Appendix: exemplar responses for Q4(c)(ii)
Response
Mark
you cannot read the [exact] frequencies from it
1
It does not show frequencies/ the amount of people/ the number of students who chose which one
1
More difficult to work out how many students chose each logo
(a) The table shows the results for a sports club’s ‘A’ team.
Result
Frequency
Win
18
Draw
10
Lose
12
Total
40
Complete a labelled pie chart to show these results.
[4]
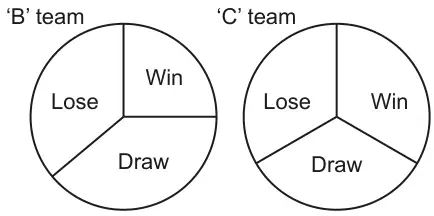
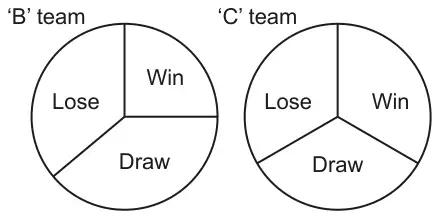
(b) Here are the results for the sports club’s ‘B’ team and ‘C’ team.
The ‘C’ team manager says
The pie charts show that the ‘C’ team won more games than the ‘B’ team.
Referring to the pie charts, explain why the ‘C’ team manager may not be correct. [1]
Mark scheme (a)
Answer
Marks
Part marks and guidance
a correct labelled pie chart with ruled lines
4
B3 for a correct unlabelled/incorrectly labelled pie chart with ruled lines OR B2 for 162, 90 and 108 or for two sectors within tolerance of \(\pm 2^\circ\) ignore label or M1 for \(\frac{360}{40}\) or 9 OR B1 for one sector within tolerance ignore label
Correct means three sectors must be within tolerance of \(\pm 2^\circ\) for B3 and 4 marks
Do not accept frequency alone as labels
May be seen in working, alongside table or on pie chart
Note : maximum of 3 sectors for B3, B2 and B1
Mark scheme (b)
Answer
Marks
Part marks and guidance
The pie charts do not show how many matches were played by each team
1
Accept any correct reason see appendix if more than one statement mark the best as long as it is not contradicted or has an incorrect statement
Appendix
Exemplar responses for Q18b
Response
Mark
They may have played less/more matches in total
1
We don’t know how many games were played
1
The pie charts do not show how many matches were played by each team
1
B team could have played more games (or less)
1
C team may have played more games (or less)
1
They could have played a different number of games
1
They(C) may have played less matches in total
1
Pie charts do not show the actual figures (raw data)
1
Pie charts only show proportion
1
Bigger fraction might not reflect a bigger quantity
1
The numbers in B team may be higher than the numbers in C team ( charts are labelled B team and C team)
1
No numbers so it could be correct or not we wouldn’t know.
1
They do not know how many games B played
0
They do not know how many games C played
0
The total frequency is not given
0
The frequency may not be the same for both ( frequency of what?)
0
It depends on how many times C wins
0
The information (or data) is not shown
0
We do not know the exact values
0
You can’t guarantee everything will be equal
0
It might not be accurate
0
He can’t tell accurately how many games were won
0
It depends on how many matches B plays (doesn’t refer to both teams)
0
It depends on how many matches C plays (doesn’t refer to both teams)
(a) The table shows the results for a sports club’s ‘A’ team.
Result
Frequency
Win
18
Draw
10
Lose
12
Total
40
Complete a labelled pie chart to show these results.
[4]
(b) Here are the results for the sports club’s ‘B’ team and ‘C’ team.
The ‘C’ team manager says
The pie charts show that the ‘C’ team won more games than the ‘B’ team.
Referring to the pie charts, explain why the ‘C’ team manager may not be correct. [1]
Mark scheme (a)
Answer
Marks
Part marks and guidance
a correct labelled pie chart with ruled lines
4
B3 for a correct unlabelled/incorrectly labelled pie chart with ruled lines OR B2 for 162, 90 and 108 or for two sectors within tolerance of ±2° ignore label or M1 for \(\frac{360}{40}\) or 9 OR B1 for one sector within tolerance ignore label
Correct means three sectors within tolerance of ±2° for B3 and 4 marks Do not accept frequency alone as labels May be seen in working, alongside table or on pie chart Note: maximum of 3 sectors for B3, B2 and B1
Mark scheme (b)
Answer
Marks
Part marks and guidance
The pie charts do not show how many matches were played by each team
1
Accept any correct reason see appendix If more than one statement mark the best as long as it is not contradicted or has an incorrect statement
Appendix: exemplar responses for Q3(b)
Response
Mark
They may have played less/more matches in total
1
We don’t know how many games were played
1
The pie charts do not show how many matches were played by each team
1
B team could have played more games (or less)
1
C team may have played more games (or less)
1
They could have played a different number of games
1
They(C) may have played less matches in total
1
Pie charts do not show the actual figures (raw data)
1
Pie charts only show proportion
1
Bigger fraction might not reflect a bigger quantity
1
The numbers in B team may be higher than the numbers in C team ( charts are labelled B team and C team)
1
No numbers so it could be correct or not we wouldn’t know.
1
They do not know how many games B played
0
They do not know how many games C played …..
0
The total frequency is not given
0
The frequency may not be the same for both (frequency of what?)
0
It depends on how many times C wins
0
The information (or data) is not shown
0
We do not know the exact values
0
You can’t guarantee everything will be equal
0
It might not be accurate
0
He can’t tell accurately how many games were won
0
It depends on how many matches B plays (doesn’t refer to both teams)
0
It depends on how many matches C plays (doesn’t refer to both teams)
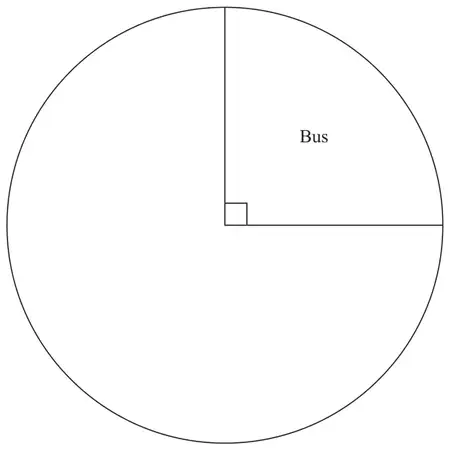
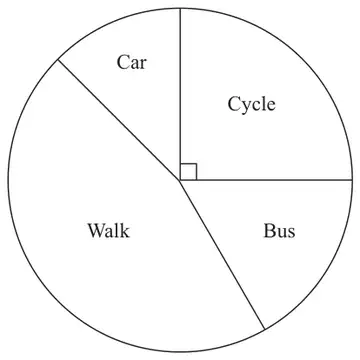
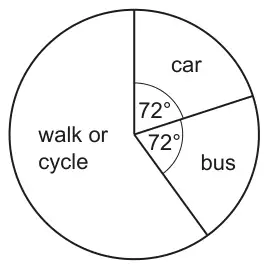
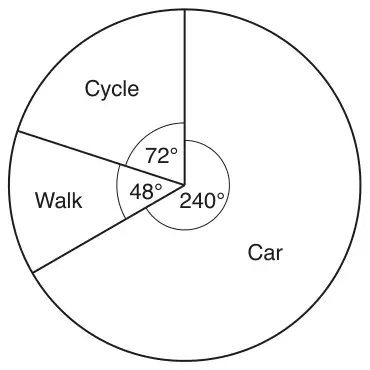
This pie chart shows the way that all 540 students travel to the school.
Each student either walked or cycled or travelled by bus or travelled by car.
(a) Work out how many of the 540 students travel to the school by car. [3]
(b) The number of students who walk is three times the number who cycle.
Work out the sector angle for the students who walk to school. You do not need to draw this on the pie chart. [3]
Mark scheme (a)
Answer
Marks
Part marks and guidance
108
3
M2 for \(\dfrac{72}{360} \times 540\) oe or M1 for \(\dfrac{72}{360}\) oe or \(\dfrac{540}{360}\) oe
May be e.g. \(72 \div \dfrac{360}{540}\) or \(72 \div 0.66\) to 0.67 or \(540 \div 5\)
Implied by e.g. \(\dfrac{1}{5}\) or 5 or 0.2 or 20% or e.g. 1.5 or 0.66 to 0.67 accept Inverse \(\dfrac{360}{72}\) or \(\dfrac{360}{540}\) accept \(360 \times x = 72 \times 540\) for M1 where \(x\) is any variable or 216 [students] NOT from 360 – 72 – 72
Mark scheme (b)
Answer
Marks
Part marks and guidance
162
3
M2 for \(\dfrac{3}{4} \times (360 - 2 \times 72)\) oe
OR
M1 for \(\dfrac{3}{4} \times [\ \ \ ]\) oe or B1 for 216
or \(\dfrac{3}{4} \times (540 - 2 \times\) their \(108) \times \dfrac{360}{540}\) oe e.g. 540 – 216 (= 324) \(\rightarrow 324 \div 4\) (= 81) \(\rightarrow 324 - 81\) (= 243) \(\rightarrow 243 \times \dfrac{360}{540}\) or \(243 \div \dfrac{540}{360}\) or \(243 \div 1.5\) NB \(\dfrac{360}{540} = \dfrac{2}{3}\) and the inverse is often 1.5 [ ] \(\lt 540\)
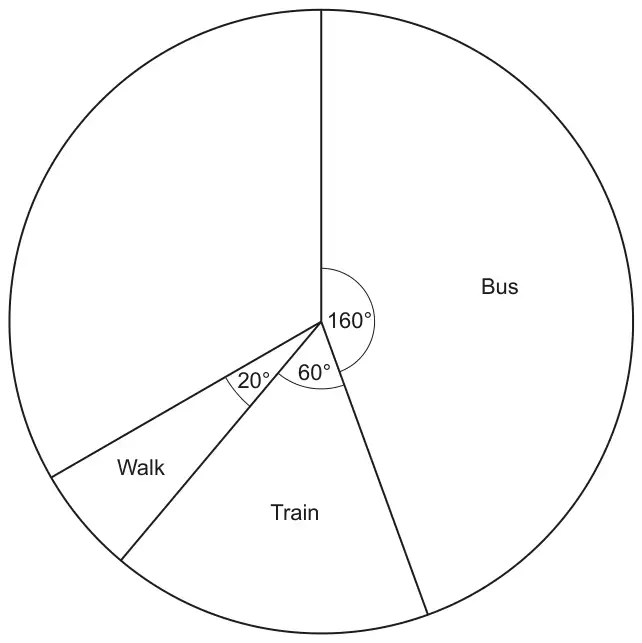
11 Some students were asked how they travel to school. Each student gave one answer. The pie chart shows the proportion who travel by bus, by train or walk.
(a) All of the remaining students travel to school either by bike or by car. The ratio of the number who travel by bike to the number who travel by car is 2 : 3.
Complete the pie chart. You must show your working. [6]
(b) Which way of travelling to school is the mode? [1]
Mark scheme (a)
Answer
Marks
Part marks and guidance
Correct, labelled pie chart with correct working
6
“correct working” requires at least M1M1 and ruled line If there are labelled angles, mark the method that leads to the angles If angles are not shown mark worst method
M2 for \(360 - (160 + 60 + 20)\) oe or M1 for \(160 + 60 + 20\)
AND
May be implied by 120 May be implied by 240
M1 for \(\dfrac{2}{5} \times\) their 120 oe A1 for 48 or M1 for \(\dfrac{3}{5} \times\) their 120 oe A1 for 72
AND
Mark to the candidate’s advantage Their \(120 \lt 360\) 48 implies M1A1
72 implies M1A1
B1 for ruled line at \(48^\circ\)
B1 for their smaller sector labelled “bike” and larger sector labelled “car”
Tolerance \(\pm 2^\circ\) only if correct working seen.
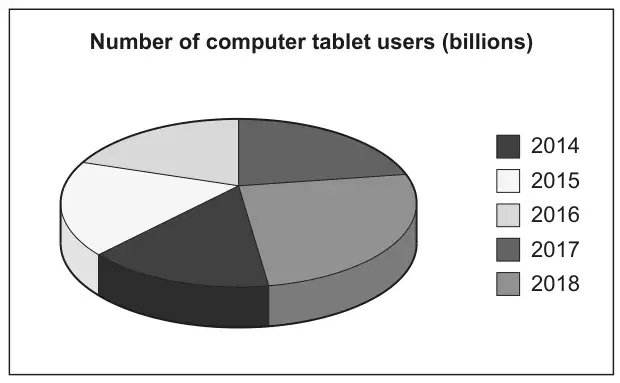
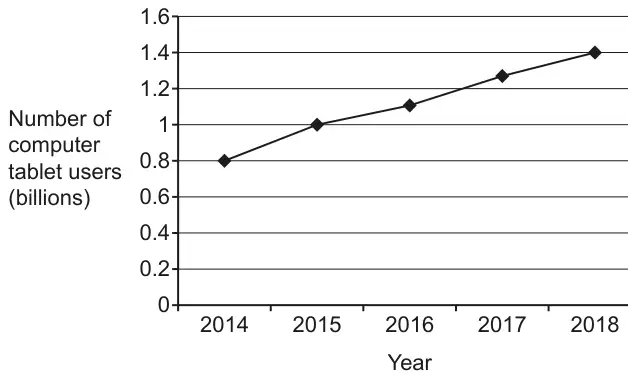
1 Two pupils are given data that shows the estimated number of computer tablet users worldwide from 2014 to 2018.
(a) Li creates this pie chart to show the data.
Write down two reasons why Li’s pie chart is not suitable to represent the data. [2]
(b) Amaya creates this line graph to show the same data.
Work out the percentage increase in the number of computer tablet users from 2014 to 2018. [4]
Mark scheme (a)
Answer
Marks
Part marks and guidance
Two correct different observations from these three categories No values shown e.g. Pie chart only shows proportions not totals
3D aspect e.g. 3D distorts perspective oe
Colours/key unclear e.g. The colour/key are too similar oe
2
B1 for one correct observation
e.g. We have no total/numbers/figures/frequency
e.g. It’s tilted, slanted, seen from an angle etc
Where more than two reasons are given, mark the best unless contradicted e.g. ignore all references to missing angles Do not allow 2 marks for two reasons that refer to the same category Two reasons may appear in the same statement e.g. Its slanted and it does not show the total number [gets 2 marks] See Appendix
Appendix: additional guidance for Q1(a)
Mark
Comments about no numbers
1
There are no numbers/figures/scale [to indicate total or numbers in sector]
1
2
You don’t know what its out of. You need to total [frequency]
1
3
Its difficult to tell the size of each fraction of the pie chart and we need the total(we need the total gets the mark)
1
4
We need to know the angle sizes and what its out of(and what its out of gets the mark provided they don’t say its out of 360)
1
5
Pie charts show proportions/fractions/%’s but do not show quantities
1
Comments about 3D aspect
6
She is viewing the chart from the side not the front
1
7
Its 3D
1
8
It is hard to see the fractions/proportions
1
9
The sections at the front look larger than those at the back
1
10
Its slanted so its hard to measure the angles (Its slanted gets the mark)
1
11
Not able to measure angles owing to the positioning of the pie chart(gets it for the underlined part)
1
Comments about key/colours
12
Segments are not clearly labelled (ref to colour reason)
1
13
The colours look the same. Some of the years are the same colour.
1
14
The parts need to be clearly labelled BOD related to colour
1
15
The colours are confusing
16
It does not tell us the size of each sector (size does not imply number – could be angles)
0
17
Pie charts are for discrete data only
0
18
It might not be accurate
0
19
We need to know the angle sizes
0
20
There are better ways to present the data
0
21
It doesn’t have any labels (Not true – there are labels but not very clear)
0
22
It is an estimated number of users
0
23
The data is not in percentages.
0
24
The sectors have no angles/percentages/fractions
0
25
The sections are similar in size making it unclear
0
26
Not exact figures/data lost
0
Mark scheme (b)
Answer
Marks
Part marks and guidance
75
4
B1 for 0.8 and 1.4 or 3 [rows] and 4 [rows] oe
Accept work in billions for B and M marks i.e 800 000 000 and 1 400 000 000
AND M2 for \(\dfrac{\textit{their } 1.4 - \textit{their } 0.8}{\textit{their } 0.8}\) or \(\dfrac{\textit{their } 1.4 - \textit{their } 0.8}{\textit{their } 0.8} \times 100\)
or for \(\dfrac{\textit{their } 1.4}{\textit{their } 0.8} \times 100\) [ –100] oe
M2 soi by 0.75 or 175
or M1 for \(\dfrac{\textit{their } 1.4}{\textit{their } 0.8}\)
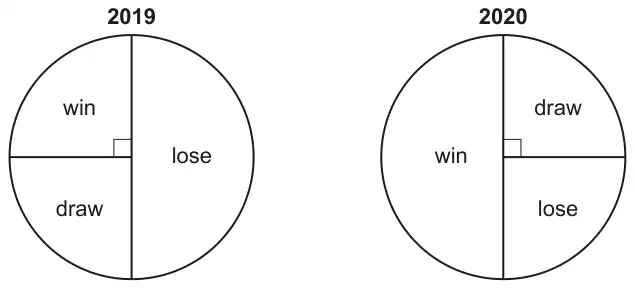
4 A sports team played the same number of matches in 2019 and 2020. The two pie charts summarise their results.
(a) What fraction of the matches did the team win in 2019? [1]
(b) Did the team’s results improve in 2020? Explain how you know. [1]
Mark scheme (a)
Answer
Marks
Part marks and guidance
\(\dfrac{90}{360}\) oe fraction
1
Expect \(\dfrac{1}{4}\) but ignore attempts to cancel initially correct fraction but not convert to decimal or percentage Answer 0.25 after \(\dfrac{1}{4}\) seen scores 0
Mark scheme (b)
Answer
Marks
Part marks and guidance
Yes oe and [in 2020] they won more matches (or double the number of matches) than [in 2019] oe or The win fraction went up to ½ oe [from ¼ oe] The win fraction got bigger
1
See appendix Must be clear reference to win not “it” Do not allow comparing with unlike (e.g. W and L) only unless clearly indicating that W replaced L as majority” oe ½ or ¼ may be degrees Allow error in 2020 win fraction Must be an implied comparison
Appendix
Exemplar responses for Q4b
Response
Mark
Yes They lost fewer matches [in 2020]
1
Yes The sector for win is bigger [in 2020]
Implied comparison by “biggER”
1
Yes Win is a half and it was a quarter oe
Comparison of like with like
1
Yes the fraction/number/ of wins doubled
1
Yes in 2020 they won more than 2019 and lost less
Ignore the last three words
1
Yes the win rate increased by another ¼
BOD if “another” missing. Indicates improvement
1
They improved because they won \(\frac{2}{3}\) when they won \(\frac{1}{3}\) before
BOD means double following \(\frac{1}{3}\) seen in (a)
1
Yes they have won much more than last at least 170°
Condone the “at least 170°”
1
Yes In 2019 they lost the most and in 2020 they won the most
Unlike but indicates majority has changed
1
Yes They got an extra half of wins than in 2019
BOD “extra half”. Implies improvement
1
Yes The win section is larger than draw which is ¼, which is what they won before
Implies “Win larger than ¼ and “before” implies 2019
1
Yes In 2020 the team won 50% of their matches which is ¼ more than 2019
BOD the ¼ more. Implies improvement
1
Yes The pie chart in 2020 shows the team won ½
No comparison stated
0
Yes it went from ¼ to ½
Do not condone “it” for “win”
0
Yes It’s \(\frac{1}{4}\) [in 2019] and now [in 2020] it’s \(\frac{1}{2}\)
Unclear what “its” refers to. Must be clearly WIN
0
Yes They won half instead of lost half
No marks as don’t compare like with like (They could still have won half in 2019)
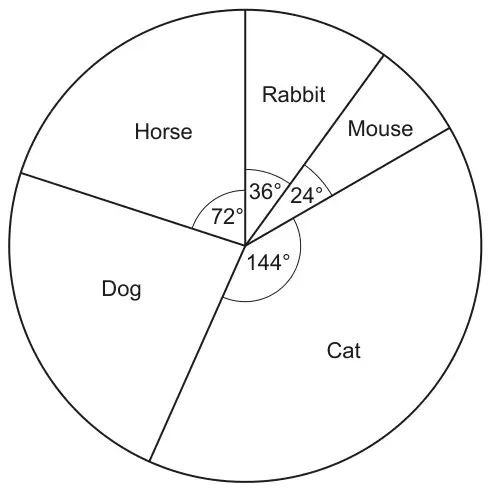
The pie chart shows the proportion of each type of pet owned by the 30 students.
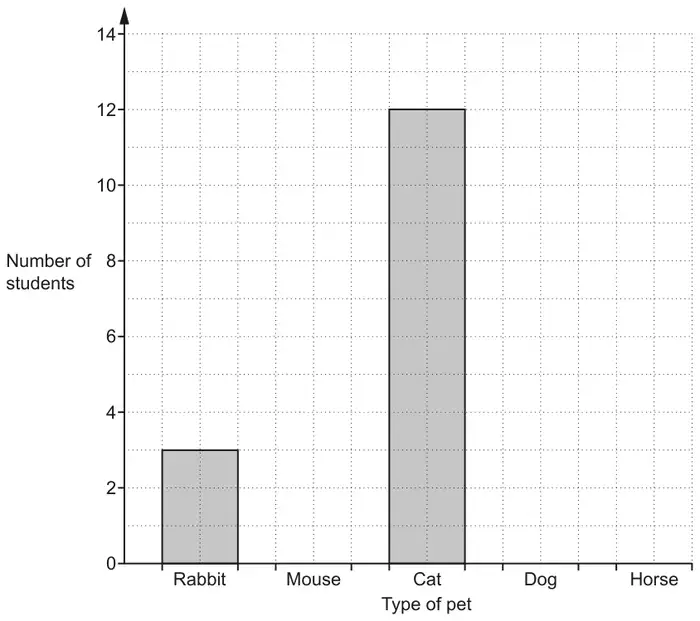
(a) Which type of pet is the mode? [1]
(b) Use the information in the pie chart to complete this bar chart.
[3]
Mark scheme (a)
Answer
Marks
Part marks and guidance
Cat
1
Mark scheme (b)
Answer
Marks
Part marks and guidance
Correct graph
3
B2 for two correct bars or three correct height bars but not all correct width or B1 for one correct height bar of any width or one of [mouse] 2 or [dog] 7 or [horse] 6 seen
If 0 scored, allow B1 for [dog] 84.
Three correct heights and correct widths with no daylight Condone freehand with lines on gridlines (no daylight). Use overlay
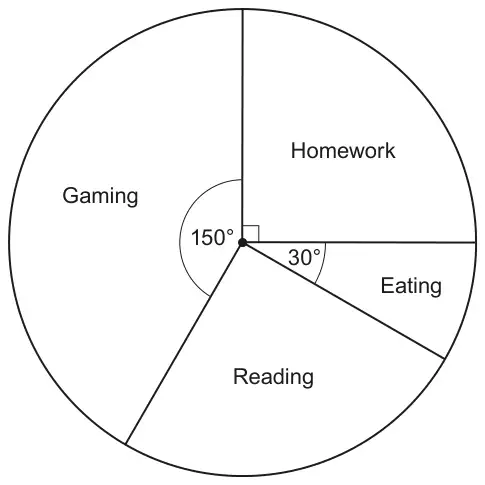
10 The pie chart shows how Jack spent his time one evening.
(a) On which activity did Jack spend most time? [1]
(b) Jack says
I spent \(\dfrac{1}{3}\) of my time on Gaming.
Show that he is not correct. [2]
(c) The pie chart represents 5 hours.
Find the time, in hours and minutes, that Jack spent reading. [4]
Mark scheme (a)
Answer
Marks
Part marks and guidance
Gaming
1
Mark scheme (b)
Answer
Marks
Part marks and guidance
A correct calculation or \(\dfrac{150}{360}\) oe or \(\dfrac{360}{150}\) oe
M1
\(150 \div 360\) or \(360 \div 150\) or \(360 \div 3\) or \(\dfrac{1}{3}\) of 360 or \(150 \times 3\)
For M1 oe is equivalent fraction eg \(\dfrac{5}{12}\)
Justify rejecting Jack’s assertion
A1
Must be comparison between
two fractions with common denominator or values or
two angles or
two values
Match answer to calculation or statement \(\dfrac{150}{360}\) oe and \(\dfrac{1}{3}\) oe with common denominator or 0.4[...] and 0.3[...] or 2.4 and 3 or their 450 and 360
See appendix
Appendix
Question 10b
Response
Mark
A
\(\dfrac{1}{3} \times 360 = 120\) and he has done 150 which is more than that
2 Correct calculation for M1 and A1 recognises 150 is not 120
B
Jack’s incorrect as \(\dfrac{1}{3}\) of 360 is 120 and he has done 150
2 Correct statement of a third of 360 for M1 and A1 recognises 150 is not 120
C
\(360 \div 150 = 2.4\)
1 Correct calculation (\(360 \div 150\)) for M1 but A0 as no comparison of 2.4 with 3
D
\(\dfrac{1}{3} \times 360 = 120\). The angle is supposed to be 120 if he spent a third.
1 Correct calculation (\(\dfrac{1}{3} \times 360\)) for M1 but A0 as no mention of 150
E
\(\dfrac{150}{360} = \dfrac{5}{12}\) which is more than \(\dfrac{1}{3}\)
1 Correct fraction (\(\dfrac{150}{360}\)) for M1 but A0 as no common form to compare fractions
F
She is incorrect as \(3 \times 150 = 450\).
1 Correct calculation for M1A0 as no comparison with 360
G
As 150 angle is not equivalent to a third
0 True but no \(150 \times 3\) or \(360 \div 3\) to support so M0
H
The gaming angle is 150 that’s nearly half of his time
0 No calculation so M0
Mark scheme (c)
Answer
Marks
Part marks and guidance
1 [h] 15[min]
4
B3 for 1.25 [hours] or \(1\dfrac{1}{4}\) [hours] or 75 [minutes] OR B1 for [Reading =] 90
M2 for (5 or 300) \(\times \dfrac{\text{their } 90}{360}\) oe or (5 or 300) \(\div \dfrac{360}{\text{their } 90}\) or B1 for \(\dfrac{\text{their } 90}{360}\) soi \(\dfrac{1}{4}\) or \(\dfrac{360}{\text{their } 90}\) soi 4
Working may be in hours or minutes
May be seen on diagram. Allow symbol
oe M2 for (5 or 300) \(\div\) 4
Notes
Alternative methods
M1 for [150 + 30 =] 180 M1 for (5 or 300) \(\div\) 2 M1 for their (5 or 300) \(\div\) 2 \(\div\) 2
B1 for [reading =] 90 M1 for \(360 \div 5\) soi 72 M1 for \(90 \div\) their \((360 \div 5)\)
B1 for [reading =] 90 M1 for \(300 \div 360\) or \(360 \div 300\) M1 for their \((300 \div 360) \times 90\) or \(90 \div\) their \((360 \div 300)\)
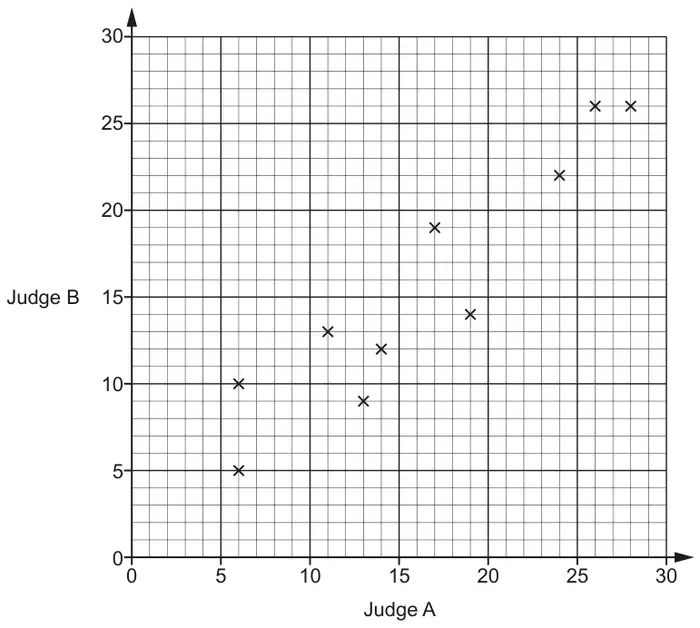
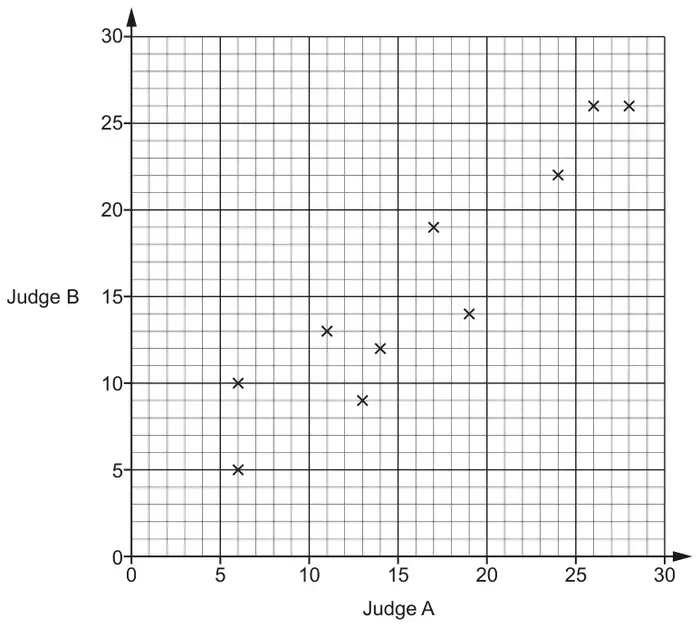
16 In a dance competition, two judges each award scores out of 30. The scatter diagram shows the scores awarded to the first 10 dancers.
(a) Here are the scores for the next two dancers.
Judge A
21
7
Judge B
18
8
Plot their scores on the scatter diagram. [1]
(b) Dancers who are awarded a score of more than 20 by both judges receive a medal.
For the 12 dancers, express the ratio of medal winners to non-medal winners in its simplest form. [3]
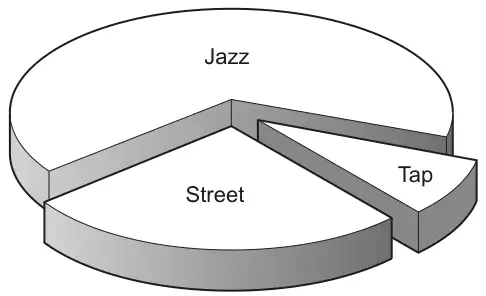
(c) This chart shows the types of dance performed by the 12 dancers.
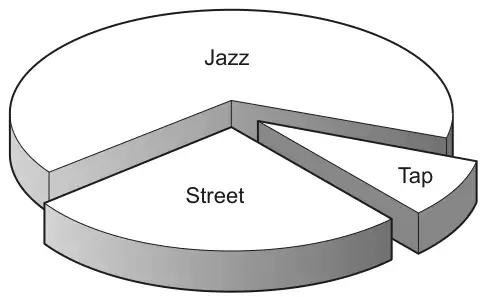
3 performed a street dance, 8 performed a jazz dance and 1 performed a tap dance.
Why is this diagram misleading? [1]
Mark scheme (a)
Answer
Marks
Part marks and guidance
Points plotted at (21, 18) and (7, 8)
1
Tolerance ±1 mm
Mark scheme (b)
Answer
Marks
Part marks and guidance
1 : 3
3
B2 for 3 : 9 oe or answer 3 : 1
or
B1 for 3 [dancers] or 9 [dancers] identified
If 0 scored then SC1 for 4 : 8 seen and simplified to 1 : 2
NOT from 4 : 12
May be on graph 4 : 12 simplified to 1 : 3 scores 0
Mark scheme (c)
Answer
Marks
Part marks and guidance
The wedges at the front look bigger than those at the back oe
1
Comments should refer to the 3D nature of the pie chart e.g. It’s tilted, slanted, seen from an angle etc. Ignore all references to missing angles, not being joined, etc. Mark the best bit unless contradicted
14 30 people choose their favourite sport. Matt wants to show their choices in a pie chart. 4 of the people chose ‘tennis’.
Work out the angle of the sector for ‘tennis’. [3]
Mark scheme
Answer
Marks
Part marks and guidance
48
3
M2 for 360 \(\div\) 30 \(\times\) 4 oe or M1 for one correct step 360 \(\div\) 30 soi 12 or 4 \(\div\) 30 soi 0.13... or 30 \(\div\) 4 soi 7.5 or 360 \(\times\) 4 soi 1440
1 In a dance competition, two judges each award scores out of 30. The scatter diagram shows the scores awarded to the first 10 dancers.
(a) Here are the scores for the next two dancers.
Judge A
21
7
Judge B
18
8
Plot their scores on the scatter diagram. [1]
(b) Dancers who are awarded a score of more than 20 by both judges receive a medal.
For the 12 dancers, express the ratio of medal winners to non-medal winners in its simplest form. [3]
(c) This chart shows the types of dance performed by the 12 dancers. 3 performed a street dance, 8 performed a jazz dance and 1 performed a tap dance.
Why is this diagram misleading? [1]
Mark scheme (a)
Answer
Marks
Part marks and guidance
Points plotted at (21, 18) and (7, 8)
1
Tolerance ±1 mm
Mark scheme (b)
Answer
Marks
Part marks and guidance
1 : 3
3
B2 for 3 : 9 oe or answer 3 : 1 or B1 for 3 [dancers] or 9 [dancers] identified
If 0 scored then SC1 for 4 : 8 seen and simplified to 1 : 2
NOT from 4 : 12 May be on graph 4 : 12 simplified to 1 : 3 scores 0
Mark scheme (c)
Answer
Marks
Part marks and guidance
The wedges at the front look bigger than those at the back oe
1
Comments should refer to the 3D nature of the pie chart e.g. It’s tilted, slanted, seen from an angle etc. Ignore all references to missing angles, not being joined, etc. Mark the best bit unless contradicted
10 This pie chart shows how the employees of a business travel to work.
Not to scale
(a) Find the ratio of the number of employees who cycle to work to the number of employees who walk to work.
Give your answer in its simplest form. [2]
(b) 80 employees travel to work by car.
Work out the number of employees who cycle to work and the number of employees who walk to work. [3]
Mark scheme (a)
Answer
Marks
Part marks and guidance
3 : 2 or 1.5 : 1 or 1 : \(\dfrac{2}{3}\)
2
M1 for 72 : 48 oe or SC1 for 2 : 3 or 1 : 1.5 or \(\dfrac{2}{3}\) : 1
For 2 marks or SC1 do not isw
Mark scheme (b)
Answer
Marks
Part marks and guidance
[cycle =] 24 [walk =] 16
3
M1 80 employees to 240° equivalent to 1 employee to 3° soi or for cycle + walk = 40 soi M1 for \(\dfrac{48}{\textit{their } 3}\) or \(\dfrac{72}{\textit{their } 3}\) soi or attempt to divide 40 employees in the ratio 72 : 48
eg 240 \(\div\) 80
One answer correct or correct answers reversed implies M1M1
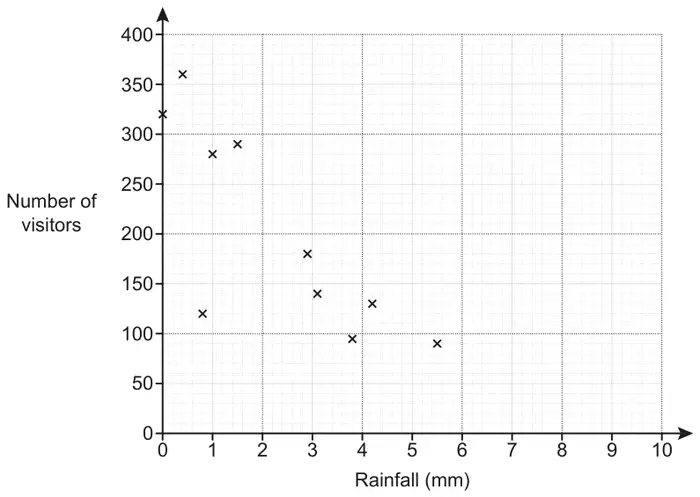
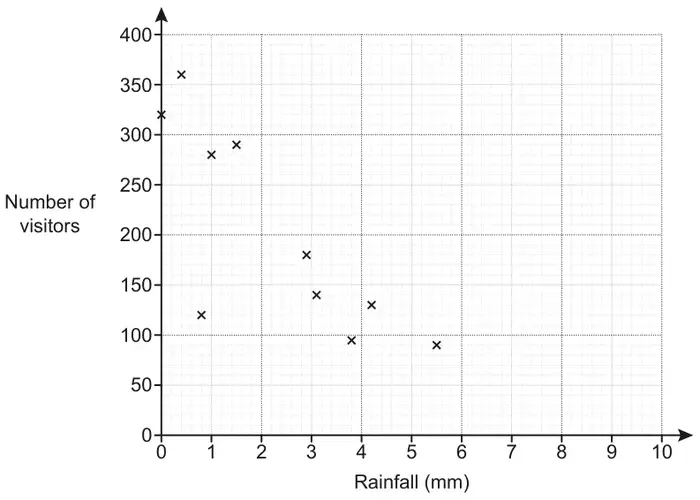
(a) The owner of a tourist attraction records the amount of rainfall, in millimetres, and the number of visitors each day. The results for 10 days are shown in the scatter diagram.
(i) Circle the outlier on the scatter diagram. [1]
(ii) The owner claims that he would expect around 320 visitors on a day with 2 mm of rainfall.
Does the scatter diagram support his statement? Explain how you made your decision. [2]
(iii) Explain why the scatter diagram should not be used to estimate the number of visitors on a day with 9 mm of rainfall. [1]
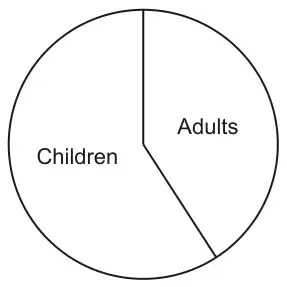
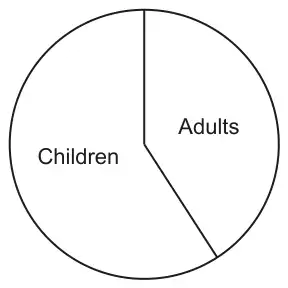
(b) The pie chart summarises information about the visitors to the tourist attraction on a different day.
Explain why the pie chart cannot be used to work out how many adults visited on that day. [1]
Mark scheme (a)
Answer
Marks
Part marks and guidance
(i) Point (0.8, 120) indicated
1
(ii) No oe and Correct supporting value(s) and justification
2
B1 for 200 to 260 visitors expected or about 0 to 1 mm and 320 or line of best fit within overlay or negative trend/correlation or markings in relevant region above 2mm or 2 or more values within overlay and surrounding 2mm
Justification includes Reference to line of best fit (drawn or not) or trend or negative correlation or markings in relevant region above 2mm or surrounding values See Appendix
(iii) Outside range of data [collected]
1
Accept “The data (or diagram) only goes to 5.5 (or 6)” oe
Do not accept “by 6 to 7 it would give no visitors” oe or There is no data around 9 mm oe The line of best fit does not reach 9 mm oe
Condone “[Because] there would be a negative number of people” See Appendix
Appendix
Exemplar responses for Q16(a)(ii)
Response
Mark
(line drawn on graph) no, following the scatter diagram points there would be an estimate of around 240 visitors Take “following the scatter diagram points” refers to the line and a supporting value
2
No we expect 250 (reference to line or markings drawn)
2
No, a line of best fit would show 250 (no line)
2
No, 0-1 mm shows 320 but we would expect less as it is decreases/negative trend
2
No, (point below 2mm and point above 2mm stated) so there is a negative trend
2
no as with 1mm rain its 280 visitors so with 2mm you should get around 245 B1 for 245 expected at 2mm but no reference to trend
1
having drawn a line of best fit the scatter diagram wouldn’t support this as it’s too big a number No explicit supporting value used
1
no, by looking at the diagram you would expect about 240 Supporting value in range but no justification
1
no because with 1mm there’s less than 320 visitors 1 mm and 320 are the supporting values but no reference to trend
1
no because there were 320 visitors on a day with 0mm rainfall 0 mm and 320 are the supporting values but no reference to trend
1
No we expect 250 (nothing else)
1
(No valid comment) line of best fit within overlay
1
No, 0-1 mm shows 320
1
No, 320 is for 1mm
1
No, negative trend
1
No, (point below 2mm and point above 2mm stated)
1
the scatter diagram doesn’t support his statement as there isn’t any rainfall that is 2mm No supporting value
0
no it doesn’t because when the rainfall was 2mm he didn’t have any visitors Wrong
0
the closest amount of visitors to 2mm of rainfall is 290 An estimate that is out of range and is probably referring to the nearest point plotted. No reference to trend
0
No, as on a day with 1mm there are fewer customers
0
Yes …
0
Exemplar responses for Q16(a)(iii)
Response
Mark
Outside range of data collected Perfect!!
1
because there is no data to show above 6mm of rainfall Equivalent answer
1
because the values of 7 and 8mm are not plotted, therefore it would be hard to estimate 9mm Similar to “no data around 9mm”
0
no record of any visitors are shown at 9mm of rainfall. Visitors stop coming when it hits 6mm of rainfall Equivalent to “no data for 9mm”
0
because there is not enough data to estimate the amount of visitors for 9mm of rainfall Does not say “no data beyond 5.5 (or 6) mm”
0
we don’t have the data to do a line of best fit Wrong
0
there is nothing recorded Wrong
0
you can’t plot this data the graph isn’t big enough Wrong
0
because that would create an outlier or anomalous piece of data Maybe but wrong
0
it wouldn’t be on the line Wrong
0
there would be under 50 visitors so it would be hard to get an accurate number Wrong
0
because the experiment was only tested for 10 days, you would need to have more evidence to estimate how many visitors would come on 9mm rainfall Probably correct but has missed the point that THESE data do not extend beyond 5.5 mm
0
because the rain might be too heavy for visitors to come True but not answering the question
0
Mark scheme (b)
Answer
Marks
Part marks and guidance
Total number or number of children is not known oe or The chart only shows proportions/percentages oe
1
Mark the best bit so long as no contradiction
See Appendix
Appendix
Exemplar responses for Q16(b)
Response
Mark
The total number of visitors is not known True
1
there is no value of the amount of visitors that day For value read number
1
because there are more children and it don’t say how many there are in total Mark the best bit and no contradiction
1
there is no numbers to help us find our answer Too vague, could be referring to angles or number of adults
0
the pie chart doesn’t show any figures or percentages Too vague, could be referring to angles or number of adults (and final part incorrect)
0
they don’t have enough information Too vague
0
because you can’t tell what the percentage is Wrong
0
the tourist attraction could be aimed at children Wrong
(a) The owner of a tourist attraction records the amount of rainfall, in millimetres, and the number of visitors each day.
The results for 10 days are shown in the scatter diagram.
(i) Circle the outlier on the scatter diagram. [1]
(ii) The owner claims that he would expect around 320 visitors on a day with 2 mm of rainfall.
Does the scatter diagram support his statement? Explain how you made your decision. [2]
(iii) Explain why the scatter diagram should not be used to estimate the number of visitors on a day with 9 mm of rainfall. [1]
(b) The pie chart summarises information about the visitors to the tourist attraction on a different day.
Explain why the pie chart cannot be used to work out how many adults visited on that day. [1]
Mark scheme (a)
Answer
Marks
Part marks and guidance
(i) Point (0.8, 120) indicated
1
(ii) No oe and Correct supporting value(s) and justification
2
B1 for 200 to 260 visitors expected or about 0 to 1mm and 320 or line of best fit within overlay or negative trend/correlation or marking(s) in relevant region above 2mm or 2 or more values within overlay and surrounding 2mm
Justification includes Reference to line of best fit (drawn or not) or trend or negative correlation or marking(s) in relevant region above 2mm or surrounding values
See Appendix
(iii) Outside range of data [collected]
1
Accept “The data (or diagram) only goes to 5.5 (or 6)” oe
Do not accept “by 6 to 7 it would give no visitors” oe or There is no data around 9 mm oe The line of best fit does not reach 9 mm oe
Condone “[Because] there would be a negative number of people”
See Appendix
Appendix: Exemplar responses for Q3(a)(ii)
Response
Mark
(line drawn on graph) no, following the scatter diagram points there would be an estimate of around 240 visitors Take “following the scatter diagram points” refers to the line and a supporting value
2
no as with 1mm rain its 280 visitors so with 2mm you should get around 245 B1 for 245 expected at 2mm but no reference to trend
1
having drawn a line of best fit the scatter diagram wouldn’t support this as it’s too big a number No explicit supporting value used
1
no, by looking at the diagram you would expect about 240 Supporting value in range but no justification
1
no because with 1mm there’s less than 320 visitors 1 mm and 320 are the supporting values but no reference to trend
1
no because there were 320 visitors on a day with 0mm rainfall 0 mm and 320 are the supporting values but no reference to trend
1
the scatter diagram doesn’t support his statement as there isn’t any rainfall that is 2mm No supporting value
0
no it doesn’t because when the rainfall was 2mm he didn’t have any visitors Wrong
0
the closest amount of visitors to 2mm of rainfall is 290 An estimate that is out of range and is probably referring to the nearest point plotted. No reference to trend
0
No we expect 250 (reference to line or markings drawn)
2
No, a line of best fit would show 250 (no line)
2
No we expect 250 (nothing else)
1
(No valid comment) line of best fit within overlay
1
OR
No, 0-1 mm shows 320 but we would expect less as it is decreases/negative trend
2
No, 0-1 mm shows 320
1
No, 320 is for 1mm
1
No, negative trend
1
No, as on a day with 1mm there are fewer customers
0
OR
No, (point below 2mm and point above 2mm stated) so there is a negative trend
2
No, (point below 2mm and point above 2mm stated)
1
Yes …
0
Appendix: Exemplar responses for Q3(a)(iii)
Response
Mark
Outside range of data collected Perfect!!
1
because there is no data to show above 6mm of rainfall Equivalent answer
1
because the values of 7 and 8mm are not plotted, therefore it would be hard to estimate 9mm Similar to “no data around 9mm”
0
no record of any visitors are shown at 9mm of rainfall. Visitors stop coming when it hits 6mm of rainfall Equivalent to “no data for 9mm”
0
because there is not enough data to estimate the amount of visitors for 9mm of rainfall Does not say “no data beyond 5.5 (or 6) mm”
0
we don’t have the data to do a line of best fit Wrong
0
there is nothing recorded Wrong
0
you can’t plot this data the graph isn’t big enough Wrong
0
because that would create an outlier or anomalous piece of data Maybe but wrong
0
Mark scheme (b)
Answer
Marks
Part marks and guidance
Total number or number of children is not known oe or The chart only shows proportions/percentages oe
1
Mark the best bit so long as no contradiction
See Appendix
Appendix: Exemplar responses for Q3(b)
Response
Mark
The total number of visitors is not known True
1
there is no value of the amount of visitors that day For value read number
1
because there are more children and it don’t say how many there are in total Mark the best bit and no contradiction
1
there is no numbers to help us find our answer Too vague, could be referring to angles or number of adults
0
the pie chart doesn’t show any figures or percentages Too vague, could be referring to angles or number of adults (and final part incorrect)