
1MA0 Foundation March 2013 Paper 2 Q19
19 The pie chart shows some information about the time Gill spent working in her garden one month.
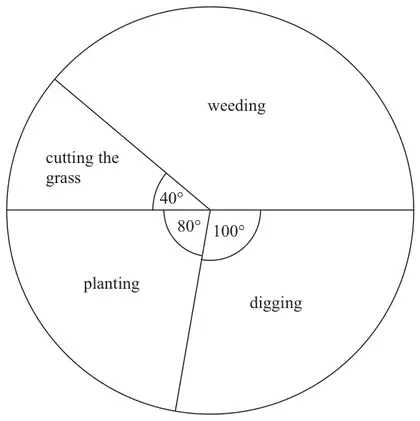
(a) What fraction of the time did Gill spend cutting the grass? (1)
Gill spent 7 hours weeding.
(b) How much time did Gill spend planting?
hours (3)
hours (3)
| Answer | Mark | Notes |
|---|---|---|
| \(\frac{40}{360}\) | 1 | B1 for \(\frac{40}{360}\) oe (ignore any incorrect simplification) Accept 0.11…. if no fraction shown |
| Answer | Mark | Notes |
|---|---|---|
| 4 | 3 | M1 for a correct method to find the angle of the ‘weeding’ sector If measured, accept an angle between 138 and 142 inc. M1 (dep) for a correct method to find the number of degrees per hour (= 20) or the number of hours (\(\frac{1}{20}\)) (3 mins) per degree A1 cao for 4 |