
Foundation November 2017 Paper 1 Q30
30 The four candidates in an election were A, B, C and D.
The pie chart shows the proportion of votes for each candidate.
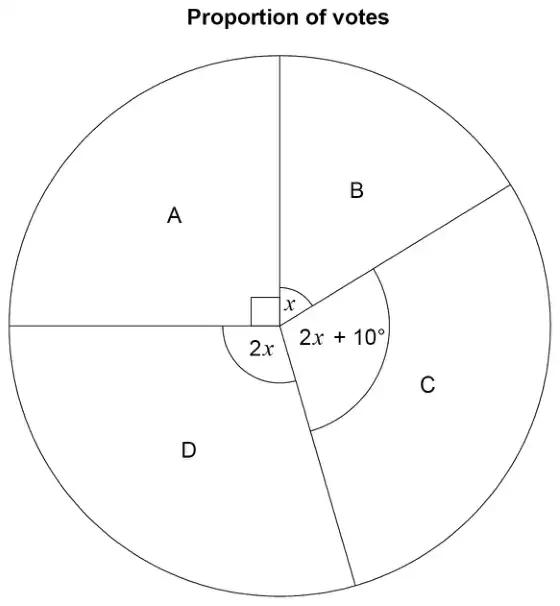
Not drawn accurately
Work out the probability that a person who voted, chosen at random, voted for C. [4 marks]
| Answer | Mark | Comments |
|---|---|---|
| Alternative method 1 | ||
| \(x + 2x + 2x + 10\) or \(5x + 10\) or \(x + 2x + 2x + 10 + 90\) or \(5x + 100\) | M1 | oe |
| \(x + 2x + 2x + 10 = 360 - 90\) or \(5x + 10 = 270\) or \(x + 2x + 2x + 10 + 90 = 360\) or \(5x + 100 = 360\) or \(5x = 260\) | M1dep | oe |
| (\(x\) =) 52 or \(2x = 104\) or \(2x + 10 = 114\) | A1 | may be on diagram |
| \(\dfrac{114}{360}\) or \(\dfrac{57}{180}\) or \(\dfrac{38}{120}\) or \(\dfrac{19}{60}\) or 0.31(6..) or 0.317 or 0.32 or 31(.6…)% or 31.7% or 32% | B1ft | ft \(\dfrac{2 \times \text{their } 52 + 10}{360}\) or \(\dfrac{\text{their angle for C}}{360}\) |
| Alternative method 2 | ||
| \(\dfrac{90}{360} + \dfrac{x}{360} + \dfrac{2x}{360} +\) P(C) = 1 or \(\dfrac{90}{360} + \dfrac{x}{360} + \dfrac{2x}{360} + \dfrac{2x + 10}{360}\) or \(\dfrac{2x + 10}{5x + 100}\) | M1 | oe |
| \(\dfrac{90}{360} + \dfrac{x}{360} + \dfrac{2x}{360} + \dfrac{2x + 10}{360} = 1\) | M1dep | oe |
| (\(x\) =) 52 or \(2x = 104\) or \(2x + 10 = 114\) | A1 | may be on diagram |
| \(\dfrac{114}{360}\) or \(\dfrac{57}{180}\) or \(\dfrac{38}{120}\) or \(\dfrac{19}{60}\) or 0.31(6..) or 0.317 or 0.32 or 31(.6…)% or 31.7% or 32% | B1ft | ft \(\dfrac{2 \times \text{their } 52 + 10}{360}\) or \(\dfrac{\text{their angle for C}}{360}\) |
Additional guidance
| Ignore incorrect simplification or conversion after \(\dfrac{114}{360}\) oe | M1M1A1B1 |
| \(\dfrac{360 - 10 - 90}{5}\) oe | M1M1 |
| \(x + 2x + 2x + 10\) followed by \(6x + 10 = 270\) | M1M0 |
| Do not accept decimal within fraction for final answer if correct fraction not seen | |
| The follow through is not available if A1 awarded |