
1MA0 Foundation June 2014 Paper 1 Q17
17 The table gives information about the results of the matches a football team played.
| Result | Frequency |
|---|---|
| Won | 28 |
| Drawn | 12 |
| Lost | 20 |
Draw an accurate pie chart to show this information.
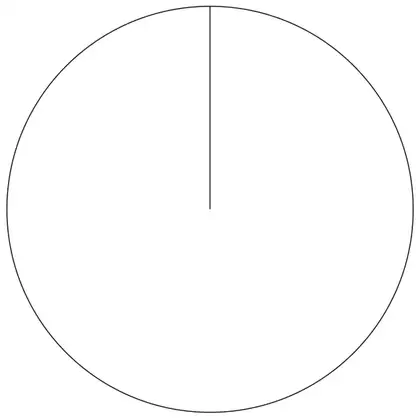
(4)
| Answer | Mark | Notes |
|---|---|---|
| 168, 72, 120 | 4 | M1 for evidence of method for at least one angle (could be implied by working or one correct angle on pie chart or in table) A2 for all angles drawn correctly ±2° (A1 for at least one angle drawn correctly or all angles correct in table) B1 for sectors labelled with results (dependent on at least one angle drawn correctly and exactly three sectors) |